1118
Quantitative relaxometry values can effectively assist menicius injury level in knee1Department of Radiology, Taihe Hospital, Hubei University of Medicine, Hubei, China, 2GE Healthcare, Beijing, China, 3Shiyan Taihe Hospital, Hubei, China, 4Biomedical Engneering College, Hubei University of Medicine, Hubei, China
Synopsis
Keywords: Osteoarthritis, Cartilage
Knee meniscus tears cause fibrocartilage degeneration. Grade III meniscus is viewed as complete meniscus injury and should be further confirmed for the requirement of surgical intervention via arthroscopy. MAGiC provides quantitative relaxometry values. Our study showed that Grade III meniscus can be distinguished from Grade II ones using T1, T2 and PD. This finding suggested MAGiC can assist clinical follow-ups of knee meniscus and screen the indications for arthroscopic surgery.Introduction
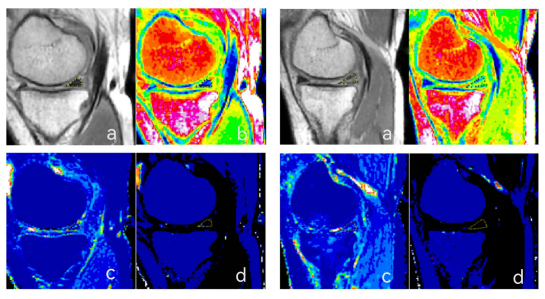
Osteoarthritis (OA) is one of the most common types of arthritis and often occurs in the knee joint. Severity leads to disability in middle-aged and elderly people. Although the pathogenesis of OA is not clear, it is generally believed that the onset of OA may be related to genetics, obesity, trauma, inflammation and metabolism[1]. Knee meniscus is a type of crescent fibrocartilage, and meniscus tears cause articular fluid to penetrates in with the pathological manifest of fibrocartilage degeneration. That is, chondrocytes and capillaries accumulate and grow in these areas that collagen fibers separate from [2] .Compared to the degenerated meniscus, the meniscus that tears suffer serious morphological damage, volume shrinkage, uneven surface, obviously weakening of tension and loss of function. In other words, the content of collagen fiber in the injured meniscus decreased[3] . To quantitative evaluation rather than qualitative assessment may assist to determine clinical treatment. Magnetic Resonance Image Compilation (MAGiC) sequence is a spin echo-based sequence with the feature of multiple echo time and delay time. It can generate multiple contrast images and quantitative maps in relative short scan time; the former can be also obtained by adjusting echo time (TE), repetition time (TR) and inversion time (IR) on MR console to meet the needs of specific diseases or lesions for clinical diagnosis while the latter are automatically generated to on-spot quantitative analyze lesions or defects and even long-term follow-ups. Therefore, we aim to explore the diagnostic efficacy of MAGiC on differentiate severity of meniscus and even early detection of molecular alterations to prevent meniscus progression.Materials and methods
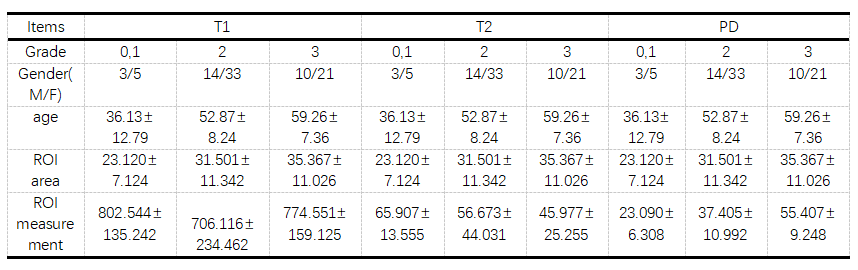
This prospective study included 87 patients suspected of OA from May 2022 to October 2022. All participants underwent routine MRI sequences and also MAGiC sequence (TR=4000, TE=13.2, NEX =1, voxel size = 0.8×0.8 ×2.5 mm2, gap = 0.5mm) on 1.5T MR Scanner (Signa Voyager, GE Healthcare). Meniscus Whole-Organ Magnetic Resonance Imaging Score (WOMRS) was evaluated by a radiologist with 3-year experience in musculoskeletal radiographs. Regions of interest (ROIs) for the damaged meniscus were drawn on the synthetic proton density weighted images (PDWI), and then copied to T1, T2 and PD maps to retrieve measurements. Measurements were repeated two weeks later by the radiologist. Intra-observer agreement was tested using intra-group correlation coefficients (ICC). All data were presented in mean±standard deviation (xˉ±s). Spearman correlation was examined for the correlation of meniscus WOMRS and quantitative parameters (T1, T2 and PD) after controlling for area measurements. Independent sample t-test or Mann-Whitney U test was used for comparison between different meniscus WOMRS according normality and equality-of-variances respectively examined by Kolmogorov-Smirnov test and Levene's-Test. Receiver operating characteristic (ROC) curve and the area under the ROC curve (AUC) were used to check differentiation performance of all parameters between groups. P<0.05 was considered statistically significant.Results
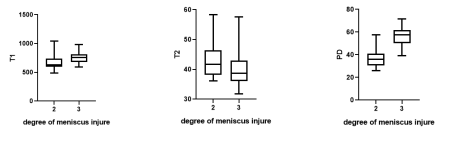
The relaxometry values and area measurements showed a good intra-rater consistency between measurements. The severity of medial posterior meniscus was significantly correlated with T1 (r = -0.272, P= 0.030), T2 (r = -0.278, P= 0.026) and PD values (r = 0.692, P = 0.000). Due to few patients with WOMRS = 0 and 1, only those with WOMRS = 2 and 3 were analyzed for correlation and comparison in this study. No significant difference of areas between WOMRS II and III was found (P=0.194). Between patients with WOMRS II and III, significant difference of T1, T2 and PD in medial posterior meniscus were found (P= 0.009, 0.040 and 0.000).Discussion and conclusions
Tear severity of medial posterior meniscus can be distinctly differentiated by T1, T2 and PD using the largest cross-section ROI measure. quantitative values. The abnormal signals of meniscus with Grade I and Ⅱ are regarded as transgender while those of meniscus with Grade Ⅲ are reckoned as tear [4,5]. Meniscus with Grade Ⅲ is complete meniscus injury and should be further determined for the requirement of surgical intervention via arthroscopy. Therefore, to monitor the meniscus progression as it tears is essential and might reverse degeneration under the condition of early detect the status of meniscus and appropriate treatments [6]. Our finding suggested a time-saving MAGiC imaging sequence had great potential in prognosis of meniscus and assistance of treatment selection and long-term follow-ups without invasive arthroscopic surgery.Acknowledgements
I would like to express my gratitude to all those who have helped me during the writing of this abstract. I gratefully acknowledge the help of my supervisor Professor Wen Chen. I do appreciate his patience, encouragement,and professional instructions during my abstract writing.Also,I would like to thank Weiyin Vivian Liu, for her instructive advice and useful suggestions on my abstract.I am deeply grateful of her help in the completionof this abstract.I am also deeply indebted to all the other tutors and teachers in this study for their direcct or indirect help to me.Last but not the least,my gratitude also extends to my parents for their continuous support and encouragement all of my life.References
[1]Sharma K, Eckstein F, Wirth W, Emmanuel K. Meniscus position and size in knees with versus without structural knee osteoarthritis progression: data from the osteoarthritis initiative. Skeletal Radiol. 2022 May;51(5):997-1006. doi: 10.1007/s00256-021-03911-8. Epub 2021 Sep 30. PMID: 34591163; PMCID: PMC8930934.
[2] Nebelung S, Dötsch L, Shah D, Abrar DB, Linka K, Knobe M, Sewerin P, Thüring J, Kuhl C, Truhn D. Functional MRI Mapping of Human Meniscus Functionality and its Relation to Degeneration. Sci Rep. 2020 Feb 12;10(1):2499. doi: 10.1038/s41598-020-59573-4. PMID: 32051526; PMCID: PMC7016001.
[3]Bloecker K, Wirth W, Guermazi A, Hitzl W, Hunter DJ, Eckstein F. Longitudinal change in quantitative meniscus measurements in knee osteoarthritis--data from the Osteoarthritis Initiative. Eur Radiol. 2015 Oct;25(10):2960-8. doi: 10.1007/s00330-015-3710-7. Epub 2015 Mar 24. PMID: 25801196.
[4]Pownder SL, Hayashi K, Caserto BG, Breighner RE, Norman ML, Potter HG, Koff MF. Quantitative Magnetic Resonance Imaging and Histological Comparison of Normal Canine Menisci. Vet Comp Orthop Traumatol. 2018 Nov;31(6):452-457. doi: 10.1055/s-0038-1668115. Epub 2018 Oct 22. PMID: 30347412.
[5]Foreman SC, Liu Y, Nevitt MC, Neumann J, Joseph GB, Lane NE, McCulloch CE, Link TM. Meniscal Root Tears and Extrusion Are Significantly Associated with the Development of Accelerated Knee Osteoarthritis: Data from the Osteoarthritis Initiative. Cartilage. 2021 Dec;13(1_suppl):239S-248S. doi: 10.1177/1947603520934525. Epub 2020 Jun 21. PMID: 32567341; PMCID: PMC8808926.
[6]Murphy AN, Yelverton B, Clesham K, Hassell K, Kavanagh E, Eustace S, Cashman J. Does MRI Knee in Those over 50 Years with Knee Pain in Osteoarthritis Alter Management? A Retrospective Review. J Knee Surg. 2021 Dec 8. doi: 10.1055/s-0041-1740390. Epub ahead of print. PMID: 34879407.
Figures