1117
Layers-Based Analysis of Knee Articular Cartilage: Comparing T1ρ Imaging Against Quantitative Susceptibility Mapping at 3 Tesla1School of Medicine, Queen's University, Kingston, ON, Canada, 2Emory Sports Performance And Research Center, Flowery Branch, GA, United States, 3Neuroscience Graduate Program, University of Cincinnati, Cincinnati, OH, United States, 4Emory Sports Medicine Center, Atlanta, GA, United States, 5Department of Orthopaedics, Emory University School of Medicine, Atlanta, GA, United States, 6Department of Kinesiology, University of North Carolina at Greensboro, Greensboro, NC, United States, 7GE Healthcare, Atlanta, GA, United States, 8School of Biomedical Engineering, Shanghai Jiao Tong University, Shanghai, China, 9Department of Orthopaedics, Queen's University, Kingston, ON, Canada, 10The Micheli Center for Sports Injury Prevention, Waltham, MA, United States
Synopsis
Keywords: Cartilage, Microstructure, Quantitative Susceptibility Mapping, T1rho, knee
The vertical microstructural organization of articular cartilage varies in its arrangement of collagen fibers, as well as the relative proteoglycan content. Knee osteoarthritis (OA) involves an inflammatory degenerative process that leads to depth-wise degeneration of the cartilaginous matrix. While quantitative MR protocols have emerged to evaluate proteoglycan content (T1ρ) and microstructural integrity (Quantitative Susceptibility Mapping; QSM), advances in layer-based analyses (e.g., superficial vs. deep) are warranted to identify the progression of diseased cartilage. We demonstrate the integrated utilization of QSM and T1ρ for characterizing depth-specific microstructural arrangement of articular cartilage, including differences in tissue organization and composition, respectively.INTRODUCTION
Osteoarthritis (OA) is characterized by degenerative changes within the articular cartilage, resulting from sustained intra-articular inflammation.1 The onset of clinical symptoms is preceded by thinning of the cartilaginous tissue, secondary to microstructural breakdown of the collagen-proteoglycan matrix.2-4 While the arrangement of the articular cartilage varies across its depth,5,6 early loss of proteoglycans is theorized to originate from the superficial layer, followed by depth-wise degeneration of the cartilaginous matrix.3To date, magnetic resonance imaging (MRI) including T1ρ and Quantitative Susceptibility Mapping (QSM) have been used to characterize OA-based cartilage degeneration.7-11 T1ρ correlates inversely with cartilaginous proteoglycan content, providing insight into tissue composition,12-15 whereas QSM is sensitive to the orientation of collagen fibers, uniquely permitting depth-wise evaluation of microstructural tissue arrangement.7 The purpose of this study was to evaluate depth-specific differences in T1ρ relaxation times and susceptibility for the evaluating of tissue composition and organization, respectively.
METHODS
This study was approved by the institutional review board at Emory University and collected at Emory Sports Performance and Research Center (SPARC; Flowery Branch, GA, USA). Twenty participants with no previous knee injuries provided written informed consent and completed sequential bilateral knee imaging. A total of 40 image datasets were collected and analyzed (10M/10F, average age, weight, and height of 22.2 ± 3.4 years, 78.0 ± 13.0 kg and 176 ± 12 cm, respectively).Imaging was acquired on a 3.0 Tesla GE SIGNA Premier scanner (General Electric; Milwaukee, Wisconsin) using an 18-channel T/R knee coil (Quality Electrodynamics, Mayfield Village, OH, USA). The T1ρ imaging protocol included a sagittal 3D MAPSS (magnetization-prepared angle-modulated partitioned-k-space SPGR sequence) with the following parameters: sampling resolution (0.3125 x 0.3125 x 3 mm), TR/TE (4.5 ms/minimum), flip angle (70°), acquisition/reconstruction matrices (192 x 192 / 512 x 512), number of slices (32), spin lock times (0, 10, 30, 60, 90, 120ms), total scan time (7 min. 49 sec.). QSM data was acquired using a sagittal 3D spoiled gradient echo sequence, parameters included: sampling resolution (0.3125 x 0.3125 x 2 mm), TR/TE (26/5.1 ms), flip angle (15°), acquisition/reconstruction matrices (512 x 512), number of slices (72) and total scan time (7 min. 11 sec.).
The magnitude image from QSM was co-registered to a custom in-house atlas.16-19 Warping fields were inverted back into native space, allowing for partial volume classification of bony structures (i.e., femur, fibula, patella, and tibia) and the articular cartilage (i.e., femoral condyle, lateral tibial condyle, medial tibial condyle, patellofemoral) (FIGURE 1). Voxelwise QSM maps were computed using adapted scripts from the STI Suite (https://people.eecs.berkeley.edu/~chunlei.liu/software.html).7,8,20-22
To ensure co-localized regional sampling between the QSM and T1ρ, spin lock time (TSL) echoes were resampled linearly to the native magnitude image. The partial volume classification was then projected onto the T1ρ echoes to isolate the articular cartilage and compute voxelwise T1ρ relaxation times. This was done using:
$$S_((TSL))=S_0∙e^((-TSL⁄T1_ρ ))$$
where S represents the signal intensity, TSL corresponds to the duration of the TSL (ms), S0 is the signal intensity when the TSL equals 0, and T1ρ is the constant relaxation time in the rotating frame (ms) (FIGURE 1).
Depth specific susceptibility and T1ρ estimates were averaged from a 12 x 10 mm volume within the weight bearing regions of the medial and lateral tibiofemoral compartment, and split into five vertical layers (FIGURE 2). Intra-layer differences were assessed statistically using Kruskal-Wallis testing, with statistical significance set at p < 0.05. Intra-subject coefficients of variation (COV) were compared between the QSM and T1ρ measurements using a ratio of the group’s mean and standard deviation.
RESULTS/DISCUSSION
QSM showed a layer-based gradient ranging from negative to positive susceptibility, in line with the transition from the deep to superficial layers, whereby the majority of layers differed from one another, as summarized in Figure 3A (p < 0.05). These data corroborate prior literature indicating distinct relationships between susceptibility and orientation of the collagen.7Briefly, fibers parallel to B0 (i.e., deep layers) are more diamagnetic and thus induce a negative susceptibility, while fibers perpendicular to B0 (i.e., superficial layers) have paramagnetic properties leading to positive susceptibility.7Depth-specific differences for T1ρ were mostly compartmentalized into deep (layers 1-2) and superficial (layers 4-5) regions, as opposed to more layer-by-layer segregation observed with QSM (Figure 3B). Deeper layers showed lower T1ρ relaxation times. These results are in line with the current literature indicating denser proteoglycan content (i.e., lower T1ρ) in deeper cartilaginous zones, highlighting T1ρ’s utility as a substrate for proteoglycan content.5,23,24
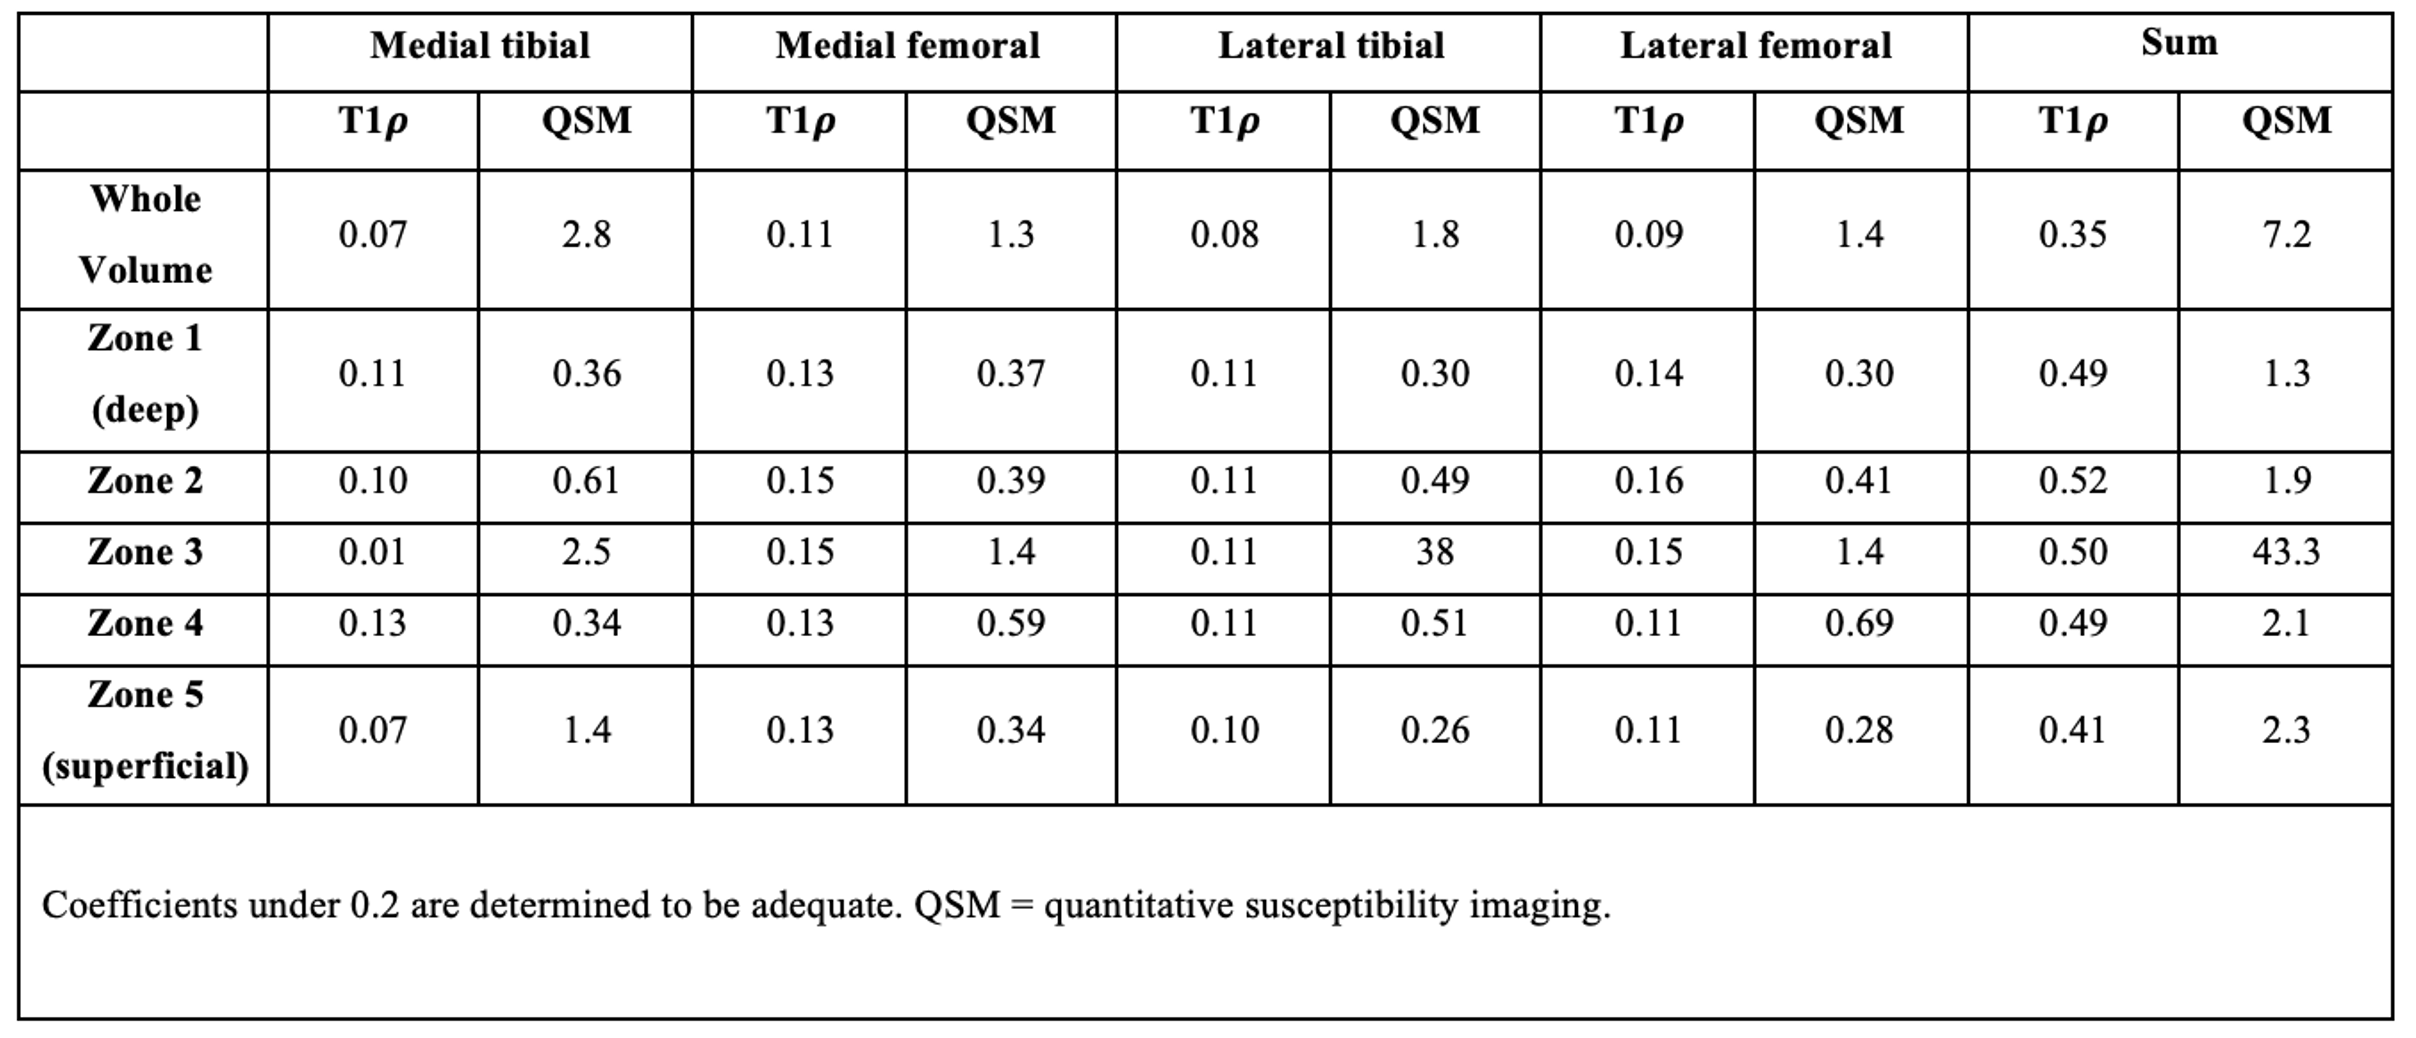
Overall, QSM measurements showed greater inter-subject variability compared to T1ρ, with layer 3 being distinctively more variable compared to adjacent layers (Figure 4). Differences unique to layer 3 may be due to the bidirectional nature of the QSM measurement, as the cartilage transitions between deeper (negative QSM) to more superficial (positive QSM) zones, resulting in a mean around zero around layer 3.
CONCLUSION
Our data indicate the potential for layer-based analyses of QSM and T1ρ to provide complementary insight into the tissue organization (QSM) and composition (T1ρ) of knee cartilage. Future research combining both imaging will reveal its sensitivity to degenerative changes associated with OA progression, potentially allowing for earlier identification of disease prior to clinical onset of symptoms.Acknowledgements
No acknowledgement found.References
1. Lv Z, Yang YX, Li J, et al. Molecular Classification of Knee Osteoarthritis. Front Cell Dev Biol. 2021;9:725568.
2. Firestein G, Kelley W, Budd R. Kelley’s textbook of rheumatology 2012.
3. Saarakkala S, Julkunen P, Kiviranta P, Makitalo J, Jurvelin JS, Korhonen RK. Depth-wise progression of osteoarthritis in human articular cartilage: investigation of composition, structure and biomechanics. Osteoarthritis Cartilage. 2010;18(1):73-81.
4. Dijkgraaf LC, de Bont LG, Boering G, Liem RS. The structure, biochemistry, and metabolism of osteoarthritic cartilage: a review of the literature. J Oral Maxillofac Surg. 1995;53(10):1182-1192.
5. Sophia Fox AJ, Bedi A, Rodeo SA. The basic science of articular cartilage: structure, composition, and function. Sports Health. 2009;1(6):461-468.
6. Eschweiler J, Horn N, Rath B, et al. The Biomechanics of Cartilage-An Overview. Life (Basel). 2021;11(4).
7. Wei H, Dibb R, Decker K, et al. Investigating magnetic susceptibility of human knee joint at 7 Tesla. Magn Reson Med. 2017;78(5):1933-1943.
8. Wei H, Lin H, Qin L, et al. Quantitative susceptibility mapping of articular cartilage in patients with osteoarthritis at 3T. J Magn Reson Imaging. 2019;49(6):1665-1675.
9. Atkinson HF, Birmingham TB, Moyer RF, et al. MRI T2 and T1rho relaxation in patients at risk for knee osteoarthritis: a systematic review and meta-analysis. BMC Musculoskelet Disord. 2019;20(1):182.
10. Li X, Pedoia V, Kumar D, et al. Cartilage T1rho and T2 relaxation times: longitudinal reproducibility and variations using different coils, MR systems and sites. Osteoarthritis Cartilage. 2015;23(12):2214-2223.
11. Link TM, Li X. Establishing compositional MRI of cartilage as a biomarker for clinical practice. Osteoarthritis Cartilage. 2018;26(9):1137-1139.
12. Regatte RR, Akella SV, Wheaton AJ, et al. 3D-T1rho-relaxation mapping of articular cartilage: in vivo assessment of early degenerative changes in symptomatic osteoarthritic subjects. Acad Radiol. 2004;11(7):741-749.
13. Regatte RR, Akella SV, Lonner JH, Kneeland JB, Reddy R. T1rho relaxation mapping in human osteoarthritis (OA) cartilage: comparison of T1rho with T2. J Magn Reson Imaging. 2006;23(4):547-553.
14. Akella SV, Regatte RR, Gougoutas AJ, et al. Proteoglycan-induced changes in T1rho-relaxation of articular cartilage at 4T. Magn Reson Med. 2001;46(3):419-423.
15. Duvvuri U, Kudchodkar S, Reddy R, Leigh JS. T(1rho) relaxation can assess longitudinal proteoglycan loss from articular cartilage in vitro. Osteoarthritis Cartilage. 2002;10(11):838-844.
16. Jenkinson M, Beckmann CF, Behrens TE, Woolrich MW, Smith SM. Fsl. Neuroimage. 2012;62(2):782-790.
17. Smith SM, Jenkinson M, Woolrich MW, et al. Advances in functional and structural MR image analysis and implementation as FSL. Neuroimage. 2004;23 Suppl 1:S208-219.
18. Jenkinson M, Bannister P, Brady M, Smith S. Improved optimization for the robust and accurate linear registration and motion correction of brain images. Neuroimage. 2002;17(2):825-841.
19. Jenkinson M, Smith S. A global optimisation method for robust affine registration of brain images. Med Image Anal. 2001;5(2):143-156.
20. Wu B, Li W, Guidon A, Liu C. Whole brain susceptibility mapping using compressed sensing. Magn Reson Med. 2012;67(1):137-147.
21. Wei H, Dibb R, Zhou Y, et al. Streaking artifact reduction for quantitative susceptibility mapping of sources with large dynamic range. NMR Biomed. 2015;28(10):1294-1303.
22. Wei H, Zhang Y, Gibbs E, Chen NK, Wang N, Liu C. Joint 2D and 3D phase processing for quantitative susceptibility mapping: application to 2D echo-planar imaging. NMR Biomed. 2017;30(4).
23. Singh A, Haris M, Cai K, Kogan F, Hariharan H, Reddy R. High resolution T1rho mapping of in vivo human knee cartilage at 7T. PLoS One. 2014;9(5):e97486.
24. Regatte RR, Akella SV, Borthakur A, Kneeland JB, Reddy R. Proteoglycan depletion-induced changes in transverse relaxation maps of cartilage: comparison of T2 and T1rho. Acad Radiol. 2002;9(12):1388-1394.
Figures
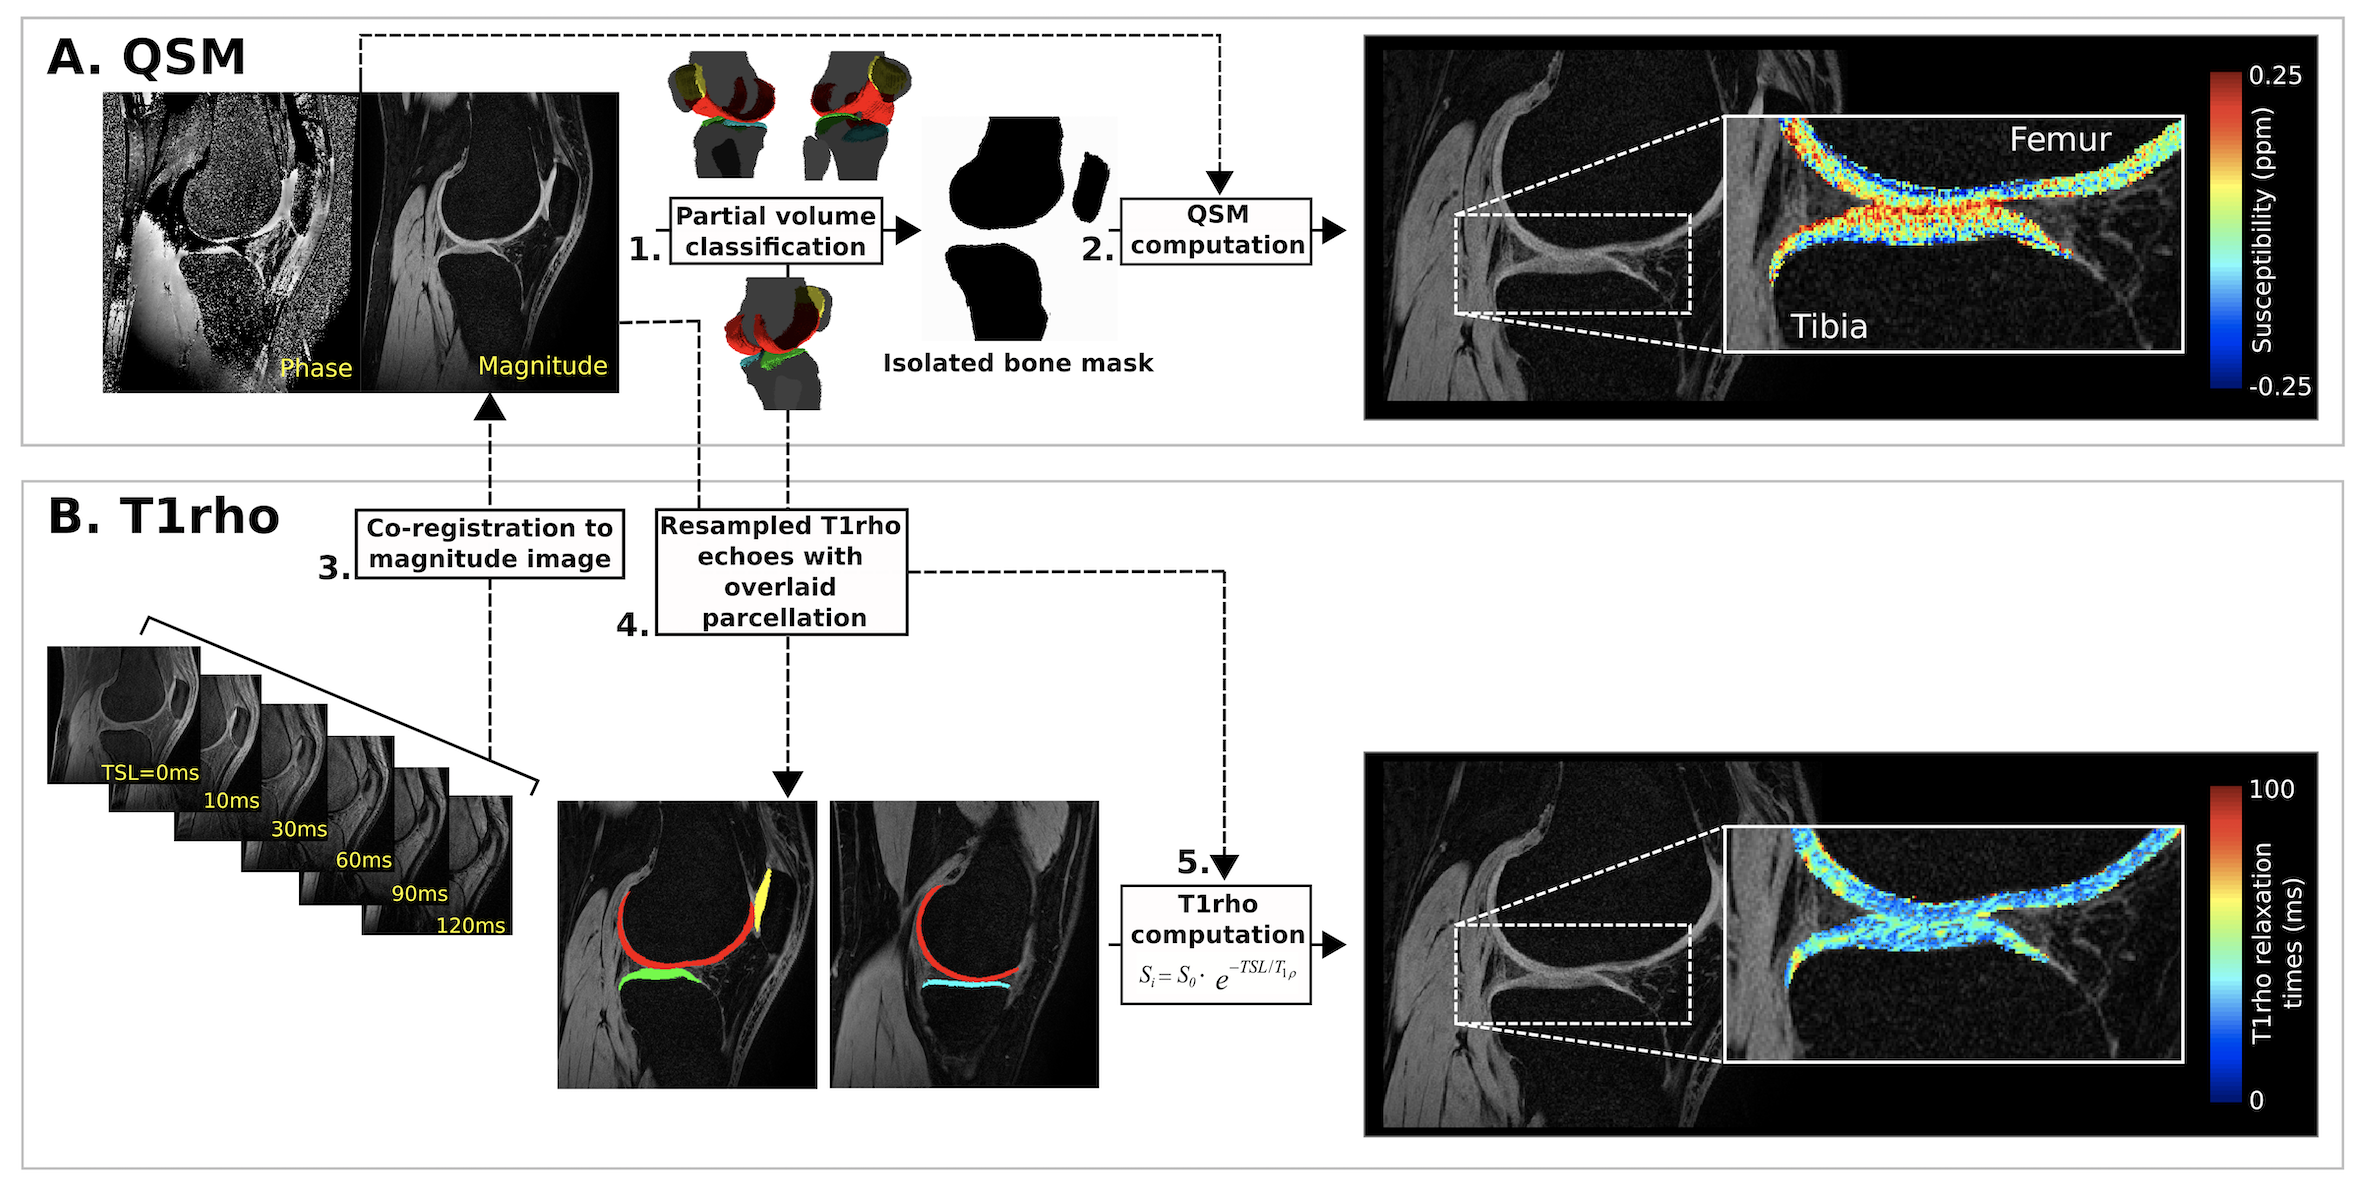
Figure 1. Computation of QSM and T1ρ within the articular cartilage
(A) Prior to voxelwise Quantitative Susceptibility Mapping (QSM) (2), the magnitude image was aligned with an atlas for partial volume classification (1) of the bony and cartilaginous structures. (B) To ensure co-localized regional sampling, T1ρ echoes were then co-registered with the subject’s magnitude map (3) allowing for deprojection of the partial volume parcellation (4) and voxelwise computation of the T1ρ maps (5).
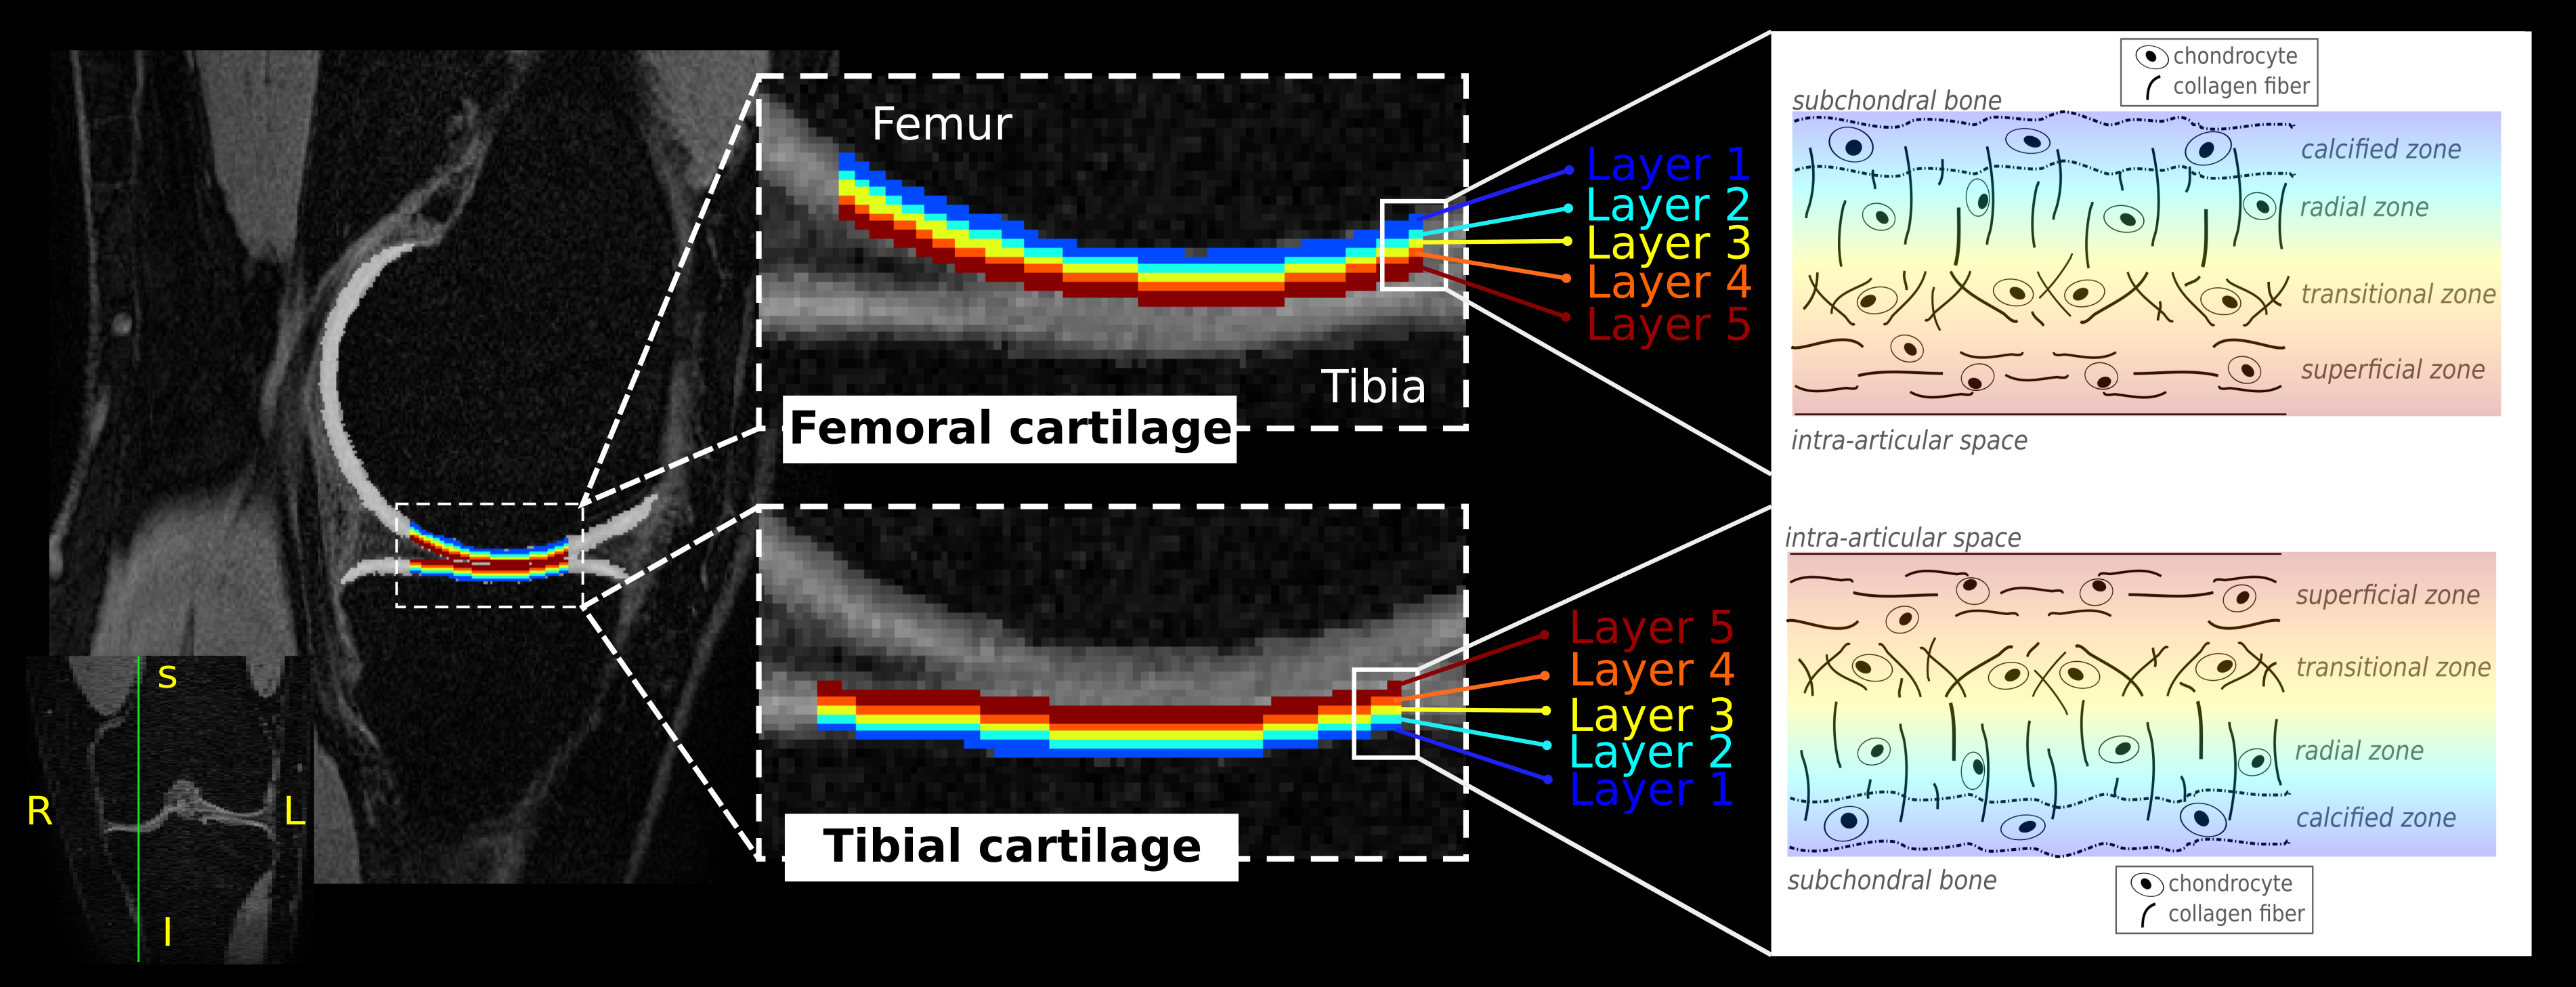
Figure 2. Layer-based segmentation of the femoral and tibial articular cartilage in the knee
An example of the femoral (top) and tibial (bottom) cartilage loading regions-of-interest is provided. Layer 1 (blue; deep) is always closest to the subchondral bone, moving toward layer 5 (red; superficial), which is closest to the intra-articular space. A structural schema of the different zones making up the cartilaginous matrix is drawn to act as a reference (right-hand side).
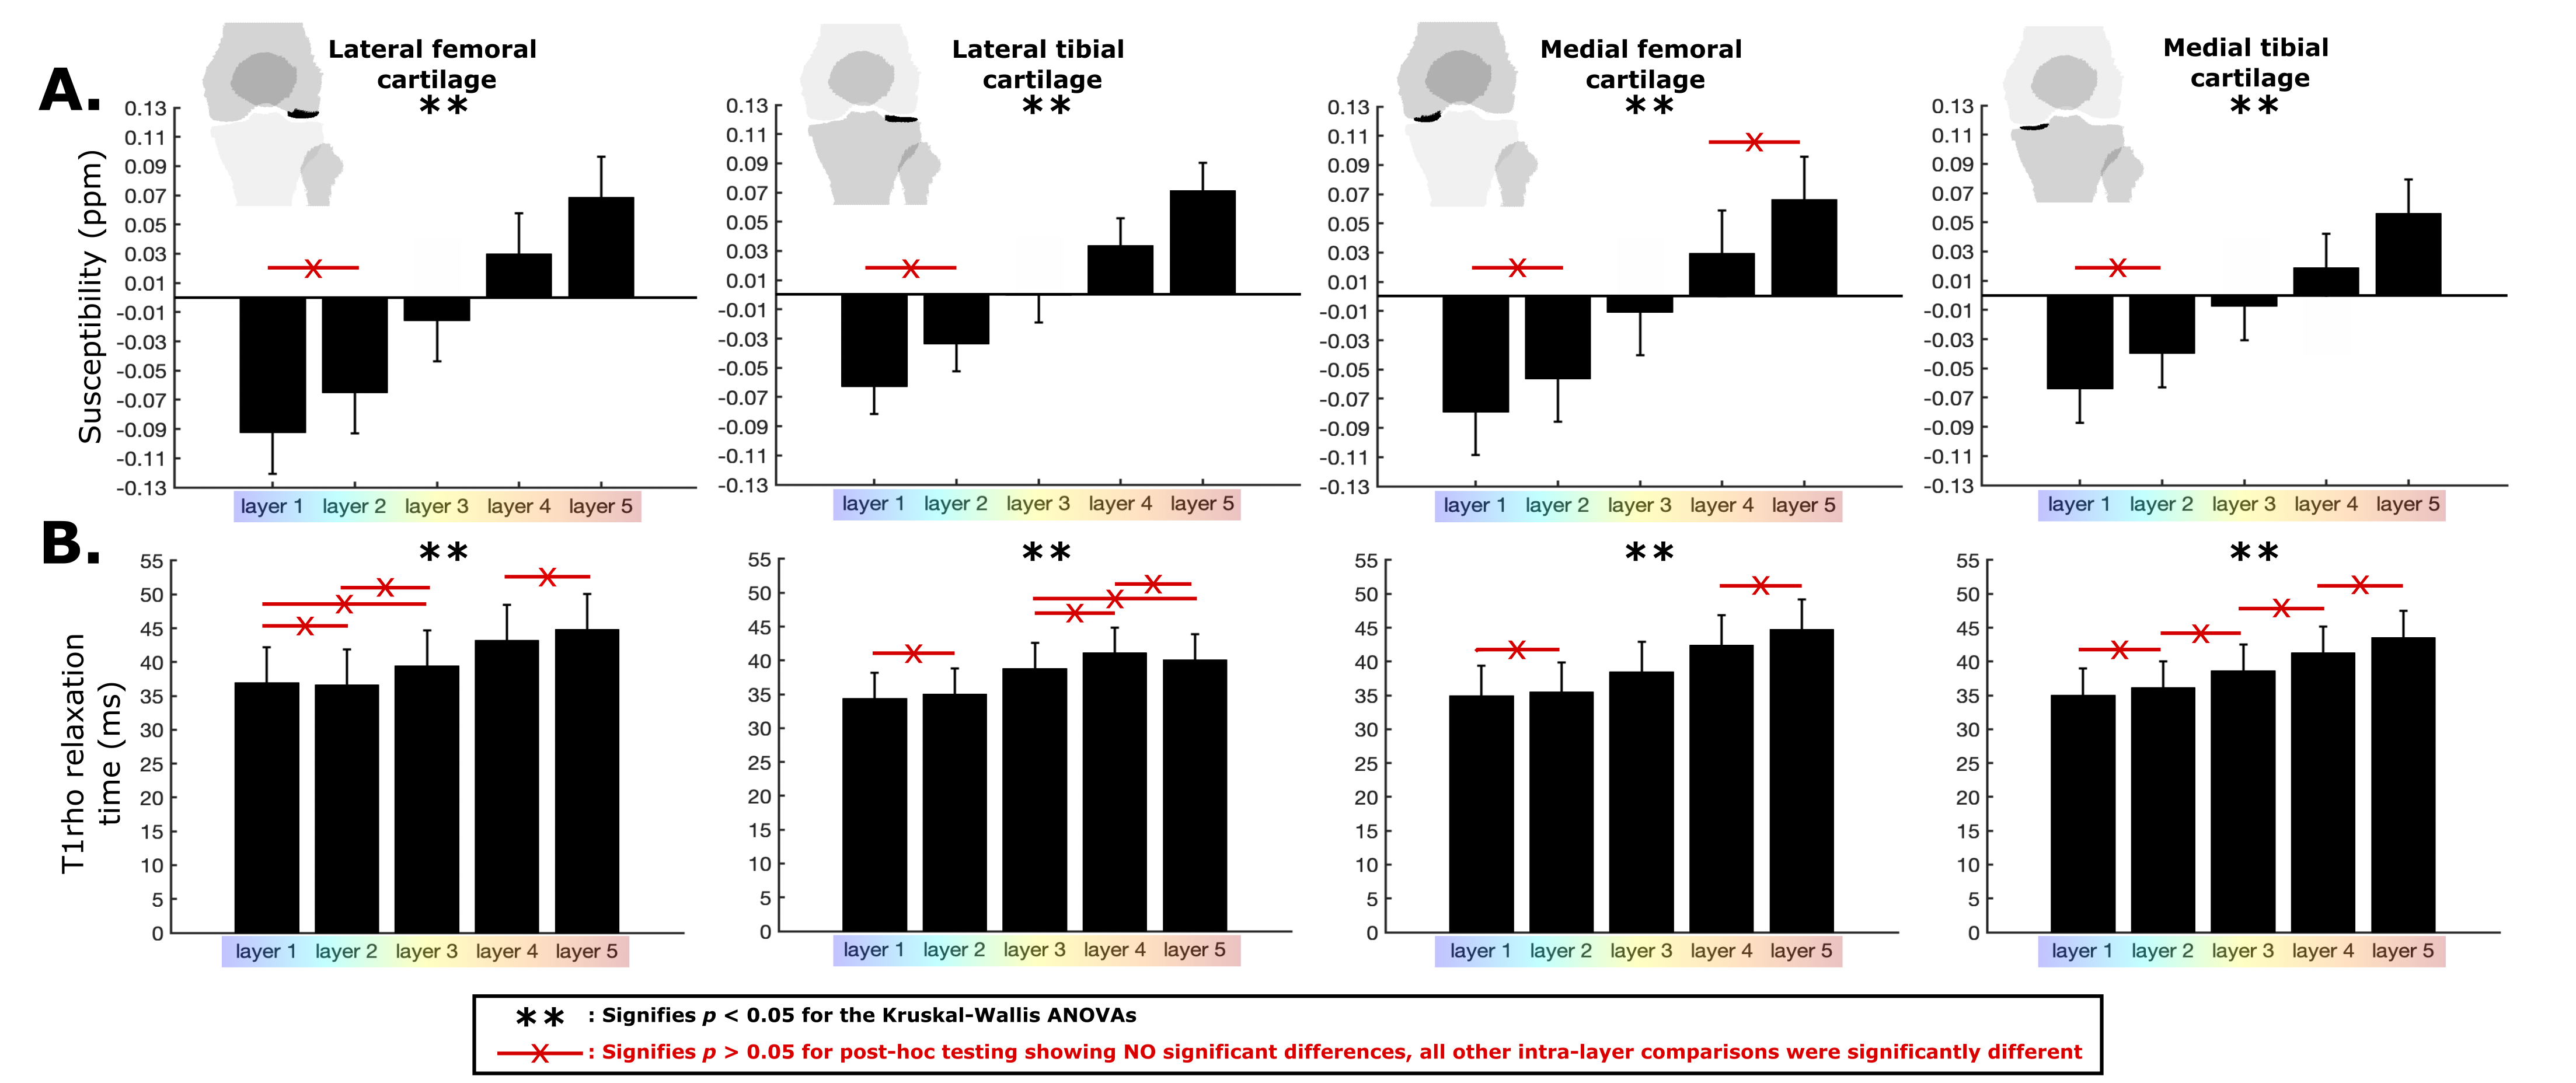
Figure 3. Results from the layer-based analysis of QSM and T1ρ measurements
Quantitative Susceptibility Mapping (A) and T1ρ relaxation times (B) were compared across layers using Kruskal-Wallis ANOVAs (pNormality < 0.05). ** indicates statistical significance at p < 0.05. Post-hoc tests revealed specific differences between layers, which were common. To avoid overcrowding the figure, only within-layer comparisons with p > 0.05 (non-statistically significant) were highlighted using the “x” line (red).