1116
Reliable high-resolution in vivo human knee T1ρ imaging quantification with robust fitting methods
Zhiyuan Zhang1,2,3, Jeehun Kim1,3,4, Richard Lartey1,3, Carl Scherman Winalski1,3,5, and Xiaojuan Li1,3,5
1Program of Advanced Musculoskeletal Imaging (PAMI), Cleveland Clinic, Cleveland, OH, United States, 2Biomedical Engineering, Case Western Reserve University, Cleveland, OH, United States, 3Department of Biomedical Engineering, Lerner Research Institute, Cleveland Clinic, Cleveland, OH, United States, 4Electrical, Computer, and Systems Engineering, Case Western Reserve University, Cleveland, OH, United States, 5Department of Diagnostic Radiology, Imaging Institute, Cleveland Clinic, Cleveland, OH, United States
1Program of Advanced Musculoskeletal Imaging (PAMI), Cleveland Clinic, Cleveland, OH, United States, 2Biomedical Engineering, Case Western Reserve University, Cleveland, OH, United States, 3Department of Biomedical Engineering, Lerner Research Institute, Cleveland Clinic, Cleveland, OH, United States, 4Electrical, Computer, and Systems Engineering, Case Western Reserve University, Cleveland, OH, United States, 5Department of Diagnostic Radiology, Imaging Institute, Cleveland Clinic, Cleveland, OH, United States
Synopsis
Keywords: Cartilage, Quantitative Susceptibility mapping
Quantitative MR T1ρ and T2 imaging are promising methods to detect osteoarthritis at its early stage. Current T1ρ and T2 mapping in human subjects is limited to a relatively low resolution which has limited sensitivity to focal lesions due to partial-volume effects. One of the hurdles to achieving high resolution is the increase in fitting bias when using a conventional nonlinear least-squares fitting with low SNR images. In this study, we evaluated T1ρ quantification with in-vivo high-resolution imaging with different fitting methods.Introduction
Osteoarthritis (OA) is a worldwide healthcare challenge causing the loss of mobility and tremendous pain in its late stage. OA affects multiple tissues in the joint and can cause irreversible loss of tissues such as cartilage while the disease progresses. Researchers have focused on detecting OA at its early stage to allow potential early interventions before irreversible damage to the joint. Quantitative MRI techniques including T1ρ and T2 mapping have been suggested as promising methods to detect OA at the early stage1,2. However, current T1ρ and T2 mapping techniques in human subjects are primarily limited with relatively low spatial resolution, which is prone to partial-volume effects and may limit the sensitivity of probing small focal lesions. There are potential two challenges to implementing high-resolution mapping techniques in human subjects: one is the long acquisition time, which can be addressed by MR acceleration techniques with novel reconstruction methods; the other is the lower signal-to-noise (SNR) ratio, especially in images in later echoes. Our group and others have shown that the conventional nonlinear least-square fitting method can introduce significant bias of T1ρ/T2 estimates with low SNR. This study was focused on addressing the second challenge, aiming to demonstrate the feasibility and potential benefit of high-resolution T1ρ imaging in human knees and to evaluate high-resolution T1ρ quantifications with different fitting methods. The results were compared to T1ρ imaging with standard-resolution.Method
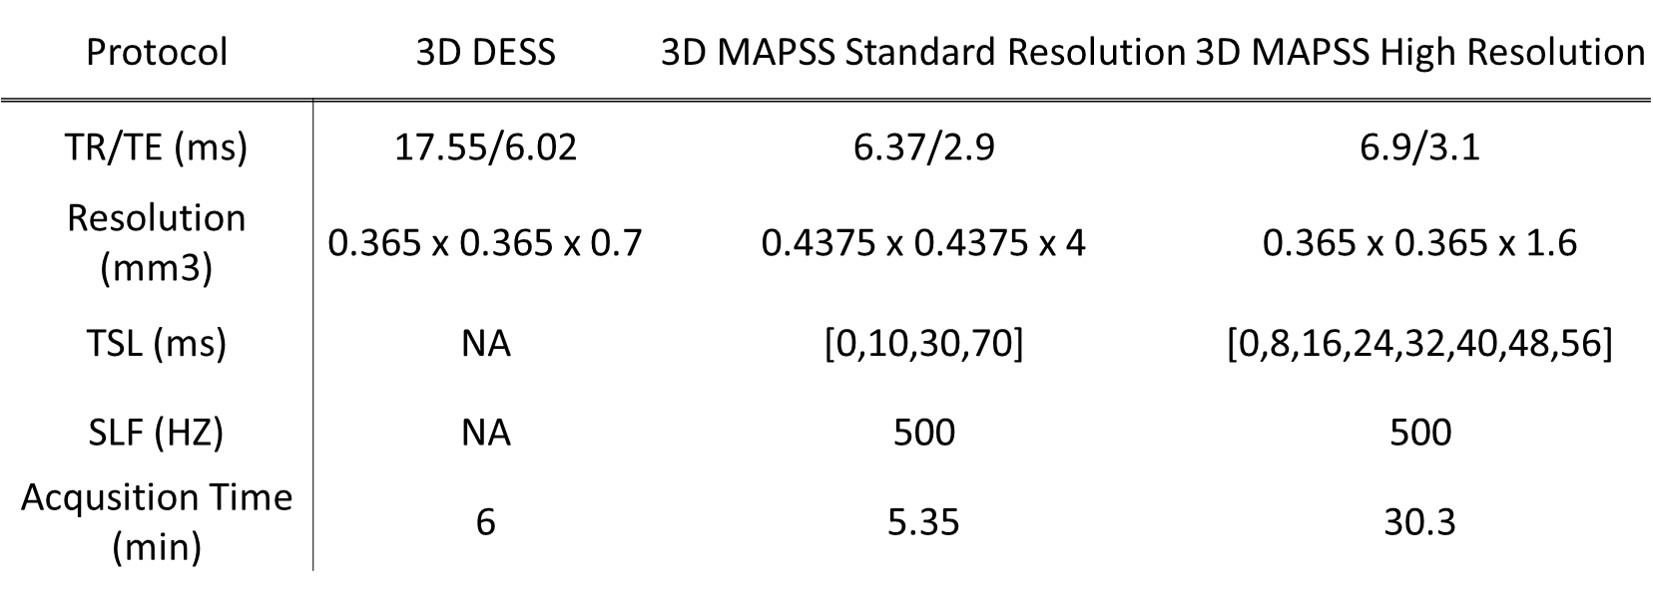
Acquisition parameters:Four volunteers (3 females, age: 32.2±13.7 years) were scanned at a 3T Prisma MRI scanner (Siemens Healthcare AG, Erlangen, Germany) with a knee coil (1Tx/15Rx, QED, Mayfield, OH). The MRI protocol included DESS and MAPSS T1ρ imaging with standard- and high-resolutions (Table 1).
Imaging reconstruction and analysis:
The T1ρ echo images were reconstructed with two methods: 1) sum-of-squares (SOS)3. 2) complex-combined magnitude image (CPX)4.
Four fitting methods were applied afterwards:
(1) Nonlinear least-squares fitting to SOS images (SOS-NLS)
(2) NLS fitting to CPX images (CPX-NLS)
(3) Maximum-likelihood estimation using SOS images (MLE)5,6
(4) Noise-corrected nonlinear least-square using SOS images (NCNLS)5,7,8
The high-resolution DESS images were registered to the first echo T1ρ image and cartilage was automatically segmented in the registered DESS into six compartments using in-house developed deep learning-based methods: medial and lateral femur cartilage (MFC/LFC), medial and lateral tibia cartilage (MT/LT), trochlear, and patella cartilage (TRO/PAT).
SNRs of standard- and high-resolution T1ρ echo images in each defined compartment were measured as the ratio of signal intensity within segmented cartilage over background noise standard deviation. T1ρ estimates were compared between different fitting methods, and between standard- and high-resolution T1ρ imaging using ANOVA, paired t-tests, and coefficients of variation (CVs).
Result
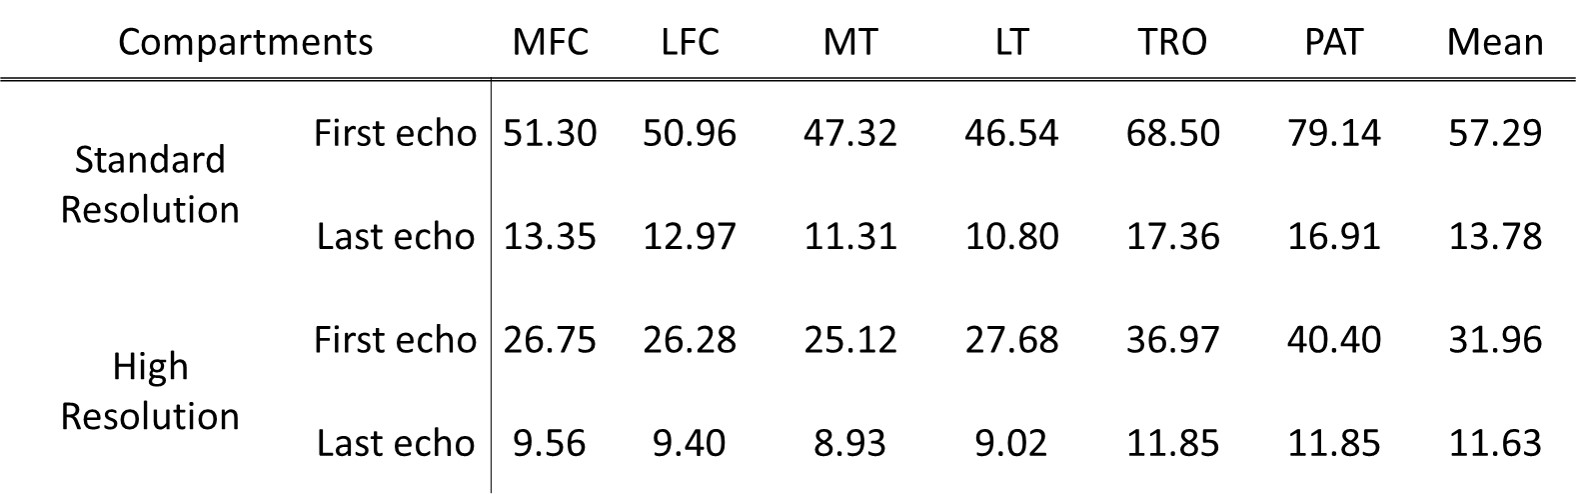
Table 2 shows the SNR of each cartilage compartment for standard- and high-resolution T1ρ echo images. Lower SNRs were observed with high-resolution T1ρ imaging, as expected. Among compartments, PAT and TRO showed the highest SNR.For both standard- and high-resolution T1ρ imaging, SOS-NLS, and CPX-NLS over-estimated T1ρ compared to MLE and NCNLS, Figure 1. For both resolutions, T1ρ values of PAT and TRO showed the smallest differences between fitting methods, Table 3(a).
Between standard- and high-resolution T1ρ imaging, estimated T1ρ values from high-resolution were significantly higher than standard-resolution when using SOS-NLS and CPX-NLS fitting methods. No significant differences between the two resolutions were observed when using MLE and NCNLS methods with CV < 3%, Table 3(b).
Figure 2 shows a case with clear partial-volume effects in standard-resolution T1ρ imaging, which is minimal in high-resolution imaging.
Discussion
Previous work from our group and others suggested that the NLS on SOS images will overestimate T1ρ (or T2) due to noise floors, while MLE and NCNLS methods can provide a reliable estimate even with low SNR. The results from our study are consistent with our previous findings. First, the differences between different fitting methods were smallest in PAT and TRO due to the highest SNR in these compartments. Second, the differences between different fitting methods became larger with high-resolution imaging due to decreased SNR. SOS-NLS showed the largest differences between the two resolutions because this method was the most sensitive to SNR. MLE and NCNLS provided robust estimates even with decreased SNR in high-resolution T1ρ imaging. CPX-NLS also provides bias compared to NCNLS and MLE due to the complexity of measuring accurate coil sensitivity maps. Our preliminary work suggests clear benefits of minimizing partial-volume effects with high-resolution T1ρ imaging, as shown in Figure 2. Further work is warranted to explore this benefit in more subjects including patients with osteoarthritis.Conclusion
The high-resolution T1ρ imaging has the benefits of less partial-volume effects and provides more details that cannot be obtained using current standard-resolution T1ρ imaging. Advanced fitting methods, including maximum-likelihood estimate and noise-corrected nonlinear least-square fitting, shall be used for high-resolution T1ρ imaging due to the lower SNR, which will provide a robust estimate.Acknowledgements
The study was supported by NIH/NIAMS R01 AR077452References
- MacKay JW, Low SBL, Smith TO, Toms AP, McCaskie AW, Gilbert FJ. Systematic review and meta-analysis of the reliability and discriminative validity of cartilage compositional MRI in knee osteoarthritis. Osteoarthritis Cartilage. 2018;26(9):1140-52.
- Atkinson HF, Birmingham TB, Moyer RF, Yacoub D, Kanko LE, Bryant DM, Thiessen JD, Thompson RT. MRI T2 and T1rho relaxation in patients at risk for knee osteoarthritis: a systematic review and meta-analysis. BMC musculoskeletal disorders. 2019;20(1):182. Epub 2019/05/02.
- Roemer PB, Edelstein WA, Hayes CE, Souza Hardy PA, Andersen AH. Calculating T2 in images from a phased array receiver. Magn Reson Med. 2009 Apr;61(4):962-9. SP, Mueller OM. The NMR phased array. Magn Reson Med. 1990;16(2):192-225.
- Pruessmann KP, Weiger M, Scheidegger MB, Boesiger P. SENSE: sensitivity encoding for fast MRI. Magn Reson Med. 1999;42(5):952-962.
- Zhang Z, Kim J, Lartey R, Winalski CS Li, X. Single and Multi-channel evaluations of factors that affect cartilage T1ρ and T2 quantification. ISMRM. Abstract #4946
- Hardy PA, Andersen AH. Calculating T2 in images from a phased array receiver. Magn Reson Med. 2009 Apr;61(4):962-9.
- Raya JG, Dietrich O, Horng A, Weber J, Reiser MF, Glaser C. T2 measurement in articular cartilage: impact of the fitting method on accuracy and precision at low SNR. Magn Reson Med. 2010 Jan;63(1):181-93.
- Dietrich O, Raya JG, Reeder SB, Ingrisch M, Reiser MF, Schoenberg SO. Influence of multichannel combination, parallel imaging and other reconstruction techniques on MRI noise characteristics. Magn Reson Imaging. 2008 Jul;26(6):754-62. Epub 2008 Apr 28. 9. Li X, Han ET, Busse RF, Majumdar S. In vivo T(1rho) mapping in cartilage using 3D magnetization-prepared angle-modulated partitioned k-space spoiled gradient echo snapshots (3D MAPSS). Magnetic resonance in medicine. 2008;59(2):298-307
- Li X, Han ET, Busse RF, Majumdar S. In vivo T(1rho) mapping in cartilage using 3D magnetization-prepared angle-modulated partitioned k-space spoiled gradient echo snapshots (3D MAPSS). Magnetic resonance in medicine. 2008;59(2):298-307
Figures
Table
1: The study scan protocol. The T1ρ images were acquired with 3D
magnetization-prepared angle-modulated partitioned k-space spoiled
gradient-echo snapshots (MAPSS) sequence9. TR: repetition time. TE:
echo time. TSL: time of spinlock. SLF: spinlock frequency. DESS: dual echo
steady state.
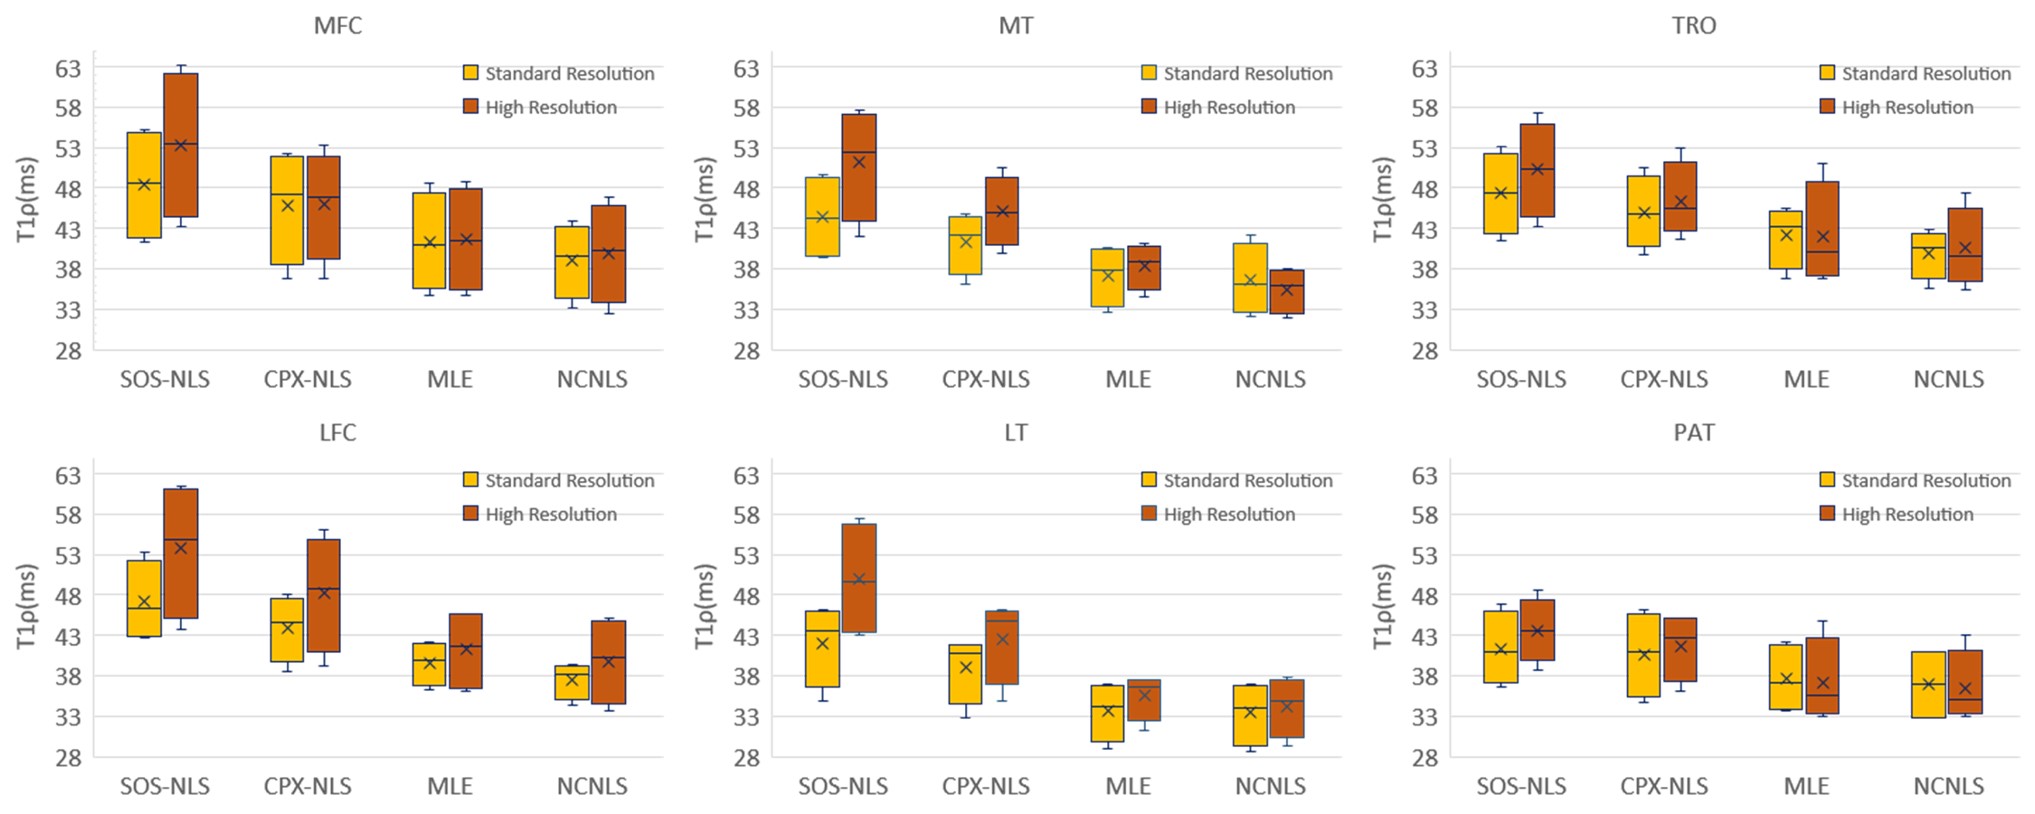
Figure 1: Boxplots for fitted T1ρ values with standard-
and high-resolution imaging, with four fitting methods, respectively. SOS-NLS and CPX-NLS overestimate T1ρ compared to
MLE and NCNLS. The overestimates are larger with high-resolution imaging due to
lower SNR with high-resolution imaging.
Table
2: The SNR of the first echo and last echo of standard- and high-resolution
T1ρ images. SNR
was measured by the mean signal intensity in the segmented area divided by the
standard deviation of the same ROI in the background.
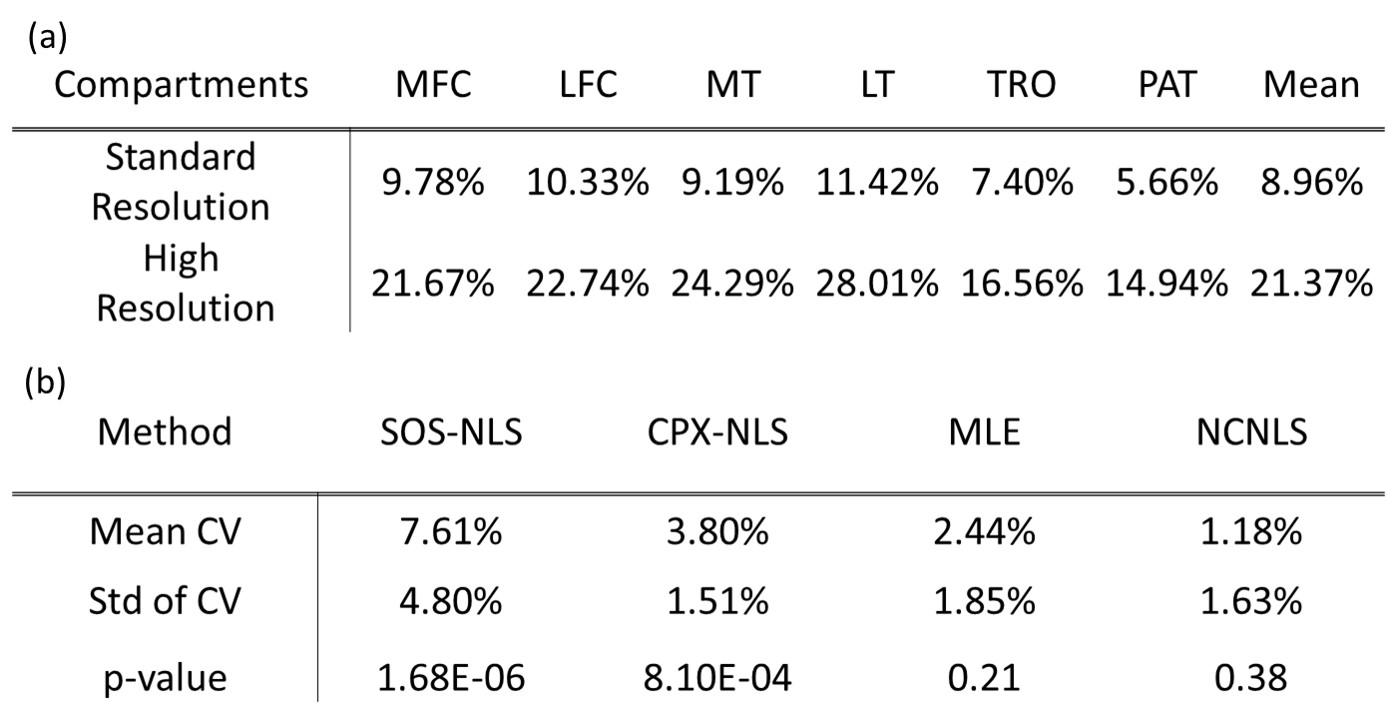
Table
3: (a) CVs between four different fitting methods for both resolutions. (b) CVs
and p-values between standard- and high-resolution for different fitting
methods. The mean CV was calculated among six segmented cartilage compartments.
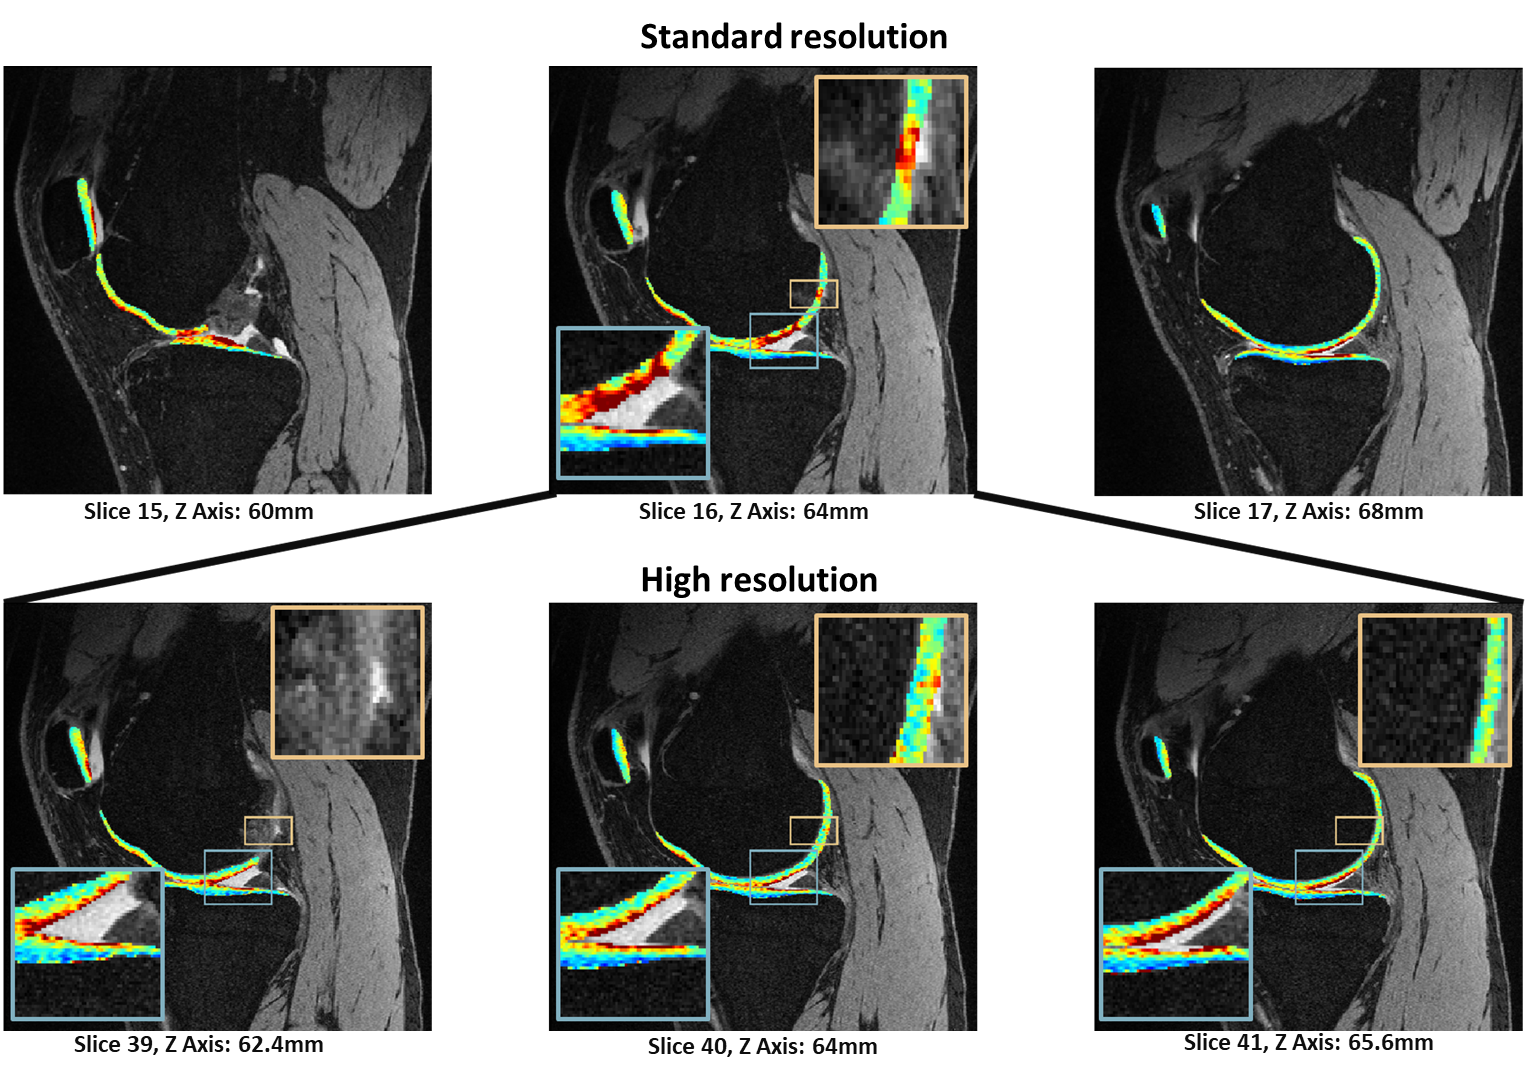
Figure 2: Standard-resolution T1ρ imaging (top row) with partial-volume
effect, which is minimal in the high-resolution T1ρ imaging (bottom row). Fitting maps
using nonlinear least-square were overlaid to the DESS image. One slice in the
standard-resolution image corresponds to approximately three high-resolution
slices. The Slice 16 of standard-resolution maps (top row) shows high T1ρ
values, which was caused by partial -volume averaging from adjacent fluids
(blue box), while the high-resolution T1ρ maps (slice 39, 40, 41, bottom row)
are clean.
DOI: https://doi.org/10.58530/2023/1116