1115
Assessment of knee cartilage strain using the magnetization transfer ratio and T2: an ex vivo study at 9.4T MRI1School of Biomedical Engineering, University of British Columbia, Vancouver, BC, Canada, 2Centre for Hip Health and Mobility, University of British Columbia, Vancouver, BC, Canada, 3UBC MRI Research Centre, University of British Columbia, Vancouver, BC, Canada, 4Orthopaedics, University of British Columbia, Vancouver, BC, Canada
Synopsis
Keywords: Cartilage, Osteoarthritis
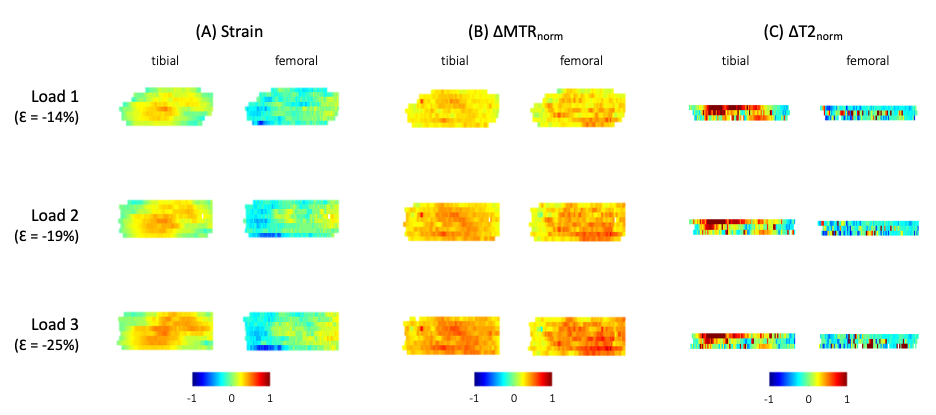
The magnetization transfer ratio (MTR) was investigated as an alternative biomarker for cartilage strain compared to T2. Six ex vivo bovine knee specimens were compressed in a 9.4T scanner and scanned at several physiological step loads. Average strain, MTR, and T2 were calculated for each voxel column throughout the full depth of cartilage, and depth-dependent trends were identified. ΔMTR changed uniformly across the cartilage volume with strain, while ΔT2 showed a more localized yet inconsistent response. This suggests that MTR may be more sensitive in measuring cartilage strain in clinical applications where image resolution is lower.Introduction
Some MRI parameters are sensitive to cartilage strain, which suggests potential to measure the abnormal cartilage mechanics that produce osteoarthritis. Transverse relaxation time (T2) mapping has shown local sensitivity to compressive cartilage strain, but the response is highly depth dependent. T2 mapping also requires high resolution and SNR which are challenging to achieve at clinical field strengths. The magnetization transfer ratio (MTR) is sensitive to the concentration of macromolecules in the cartilage. Previous pilot work has suggested a linear MTR relationship with strain when averaged across the cartilage depth1, and a more time-efficient acquisition that increases its clinical feasibility. The current work assessed the validity of MTR as a biomarker for cartilage strain compared to T2 mapping using ex vivo bovine cartilage at 9.4T. This allowed adequate resolution (62.5 µm) to directly measure strain.Methods
Six previously frozen medial femoral/tibial osteochondral block pairs were submerged in phosphate-buffered saline (PBS) within a uniaxial compressive loading actuator2,3 and scanned in a 9.4T MRI scanner (Bruker Biospec 94/30 USR) using a quadrature volume RF coil (inner diameter = 86mm). MSME was used for T2 mapping (TE = 9.22 ms, TR = 4000 ms, # echoes = 36, NA=3, scan time = 32 minutes, voxel resolution = 62.5x250x1600 µm with highest resolution across the cartilage thickness). The number of acquired slices was kept to three to reduce the signal attenuation in cartilage due to magnetization transfer effects in 2D multi-slice imaging4. Data were denoised5 and processed using NNLS with stimulated echo correction6 to calculate the geometric mean T2 per pixel. For MTR mapping, two image volumes were acquired with the same voxel resolution, one with and one without saturation (S+ and S0 respectively), with a 3D snapshot FLASH sequence that interleaves each saturation period with four linearly encoded FLASH readouts (TE = 5.079 ms, TR between saturations = 65 ms, TR between readouts in same snapshot = 12.05 ms, flip angle = 10°, NA=4, scan time 2 x 2.95 minutes, foffset = 2500 Hz, 10 ms Hanning pulse, B1peak = 42.5 µT, number of slices = 17). Data was denoised7, corrected for Gibbs artifact8, and subsequently used to calculate MTR ($$$MTR = 1 - \ S_+/S_0\ $$$).Specimens were scanned uncompressed, then three times at step loads with target bulk compressive strains of 10%, 20%, and 30%. Scans were acquired 20 minutes after compression to allow for cartilage creep. Tibial and femoral cartilage were manually segmented based on the image volumes. ΔMTR, ΔT2, and strain ($$$\varepsilon=\ \ (t_{compressed}-t_{uncompressed})/t_{uncompressed}\ $$$) were averaged across the cartilage depth of each column of voxels. Repeated measures correlation9, which estimates the association shared among individuals without violating the assumption of independence of observations, was used to assess the relationship between strain and each MRI metric.
Results
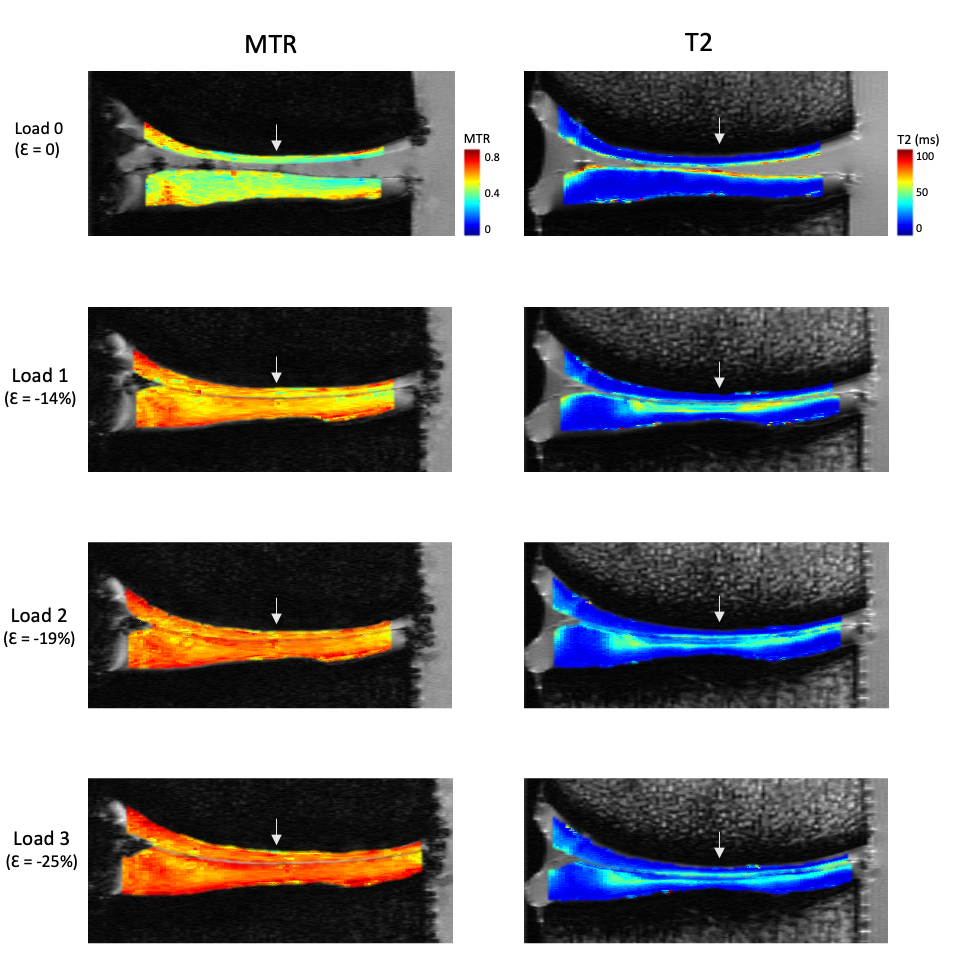
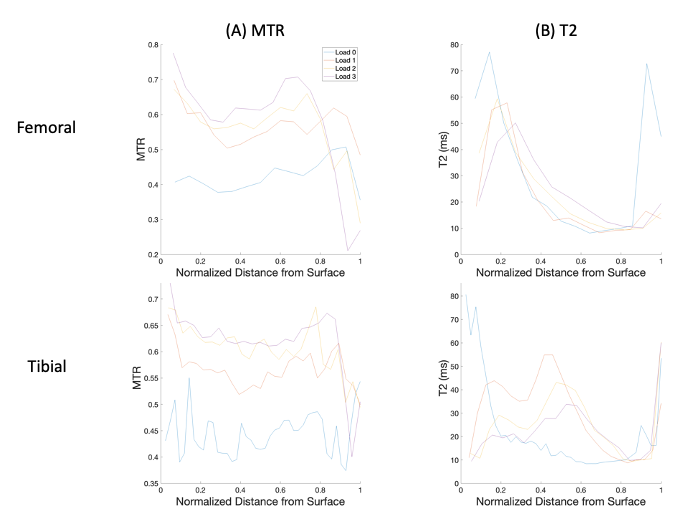
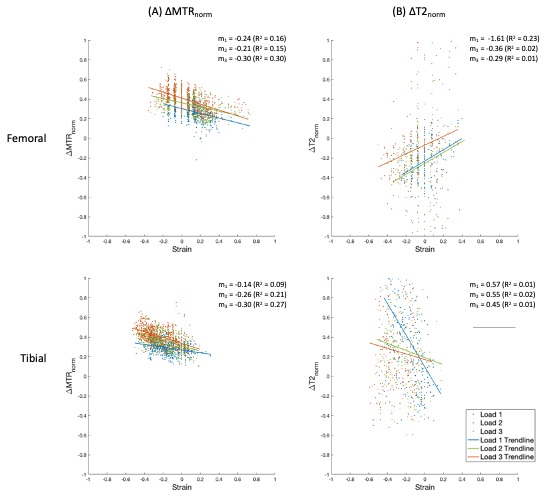
MTR increased uniformly with each step load increase, whereas T2 responded more focally in the tibial cartilage, as shown in Figure 1. No pattern was seen for T2 in the femoral cartilage (Table 1). T2 results were not considered for one specimen due to technical issues. The response to strain was depth dependent in both measurements (Figure 2, Figure 3), with the largest change observed in the superficial zone. Values showed high variability for all step loads, whereas ΔMTR showed a lower dynamic range with less variability (Figure 4). Repeated measures correlation coefficients (rrm) describing the common regression slope were rrm = -0.28 (femoral ΔMTR), -0.36 (tibial ΔMTR), 0.20 (femoral ΔT2), and 0.25 (tibial ΔT2) (p < 0.001 for all measures).Table 1: Bulk strain and mean normalized change in MTR and T2 by load, compared to the uncompressed state. Denoted as mean (standard deviation).
| | Compressive Strain % | ∆MTRnorm % | ∆T2norm % | |||
| Load # | Tibial | Femoral | Tibial | Femoral | Tibial | Femoral |
| 1 | -11.6 (2.5) | -4.9 (4.4) | 27.2 (5.6) | 25.5 (5.6) | 22.9 (18.4) | -9.2 (13.4) |
| 2 | -15.3 (4.4) | -6.0 (6.2) | 34.7 (5.9) | 33.3 (4.7) | 30.9 (31.3) | -6.0 (17.2) |
| 3 | -19.2 (3.1) | -10.4 (5.3) | 38.6 (6.5) | 36.9 (4.2) | 32.9 (27.5) | 4.9 (21.8) |
Discussion
Our finding of a more uniform response in ΔMTR with strain compared to ΔT2 suggests stronger potential for ΔMTR as a clinical measurement of overall strain at a lower image resolution. The differing response between metrics is not surprising, given that ΔT2 likely reflects changes in collagen orientation whereas ΔMTR likely reflects changes in cartilage water content. ΔT2 was highly variable across specimens, making it a less reliable measurement of strain. The repeatability of T2 could be impacted by the reduced number of data points due to fewer slices (three) and the complex dependence on collagen orientation. Variability of ΔMTR and ΔT2 may also be caused by errors in manual segmentation or partial volume effects with the surrounding PBS.Conclusion
MTR may be a more consistent surrogate measure of strain compared to T2. The simpler change in MTR across the the cartilage surface may be easier to measure at lower resolutions, and the simplicity and short length of the MTR protocol could make it a more suitable alternative for strain assessment in a clinical setting. Further work should explore MTR response to strain in in vivo, and consider the effects of cartilage creep, as this could impact MTR measurements.Acknowledgements
This research is funded by the Arthritis Society (Grant # 21-0000000129), a NSERC Discovery Grant (RGPIN-2019-06347), and Michael Smith Health Research BC.References
1. Yung, A., Prevost, V., Desrochers, J., Sullivan, E., Wilson, D., & Kozlowski, P. (2020). Magnetization Transfer Techniques (MTR and ihMTRex) for Detecting Cartilage Strain in Loaded ex vivo Joints at 7 Tesla. In: International Society for Magnetic Resonance Imaging in Medicine Meeting, 2750.
2. Küpper, J.C.*, Sullivan, E., Coope, R., Wilson, D., (2022) Design of a Pneumatic Cartilage Loading Rig for Magnetic Resonance Imaging, University of British Columbia Orthopaedic Research Day, Vancouver, Canada, May 4 (Podium Presentation)
3. Küpper, J.C., Sullivan, E.*, Coope, R., Wilson, D., (2022) Design and Validation of a Cartilage Compression Actuator for Magnetic Resonance Imaging, University of British Columbia School of Biomedical Engineering Research Symposium, Vancouver, Canada, June 7-8 (Poster Presentation)
4. Radunsky, D., Blumenfeld-Katzir, T., Volovyk, O., Tal, A., Barazany, D., Tsarfaty, G., & Ben-Eliezer, N. (2019). Analysis of magnetization transfer (MT) influence on quantitative mapping of T2 relaxation time. Magnetic Resonance in Medicine, 82(1), 145. https://doi.org/10.1002/MRM.27704
5. Does, M. D., Olesen, J. L., Harkins, K. D., Serradas-Duarte, T., Gochberg, D. F., Jespersen, S. N., & Shemesh, N. (2019). Evaluation of principal component analysis image denoising on multi-exponential MRI relaxometry. Magnetic Resonance in Medicine, 81(6), 3503–3514. https://doi.org/10.1002/MRM.27658
6. Prasloski, T., Mädler, B., Xiang, Q. S., MacKay, A., & Jones, C. (2012). Applications of stimulated echo correction to multicomponent T2 analysis. Magnetic Resonance in Medicine, 67(6), 1803–1814. https://doi.org/10.1002/MRM.23157
7. Coupe, P., Yger, P., Prima, S., Hellier, P., Kervrann, C., & Barillot, C. (2008). An optimized blockwise nonlocal means denoising filter for 3-D magnetic resonance images. IEEE Transactions on Medical Imaging, 27(4), 425–441. https://doi.org/10.1109/TMI.2007.906087
8. Kellner, E., Dhital, B., Kiselev, V. G., & Reisert, M. (2016). Gibbs-ringing artifact removal based on local subvoxel-shifts. Magnetic Resonance in Medicine, 76(5), 1574–1581. https://doi.org/10.1002/MRM.26054
9. Bakdash, J. Z., & Marusich, L. R. (2017). Repeated Measures Correlation. Frontiers in Psychology, 8. https://doi.org/10.3389/fpsyg.2017.00456
Figures