1114
Characterization of the Textural Features from Quantitative MRI for Determination of Cartilage Degeneration
Vladimir Juras1, Stefan Toegel2,3, Benedikt Hager4,5,6, Markus Schreiner7, Veronika Janacova1, Pavol Szomolanyi4, Didier Laurent8, Franziska Saxer9, Rahel Heule10, Oliver Bieri11, Esther Raithel12, Christoph Fuchssteiner13, Wolfgang Weninger13, Reinhard Windhager2, and Siegfried Trattnig4
1Medical University of Vienna, Vienna, Austria, 2Karl Chiari Lab for Orthopaedic Biology, Department of Orthopedics and Trauma Surgery, Medical University of Vienna, Vienna, Austria, 3Ludwig Boltzmann Institute for Arthritis and Rehabilitation, Vienna, Austria, 4High Field MR Centre, Department of Biomedical Imaging and Image-guided Therapy, Medical University of Vienna, Vienna, Austria, 5Austrian Cluster for Tissue Regeneration, Ludwig Boltzmann Institute for Experimental and Clinical Traumatology, Viennq, Austria, 6CD Laboratory for MR Imaging Biomarkers (BIOMAK), Vienna, Austria, 7Department of Orthopedics and Trauma Surgery, Medical University of Vienna, Vienna, Austria, 8Department of Translational Medicine, Novartis Institutes for Biomedical Research, Basel, Switzerland, 9Department of translational Medicine, Novartis Institutes for Biomedical Research, Basel, Switzerland, 10Center for MR Research, University Children's Hospital, Zurich, Switzerland, 11Division of Radiological Physics, Department of Radiology, University of Basel Hospital, Basel, Switzerland, 12Siemens Healthcare GmbH, Erlangen, Germany, 13Center for Anatomy and Cell Biology, Division of Anatomy, Medical University of Vienna, Vienna, Austria
1Medical University of Vienna, Vienna, Austria, 2Karl Chiari Lab for Orthopaedic Biology, Department of Orthopedics and Trauma Surgery, Medical University of Vienna, Vienna, Austria, 3Ludwig Boltzmann Institute for Arthritis and Rehabilitation, Vienna, Austria, 4High Field MR Centre, Department of Biomedical Imaging and Image-guided Therapy, Medical University of Vienna, Vienna, Austria, 5Austrian Cluster for Tissue Regeneration, Ludwig Boltzmann Institute for Experimental and Clinical Traumatology, Viennq, Austria, 6CD Laboratory for MR Imaging Biomarkers (BIOMAK), Vienna, Austria, 7Department of Orthopedics and Trauma Surgery, Medical University of Vienna, Vienna, Austria, 8Department of Translational Medicine, Novartis Institutes for Biomedical Research, Basel, Switzerland, 9Department of translational Medicine, Novartis Institutes for Biomedical Research, Basel, Switzerland, 10Center for MR Research, University Children's Hospital, Zurich, Switzerland, 11Division of Radiological Physics, Department of Radiology, University of Basel Hospital, Basel, Switzerland, 12Siemens Healthcare GmbH, Erlangen, Germany, 13Center for Anatomy and Cell Biology, Division of Anatomy, Medical University of Vienna, Vienna, Austria
Synopsis
Keywords: Cartilage, Osteoarthritis, cartilage; texture analysis, histology
Texture features derived from quantitative MRI maps of cartilage have attracted increasing attention from the osteoarthritis (OA) community in recent years. In this work, texture analysis was used on T2 maps and validated using histological analysis. Some texture features (autocorrelation, contrast and entropy) correlated with the Mankin score; autocorrelation also correlated with collagen orientation calculated from PLM images. The correlation between image-derived features with histological quality scores can be a decisive step towards monitoring of cartilage regeneration in-vivo and help to identify therapies that restore articular cartilage quantity and quality.Introduction
Assessing the quality of cartilage regenerates in vivo is a challenge in research and clinical practice. Texture features derived from quantitative MRI maps of cartilage have attracted increasing attention from the osteoarthritis (OA) community in recent years, particularly as texture features can be quantitatively evaluated on a pixel-by-pixel basis and easily post-processed. Especially with regard to new treatments for cartilage regeneration, such measurements could allow a better prediction of the durability of the repair. The aim of this work was to validate texture features extracted from quantitative MRI maps as potential markers of cartilage quality via comparison with histology.Materials and Methods
Ten knees of ten body donors were collected in accordance with the terms of the ethics committee of the Medical University of Vienna (EK-No.: 1081/2021), and scanned in a 7T Magnetom MRI scanner and a 3T MRI Prisma Fit scanner (both Siemens Healthineers, Erlangen, Germany). The imaging protocol comprised a high-resolution 3D sequences (DESS, TE=2.53ms, TR=8.68ms, 224 slices, 0.5x0.5x0.5mm, FA=18°, TA=3:56min), T2 mapping sequences (conventional multi-echo spin-echo sequence (CPMG, TE=11.1 to 88.8ms, TR=2750ms, 24 slices, 0.5x0.5x2.5mm, FA=180°, TA=7:50min) at 3T and triple echo steady state (TESS, TE=4.43ms, TR=8.74ms, 32 slices, 0.5x0.5x3.0mm, FA=15°, TA=3:17min) at both 3T and 7T). 3D DESS images were used for automatic cartilage segmentation, with 9 femoral regions segmented using the MRChondralHealth V2.1 research application software (Siemens Healthcare GmbH, Erlangen, Germany). Subsequently, cartilage plugs were taken from the nine regions. After the removal of the plugs, another MR measurement was performed. This allowed to manually add the plug removal locations to the automatic segmentation for further image analysis (Figure 1). Histological analysis included Safranin-O staining for grading of cartilage degeneration using the Mankin score and Picrosirius Red staining for polarized microscopy (PLM) analysis of collagen fibers (orientation and parallelism map) [3]. T2 maps were registered on 3D DESS images. Thereafter, the mean T2 values and twenty texture features from the grey-level co-occurrence matrix (GLCM) were extracted from each slice corresponding to individual plugs (Figure 2). Spearman correlation coefficients were used to express the relationship between T2, individual texture features and quantitative variables extracted from histological analysis.Results
The Mankin scores of the extracted cartilage plugs ranged from 2 to 12 resulting in a mean value of 5.2 ± 1.8. Examples for the histological analyses of three different cartilage degeneration stages are given in Figure 3. High correlation was found between Mankin score and autocorrelation, contrast and entropy. The same trends were observed on conventional 3T-CPMG maps, although the correlation was lower. In PLM imaging, collagen fiber parallelism showed no correlation with texture features, but orientation correlated with autocorrelation – the highest correlation was found in 3T-CPMG T2 maps (0.643) – see Table 1.Discussion and Conclusion
This is the first study investigating the relationship between cartilage texture features extracted from T2 maps with histological analyses. Automated segmentation provided a reproducible way to segment the whole (femoral) cartilage and allowed co-localization with the plugs corresponding to the histologically targeted tissue. The main findings of this study are: a) some texture features (autocorrelation, contrast and entropy) extracted from T2 maps correlate to the histologically assessed stage of cartilage degeneration, b) cartilage texture features are independent from field strength and acquisition method. Radiomic analysis of the PLM sections is now planned to further characterize the texture features identified from MRI. In conclusion, texture features extracted from quantitative MRI images of articular cartilage provide additional information on collagen content and orientation that can be attributed to the degeneration status of the tissue. Texture analysis could therefore be prospectively used for monitoring OA patients under conservative or surgical treatment. The correlation between image-derived features with histological quality scores can be a decisive step towards monitoring of cartilage regeneration in-vivo and help to identify therapies that restore articular cartilage quantity and quality.Acknowledgements
This work was supported by the Novartis Institutes for Biomedical Research, Austrian Science Fund FWF KLI917 and grant No. APVV-21–0299 of the Slovak Research and Development Agency.References
[1] Blumenkrantz B.S. et al, The feasibility of characterizing the spatial distribution of cartilage T2 using texture analysis, Osteoarthritis and Cartilage, 16(5), 584-590, 2008
[2] Janacova V. et. al., Adjacent cartilage tissue structure after successful transplantation: a quantitative MRI study using T2 mapping and texture analysis, European Radiology, In Press, 2022
[3] Rieppo J. at al., Practical Considerations in the Use of Polarized Light, Microscopy in the Analysis of the Collagen Network in Articular Cartilage, MICROSCOPY RESEARCH AND TECHNIQUE 71:279–287, 2008
Figures
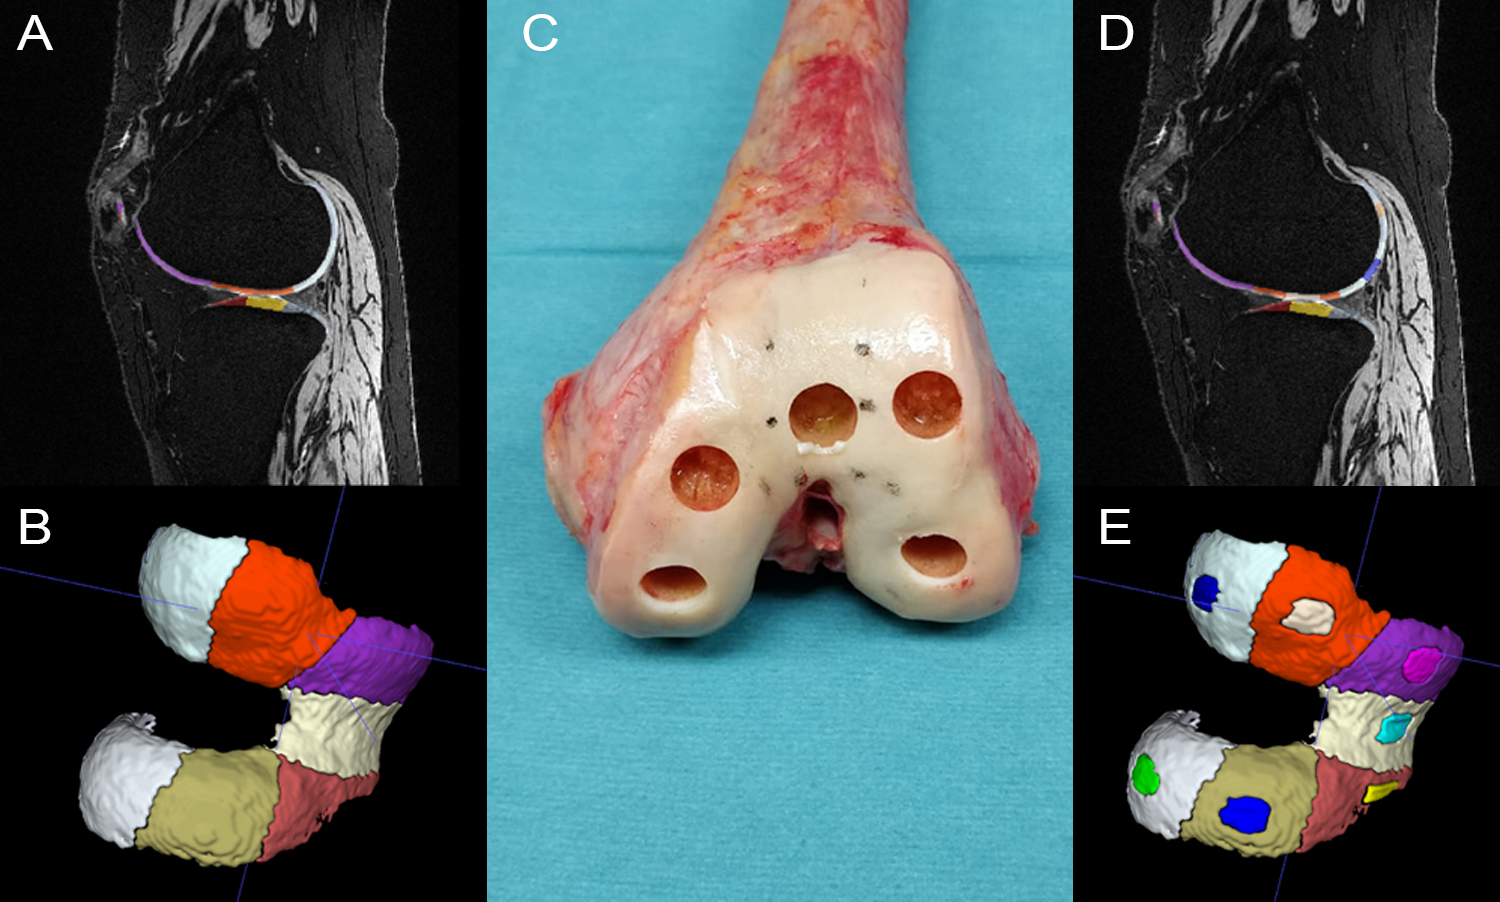
Figure
1. A and B: results of an automated cartilage segmentation using the MRChondralHealth research application, C: a
representative example of cartilage extraction for histological analysis, D and
E: automated segmentation augmented by manual selection of plugs corresponding
to the actually extracted plugs.
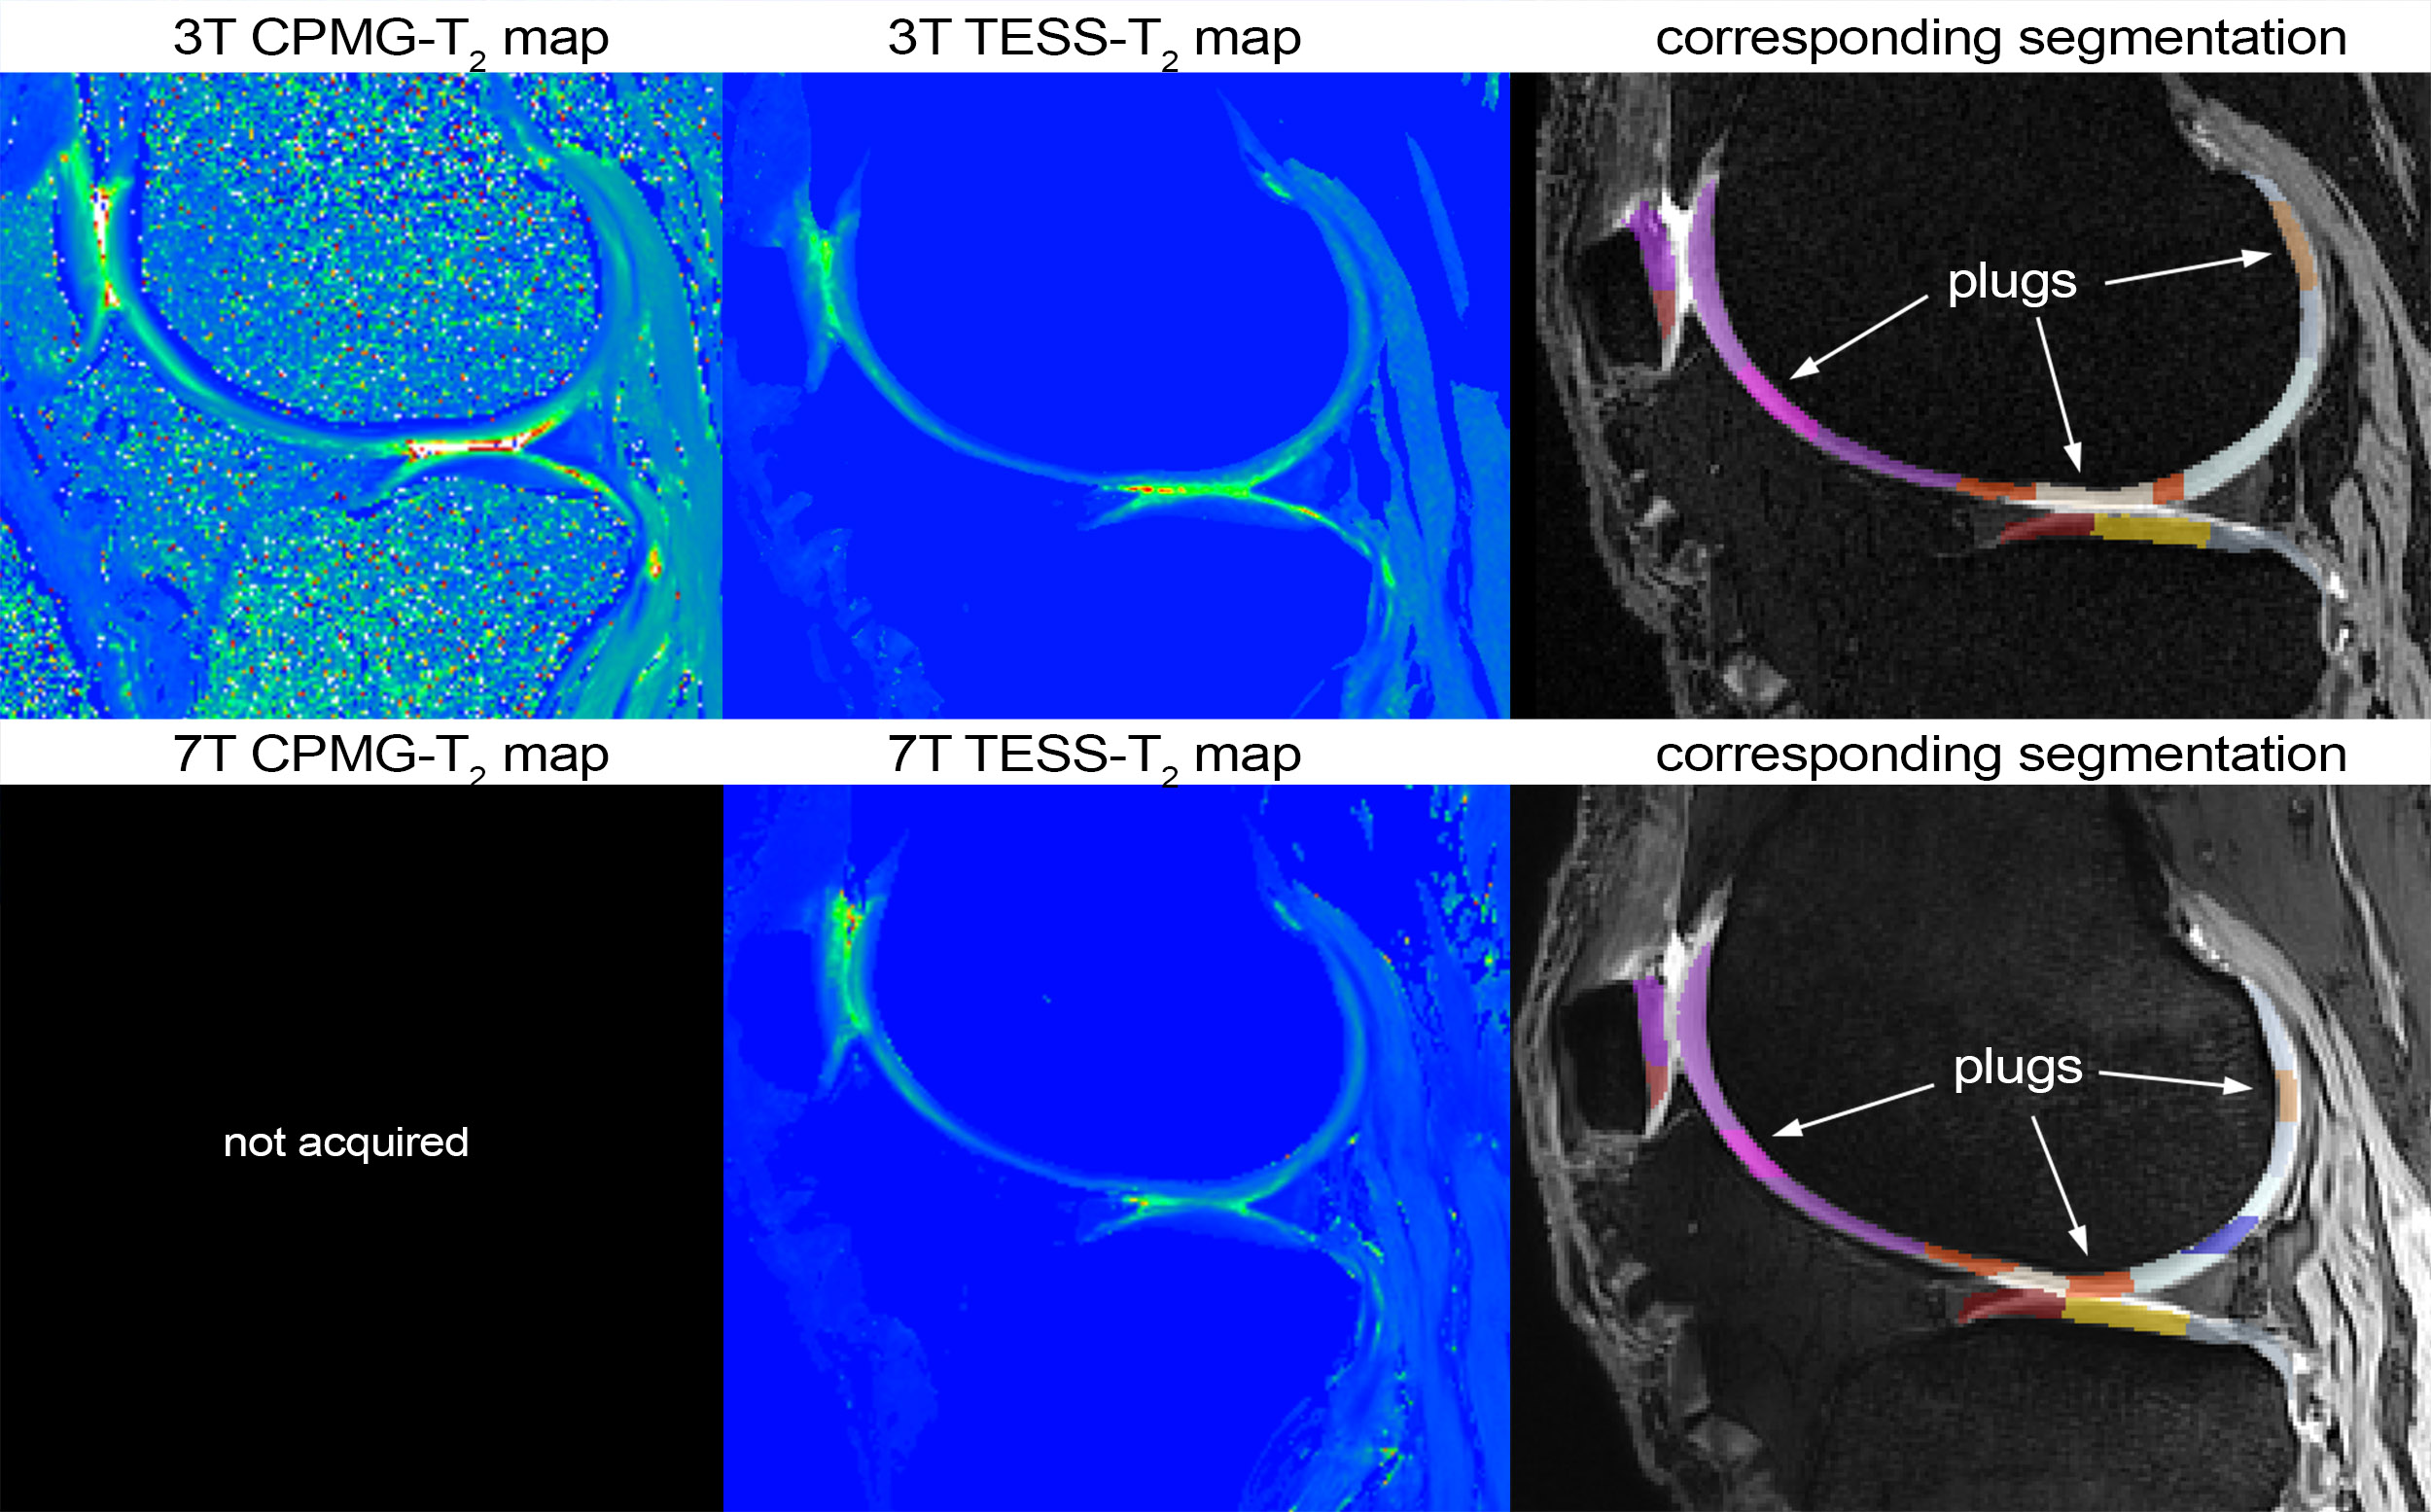
Figure
2. CPMG-T2 map and TESS-T2 map acquired at both field strengths with the
corresponding 3D-DESS images overlaid with an automated segmentation and
manually selected plugs.
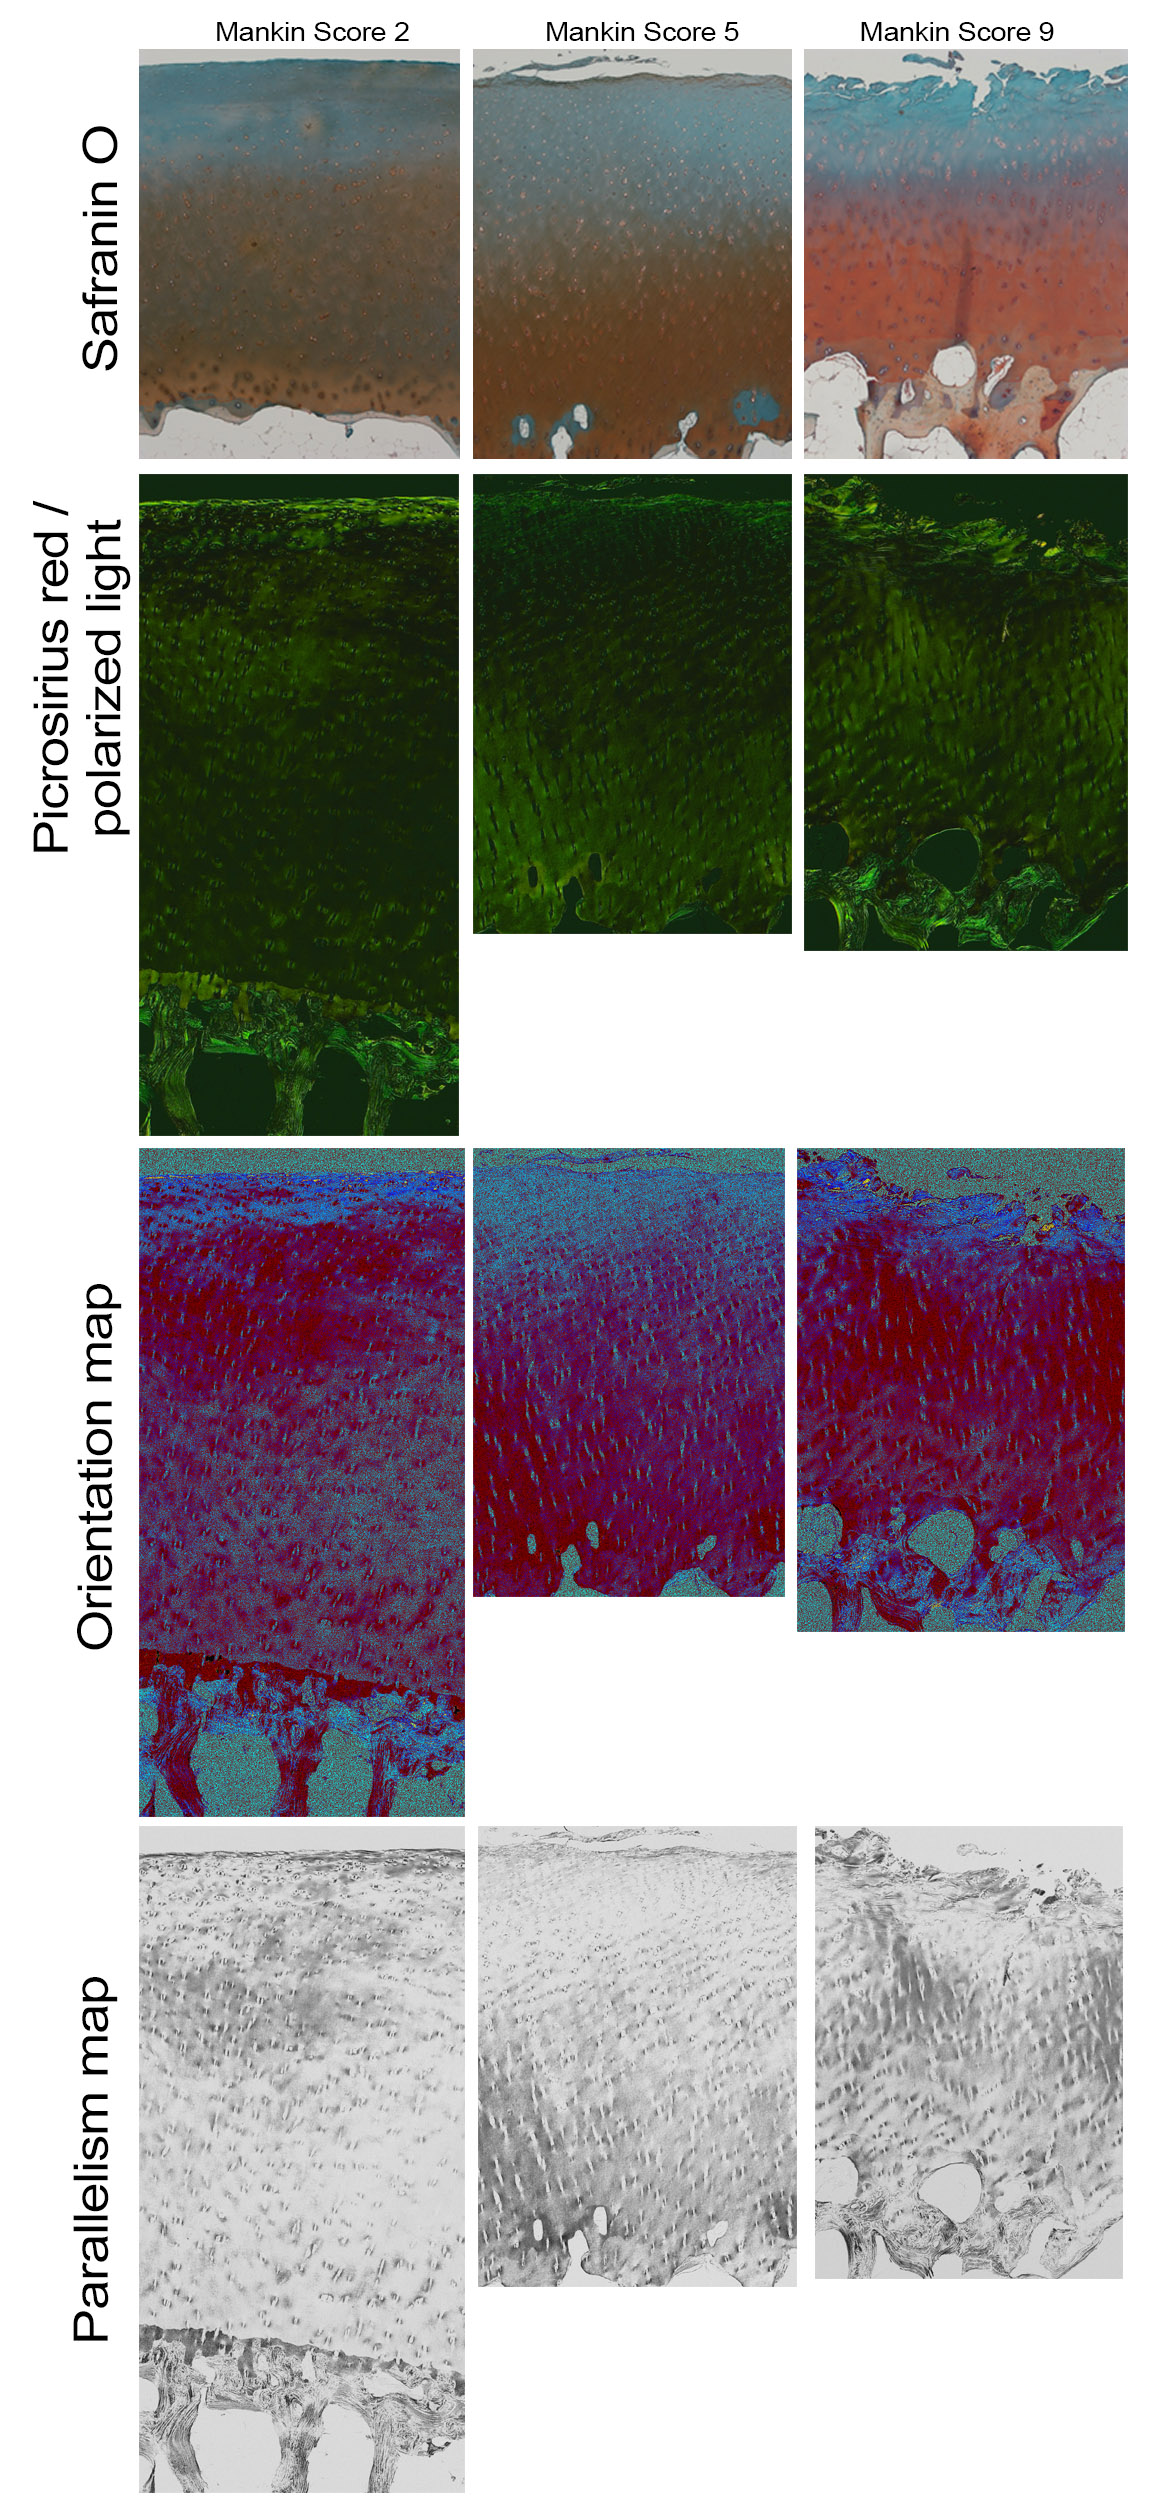
Figure 3. The example of different cartilage degeneration stages and their translation
to the histological analysis
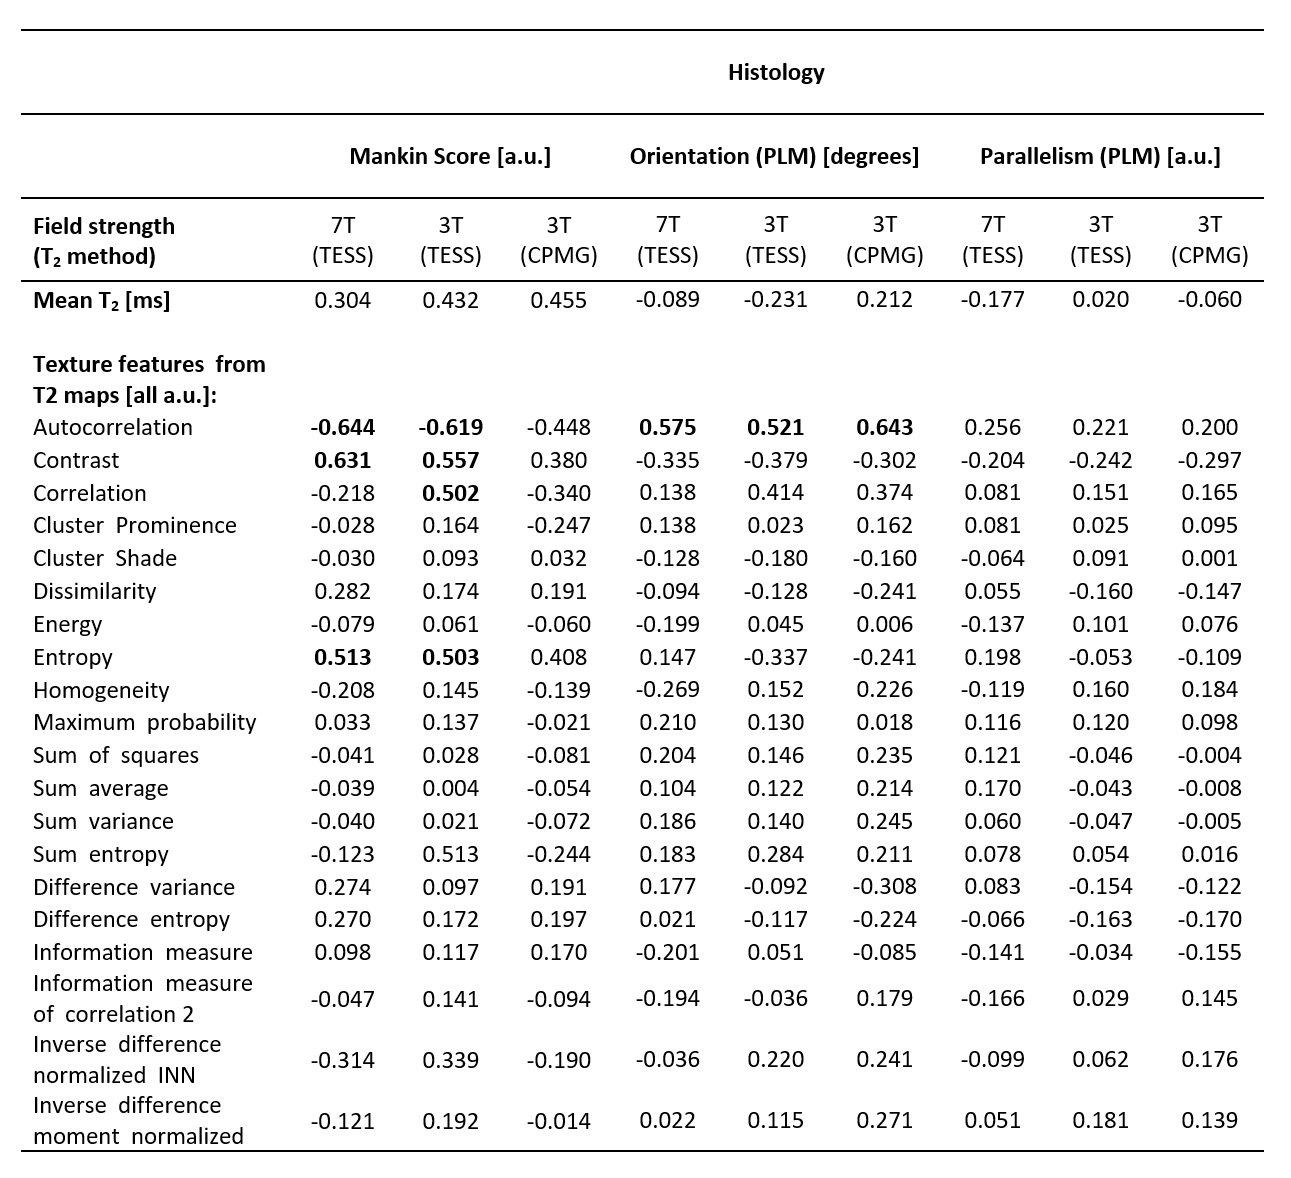
Table 1. The Spearman correlation coefficients between texture features and histological
measures.
DOI: https://doi.org/10.58530/2023/1114