1113
Patellofemoral cartilage compression and recovery in response to loading measured with dynamic MRI using prospective motion correction1Division of Medical Physics, Department of Diagnostic and Interventional Radiology, Medical Center - University of Freiburg, Freiburg, Germany, 2Fraunhofer Institute for Digital Medicine MEVIS, Bremen, Germany, 3Medical Image Computing Group, Department of Informatics, University of Bremen, Bremen, Germany, 4Department of Orthopedic and Trauma Surgery, Medical Center – University of Freiburg, Freiburg, Germany
Synopsis
Keywords: Cartilage, Motion Correction, dynamic MRI, loading, compression, recovery
The patellofemoral cartilage compression and recovery is measured with dynamic MRI in response to a bout of in situ loading in a cohort of ten healthy subjects. To mitigate motion artifacts arising from the loading paradigm, the experiments are performed with prospective motion correction based on optical tracking. The measured cartilage compression and recovery time course in response to loading and unloading is characterized by a larger fully elastic compression component adapting instantaneously to applied load changes, and a smaller compression component, which only gradually adapts to load changes and exhibits in particular a very protracted recovery after unloading.Introduction
In vivo investigation of cartilage response to mechanical loading has been the subject of recent MRI research. Cartilage thickness changes have been assessed with pre- and post-exercise MRI involving various activities and loading paradigms1–3. Furthermore, MRI has also been performed with in situ loading to investigate the load-induced cartilage compression4–6. However, to date only the steady- state cartilage compression has been measured, but there is no MRI data about the dynamics after load onset and release, which may provide deeper insight into the biomechanical cartilage properties. In this work, the patellofemoral cartilage compression and recovery is measured with dynamic MRI in response to a bout of in situ loading. To mitigate motion artifacts arising from the loading paradigm, the experiments are performed with prospective motion correction (PMC)7,8.Methods
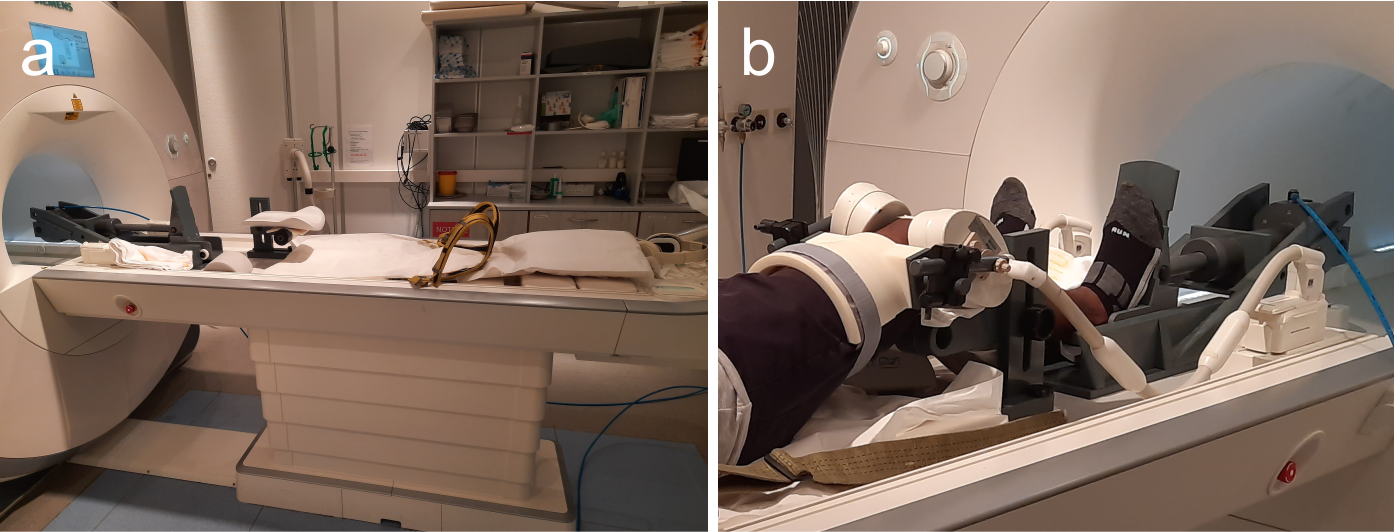
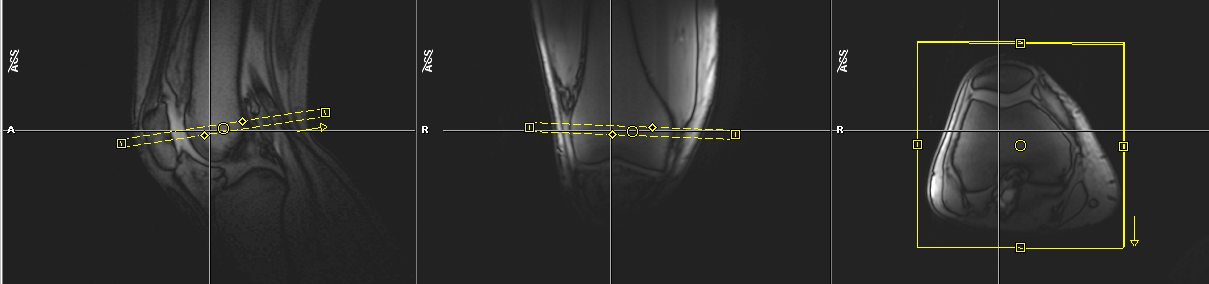
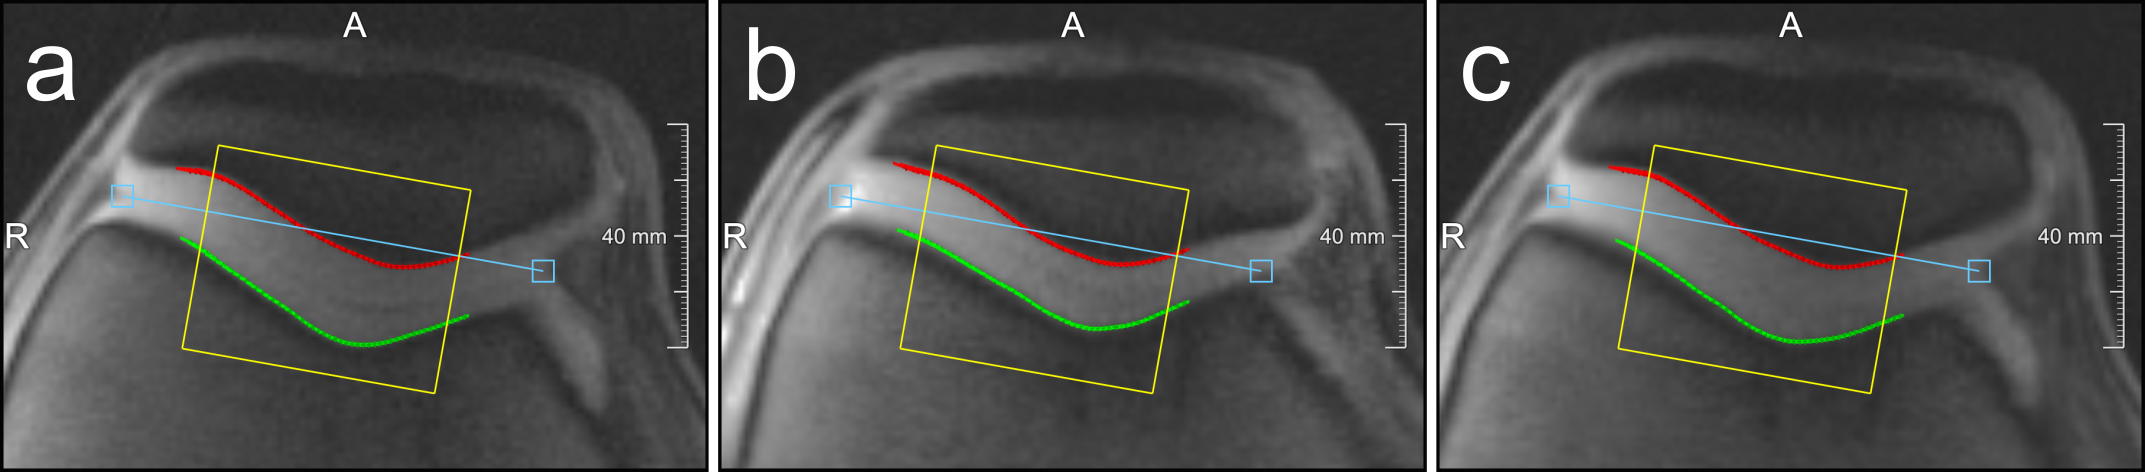
MRI experiments were performed on a Magnetom Prisma 3T system (Siemens Healthineers, Germany), using an 8-channel multipurpose coil (NORAS MRI products, Germany) for signal reception. Knee loading was realized with a flexion angle of approximately 40° using an MR-compatible pneumatic loading device and the subject was attached to the scanner bed with a chest harness (Fig. 1). The measurement paradigm consisted of 2 min of (unloaded) baseline, 5 min of loading (with 50 % body weight) and about 38 min of unloading. The dynamic MRI scans were performed using a PMC-augmented T1-weighted RF-spoiled 2D gradient-echo sequence with a transverse slice (thickness: 5.5 mm) covering a FOV of 140 mm and a spatial in-plane resolution of 0.55 mm. The slice was positioned approximately perpendicular to the patellofemoral cartilage interface, covering the center of the cartilage contact area (Fig. 2). Further sequence parameters were: TR = 7.1 ms, TE = 4.0 ms, excitation angle = 6°, readout bandwidth = 500 Hz/Px. The 2D k-space was sampled with a golden angle radial scheme providing a near-optimal k-space coverage for any number of subsequent projections. Prospective motion correction was realized with a moiré phase tracking system (Metria Innovation Inc., Milwaukee, US) consisting of a single in-bore camera and a single tracking marker9. A position update of the MRI measurement volume was performed in real time during the scan (before every excitation pulse). The images for quantitative cartilage evaluation were generated offline with a conjugate gradient non-cartesian SENSE reconstruction using a custom-made Matlab pipeline10. Each image was reconstructed from 400 radial projections acquired over a period of 2.8 s. For the whole dynamic measurement of 45:26 min, 998 images were reconstructed with a temporal resolution of 2.7 s, which amounts to a marginal sliding window overlap. Residual in-plane motion was corrected via patella registration with respect to the first time frame of the experiment. The region of interest (ROI) for the cartilage thickness evaluation was determined via a manually drawn line between the two outmost contact points of the patellar and femoral cartilages, discarding the outer 20 % on each side. The mean distance between patellar and femoral bone-cartilage interfaces within this ROI was then measured perpendicular to this line (Fig. 3). The dynamic MRI method was validated in a cohort of ten healthy male subjects. Reproducibility was assessed via four repeated measurements (several weeks apart) on one of the subjects.Results
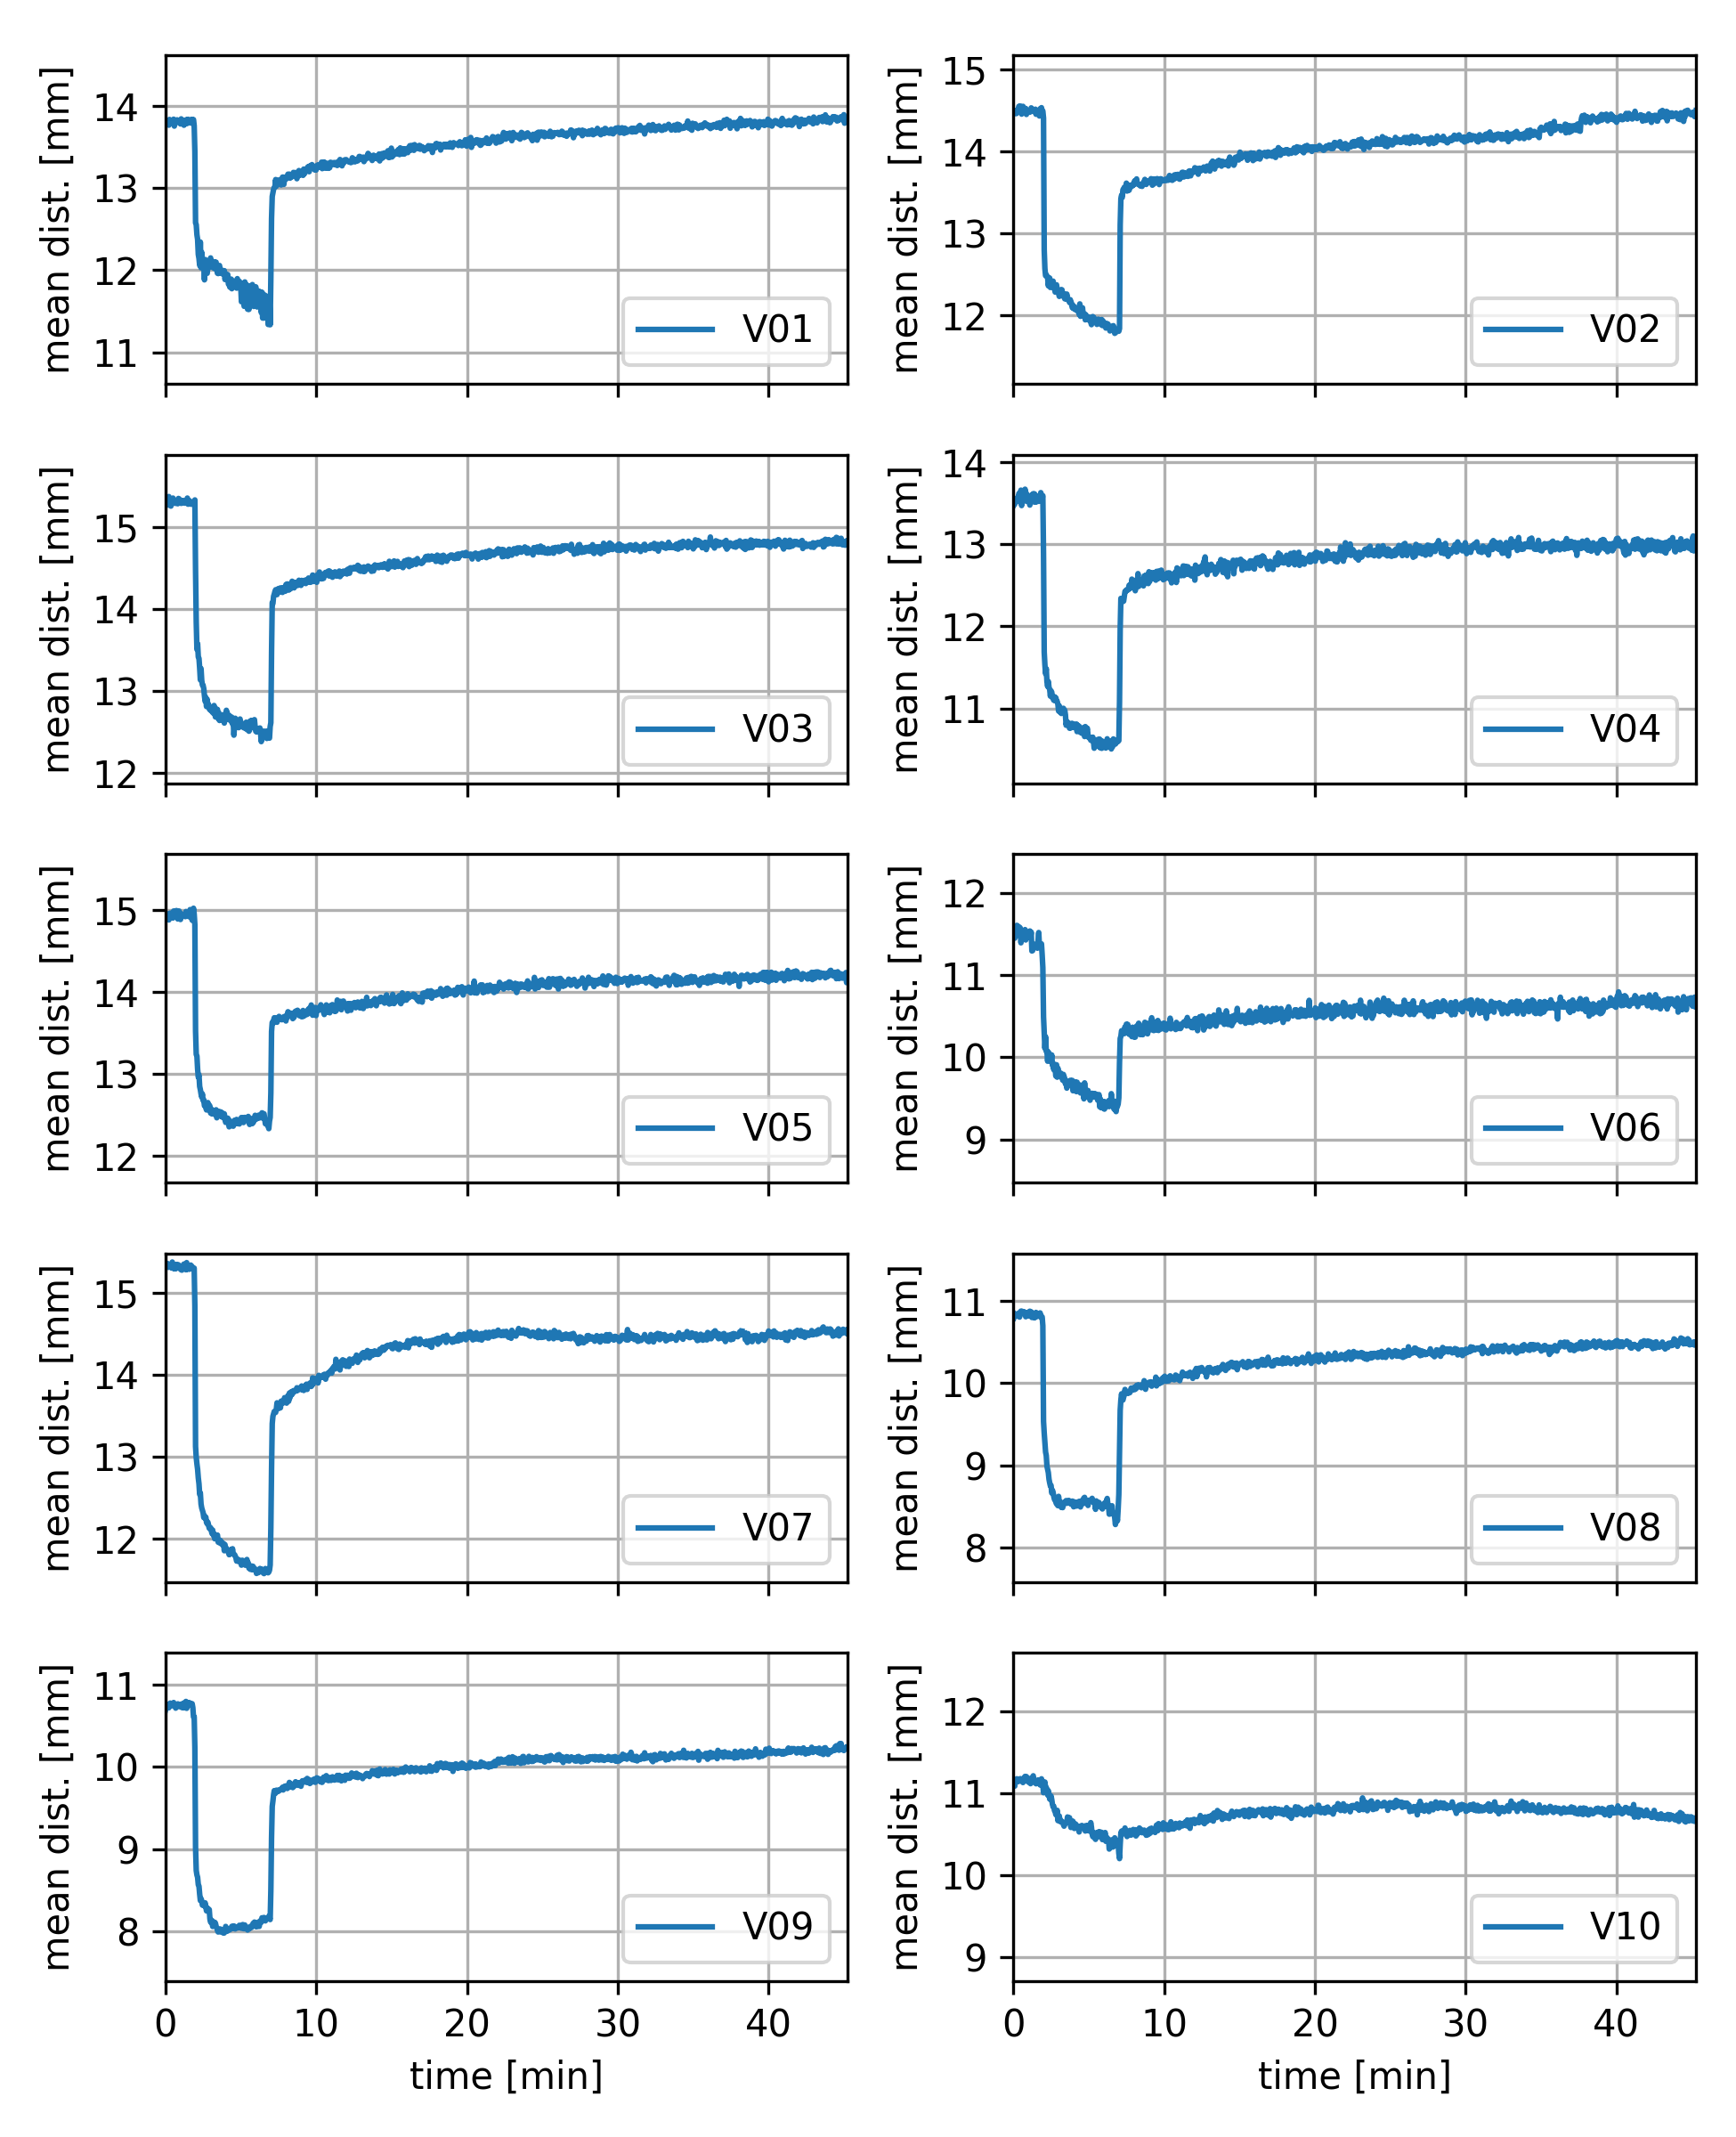
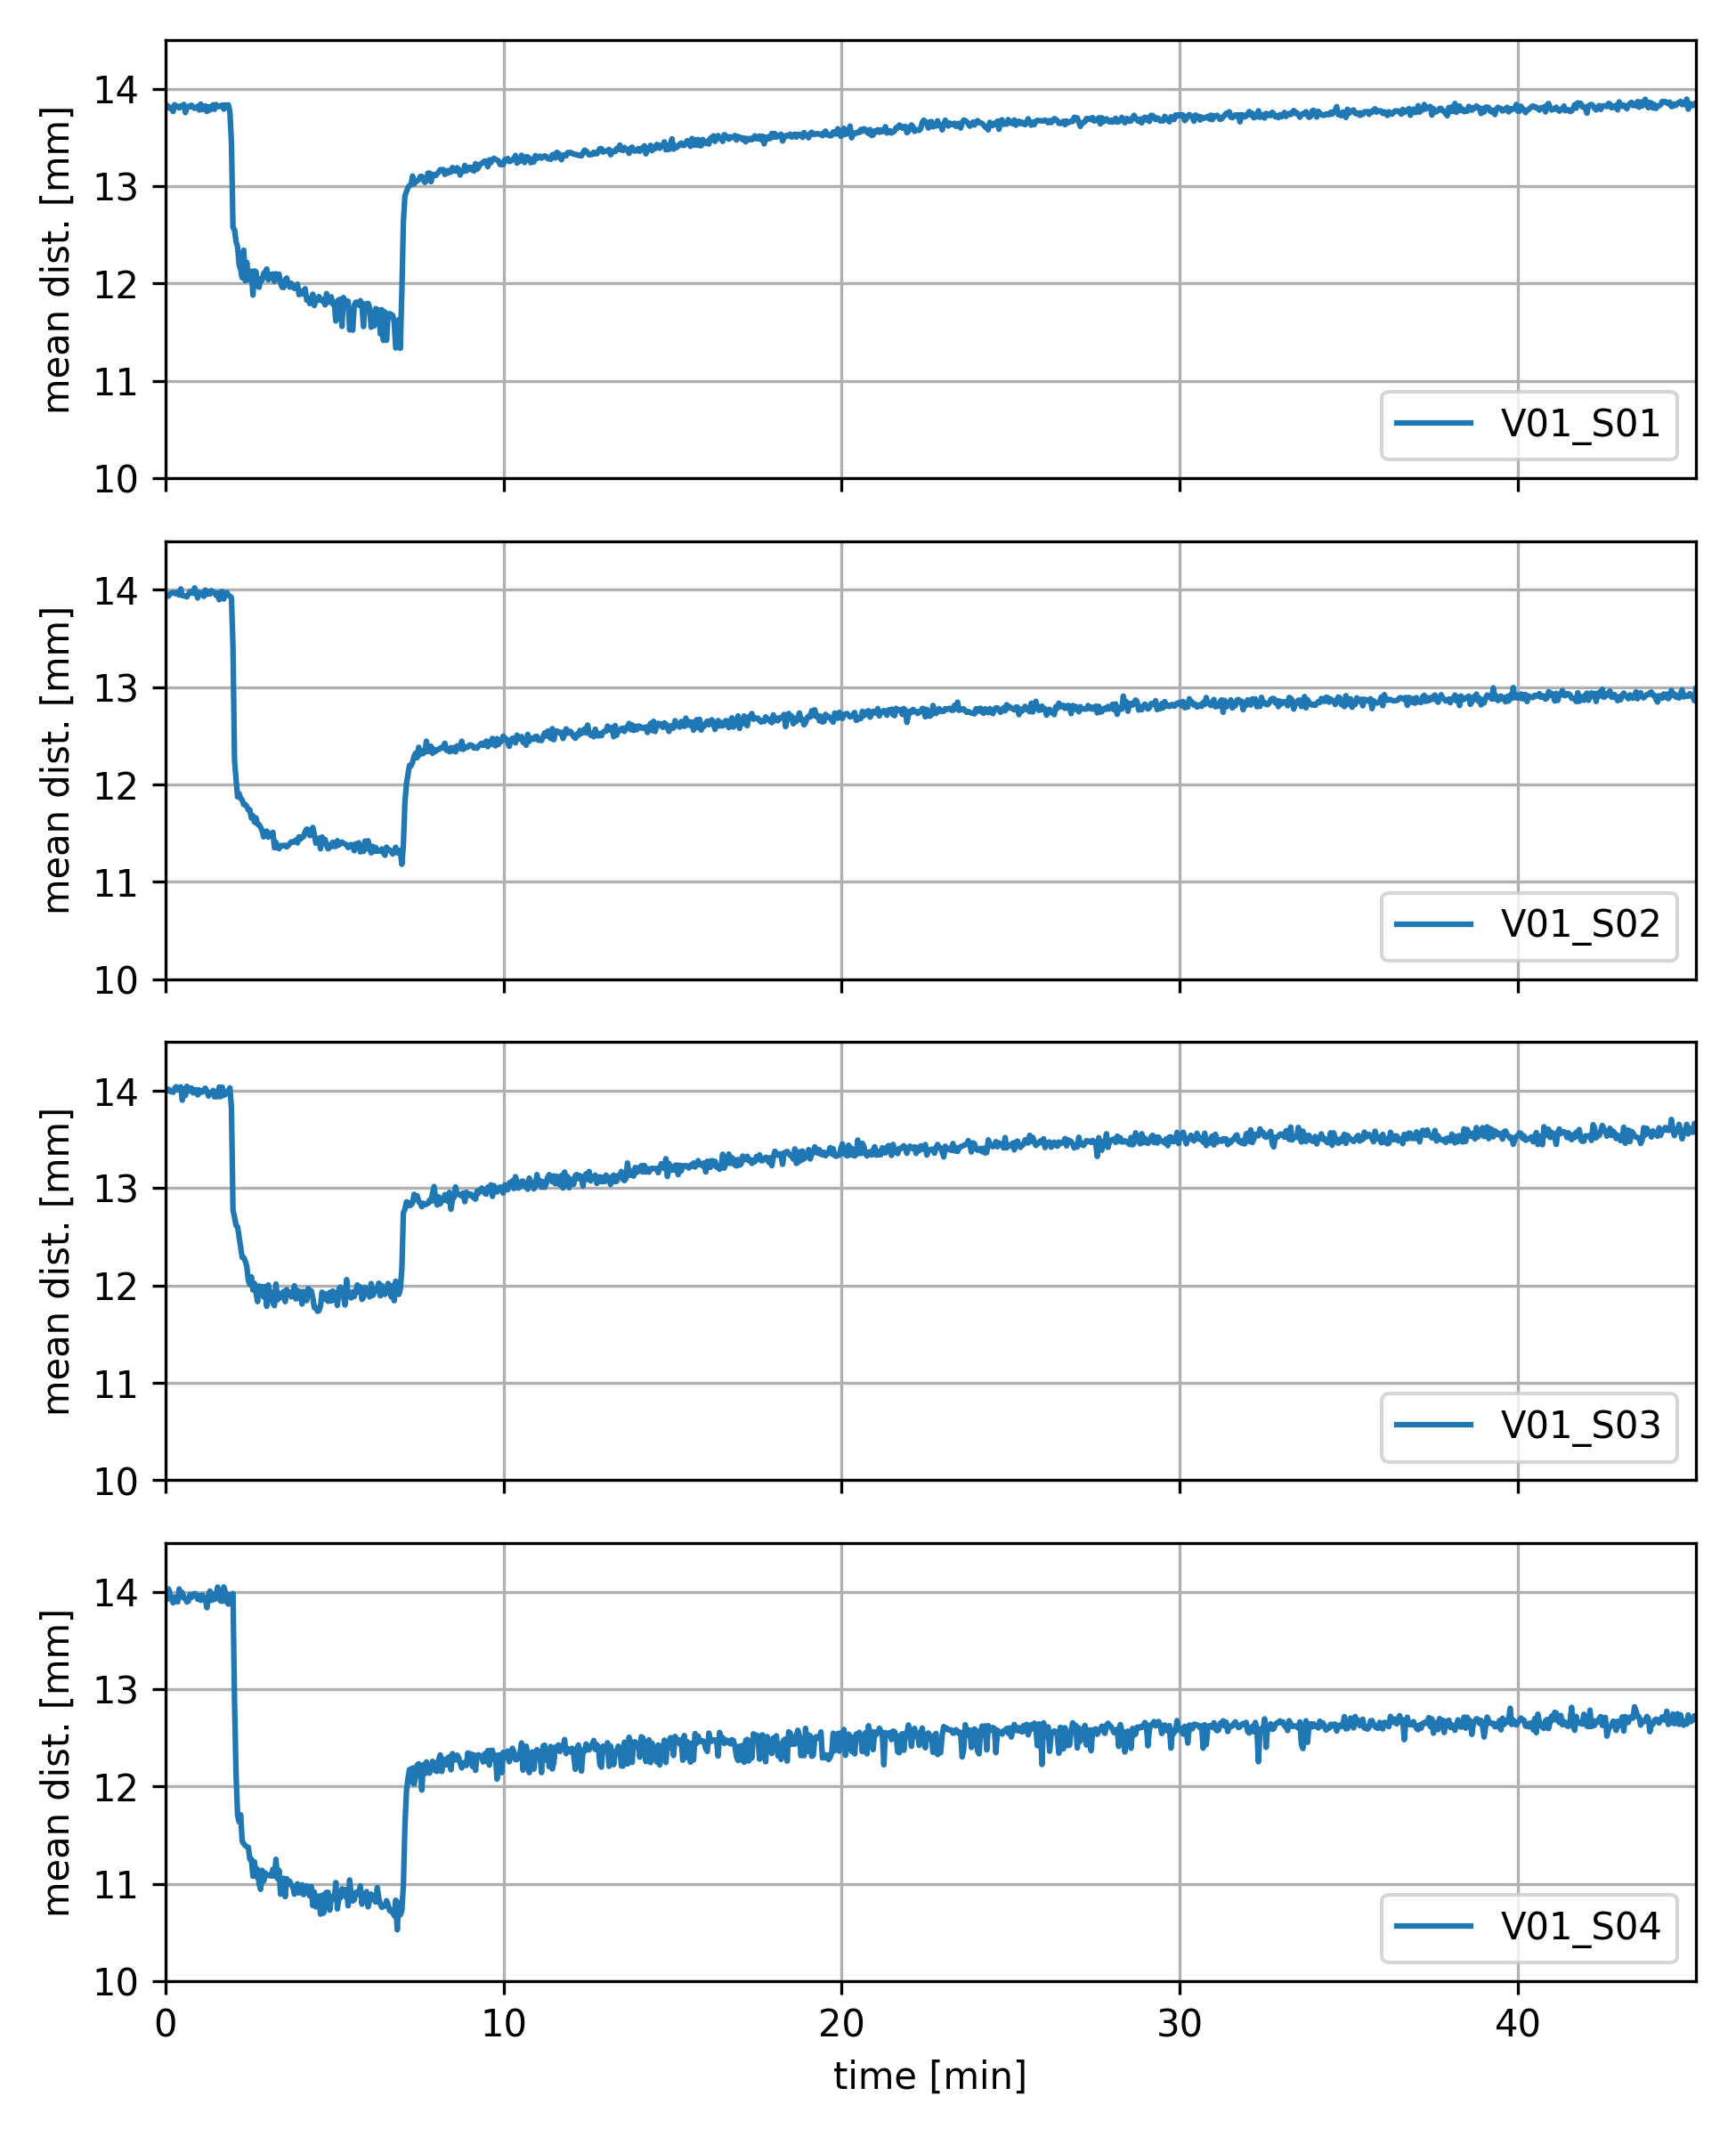
All subjects tolerated the applied loading paradigm. Figure 3 shows time frames acquired from the same subject during the baseline, loading and unloading periods, respectively, with the bone-cartilage interfaces inscribed. The time-resolved average distance between the patellar and femoral bone-cartilage interfaces is presented for the ten subjects in Fig. 4 while results from the reproducibility experiments are plotted in Fig. 5. Apart from V10, all subjects exhibit a similar compression and recovery behavior. The plots demonstrate instantaneous cartilage compression at the onset of loading and then some gradual further compression during the loading period. When the loading is released, instantaneous cartilage recovery can be observed followed by some much slower further recovery.Discussion
For the first time, the in vivo cartilage compression and recovery time course after loading and unloading was assessed via dynamic MRI. Prospective motion correction strongly mitigated load-induced motion artifacts in the acquired images and ensured that roughly the same knee slice was measured for the baseline, loading and unloading periods. It should be noted that skin motion between unloaded and loaded acquisitions slightly impairs the rigid coupling between the tracking marker and the MRI slice, thus giving rise to some residual motion. Apart from residual in-plane displacement, which could be corrected via image registration, uncorrectable through-plane slice displacement by approximately 2 mm typically occurs in these experiments (see Fig. 2), as has been assessed with static high-resolution 3D MRI using a similar experimental setup6. Despite these imperfections, all but one subject showed roughly the same cartilage compression and recovery behavior, which is characterized by a larger fully elastic compression component adapting instantaneously to applied load changes, and a smaller compression component, which only gradually adapts to load changes and exhibits in particular a very protracted recovery after unloading. The time-resolved compression and recovery behavior after loading might prove to be a useful marker for early-stage cartilage degeneration.Acknowledgements
This work was funded by the Deutsche Forschungsgemeinschaft (DFG, German Research Foundation, contract grant numbers: LA 3353/4-1, IZ 70/2-1, ME 4202/3-1).References
1. Eckstein F, Lemberger B, Gratzke C, et al. In vivo cartilage deformation after different types of activity and its dependence on physical training status. Ann Rheum Dis. 2005;64:291–5.
2. Subburaj K, Kumar D, Souza RB, et al. The Acute Effect of Running on Knee Articular Cartilage and Meniscus Magnetic Resonance Relaxation Times in Young Healthy Adults. Am. J. Sports Med. 40:2134–2141.
3. Eckstein F, Lemberger B, Stammberger T, et al. Patellar cartilage deformation in vivo after static versus dynamic loading. J Biomech. 2000;33:819–25.
4. Subburaj K, Souza RB, Stehling C, et al. Association of MR relaxation and cartilage deformation in knee osteoarthritis. J. Orthop. Res. 2012;30(6):919–926.
5. Cotofana S, Eckstein F, Wirth W, et al. In vivo measures of cartilage deformation: patterns in healthy and osteoarthritic female knees using 3T MR imaging. Eur. Radiol. 2011;21(6):1127–1135.
6. Lange T, Taghizadeh E, Knowles BR, et al. Quantification of patellofemoral cartilage deformation and contact area changes in response to static loading via high‐resolution MRI with prospective motion correction. J. Magn. Reson. Imaging. 2019;50(5):1561–1570.
7. Zaitsev M, Dold C, Sakas G, et al. Magnetic resonance imaging of freely moving objects: prospective real-time motion correction using an external optical motion tracking system. Neuroimage. 2006;31:1038–50.
8. Lange T, Maclaren J, Herbst M, et al. Knee cartilage MRI with in situ mechanical loading using prospective motion correction: Knee Cartilage MRI Using Prospective Motion Correction. Magn. Reson. Med. 2014;71(2):516–523.
9. Maclaren J, Armstrong BSR, Barrows RT, et al. Measurement and Correction of Microscopic Head Motion during Magnetic Resonance Imaging of the Brain. PLoS ONE. 11;7:e48088.
10. Burdumy M, Traser L, Richter B, et al. Acceleration of MRI of the vocal tract provides additional insight into articulator modifications: Accelerated MRI of the Vocal Tract. J. Magn. Reson. Imaging. 2015;42(4):925–935.
Figures