1112
Rapid Isotropic 3D T2 Mapping of the Knee using Dual-Echo Steady-State MRI with Compressed Sensing Reconstruction1Radiological Sciences, David Geffen School of Medicine, University of California Los Angeles, Los Angeles, CA, United States, 2Bioengineering, University of California Los Angeles, Los Angeles, CA, United States, 3MR R&D Collaborations, Siemens Medical Solutions USA, Inc., Los Angeles, CA, United States
Synopsis
Keywords: Cartilage, Cartilage
MRI T2 mapping of cartilage has been shown to be useful in characterization and monitoring of osteoarthritis (OA). Compared to conventional spin echo-based sequences, the 3D dual-echo steady-state (DESS) sequence can provide faster T2 mapping. Previous works proposed 3D DESS T2 mapping in the knee using anisotropic resolution (e.g., in-plane resolution of 0.3x0.3mm2 and slice thickness of 1.5-3mm), which limits the depiction of fine structures in 3D multiplanar reformatted images. This work investigated 3D DESS T2 mapping in the knee with isotropic acquired resolution of 0.66x0.66x0.66 mm3 and used compressed sensing (CS) to accelerate the acquisition time to <5 minutes.
Introduction
MRI T2 mapping of cartilage has been shown to be useful in characterization and monitoring of osteoarthritis (OA)1,2. Conventional spin-echo based T2 mapping3 is time-consuming and can limit the resolution and volumetric coverage for 3D knee imaging. Alternatively, the 3D dual-echo steady-state (DESS) sequence has been proposed for rapid 3D T2 mapping in the knee4,5. The DESS sequence acquires two distinct contrasts: FID and ECHO. Through modelling of signals from these two contrasts, T2 values can be calculated4-6. Previous works performed knee cartilage T2 mapping using 3D DESS sequences with anisotropic resolution (e.g., in-plane resolution of 0.3x0.3mm2 and slice thickness of 1.5-3mm)4,5, which limits the depiction of fine structures in 3D multiplanar reformatted (MPR) images. Previous works have also investigated deep learning super-resolution methods to overcome the limitation8. However, deep learning-based methods rely on large training datasets. In this work, we investigated 3D DESS T2 mapping in the knee with isotropic acquired resolution of 0.66x0.66x0.66mm3. We used compressed sensing (CS) to accelerate the acquisition time to <5 minutes and evaluated the performance using retrospective undersampling.Methods
DESS MRI CS reconstruction and T2 mapping: A variable-density undersampling mask was retrospectively applied to data in the ky-kz encoding space (Figure 1(a)). We used a 2D CS model for reconstruction: $$$\hat{x}=\underset{x}{argmin}\left\|FSx-y \right\|_{2}^{2}+\lambda_1(\left\|Wx_{FID}\right\|_{1}+\left\|Wx_{ECHO}\right\|_{1})+\lambda_2(\left\|Dx_{FID}\right\|_{1}+\left\|Dx_{ECHO}\right\|_{1})$$$ where F is the Fourier Transform, S denotes coil sensitivity maps, x denotes reconstructed images, y denotes multi-coil multi-contrast k-space data, W represents the 2D wavelet transform, and D represents the total variation operator. Undersampling factors (R) of 3.5 and 5 were used. T2 maps were calculated using dictionary-based fitting9.Phantom study: We scanned an ISMRM/NIST phantom with reference T2 values. Because knee cartilage T2 values are typically <100 ms6,7, vials with reference T2 values >100ms were not analyzed. We scanned the phantom with (1) a reference 2D spin-echo sequence using 6 separate acquisitions of different TEs: 11/22/33/44/55/66 ms, (2) a research application sequence of 3D DESS with TE/TR/flip angle (FA): 5.2ms/19 ms/25°, (3) the same 3D DESS sequence with parallel imaging (GRAPPA, R=2). T2 maps from 2D spin-echo images were calculated using mono-exponential fitting.
In vivo study: In an IRB-approved and HIPAA-compliant study, 10 healthy subjects were scanned on 3T MRI scanners (MAGNETOM Prisma or Skyra, Siemens Healthcare, Erlangen, Germany). Fully-sampled isotropic 0.66x0.66x0.66mm3 3D DESS datasets using the research application sequence would require an acquisition time >14 minutes, which increases sensitivity to subject bulk motion. Therefore, only 3D DESS + GRAPPA (R=2) was acquired. Key sequence parameters included: TE/TR/FA = 5.2 ms/19 ms/25°, sagittal scan with field of view = 170x170mm2, and 160 slices.
Analysis: For the phantom study, we evaluated the T2 quantification accuracy by comparing with the reference phantom T2 values. For the in vivo study, we compared the image quality using structural similarity index (SSIM). Image quality was also scored by a blinded, fellowship-trained musculoskeletal radiologist (4 years’ experience) using a 5-point Likert scale (1: nondiagnostic to 5: excellent/artifact-free) to assess Noise/Artifact and Sharpness/Detail. Source sagittal images and triplane orthogonal MPR were reviewed in a randomized order. Last, we compared cartilage T2 values by applying 3D cartilage segmentation masks generated from a vendor-provided prototypical software (MR ChondralHealth, Siemens Healthcare, Erlangen, Germany) on the DESS T2 maps.
Results
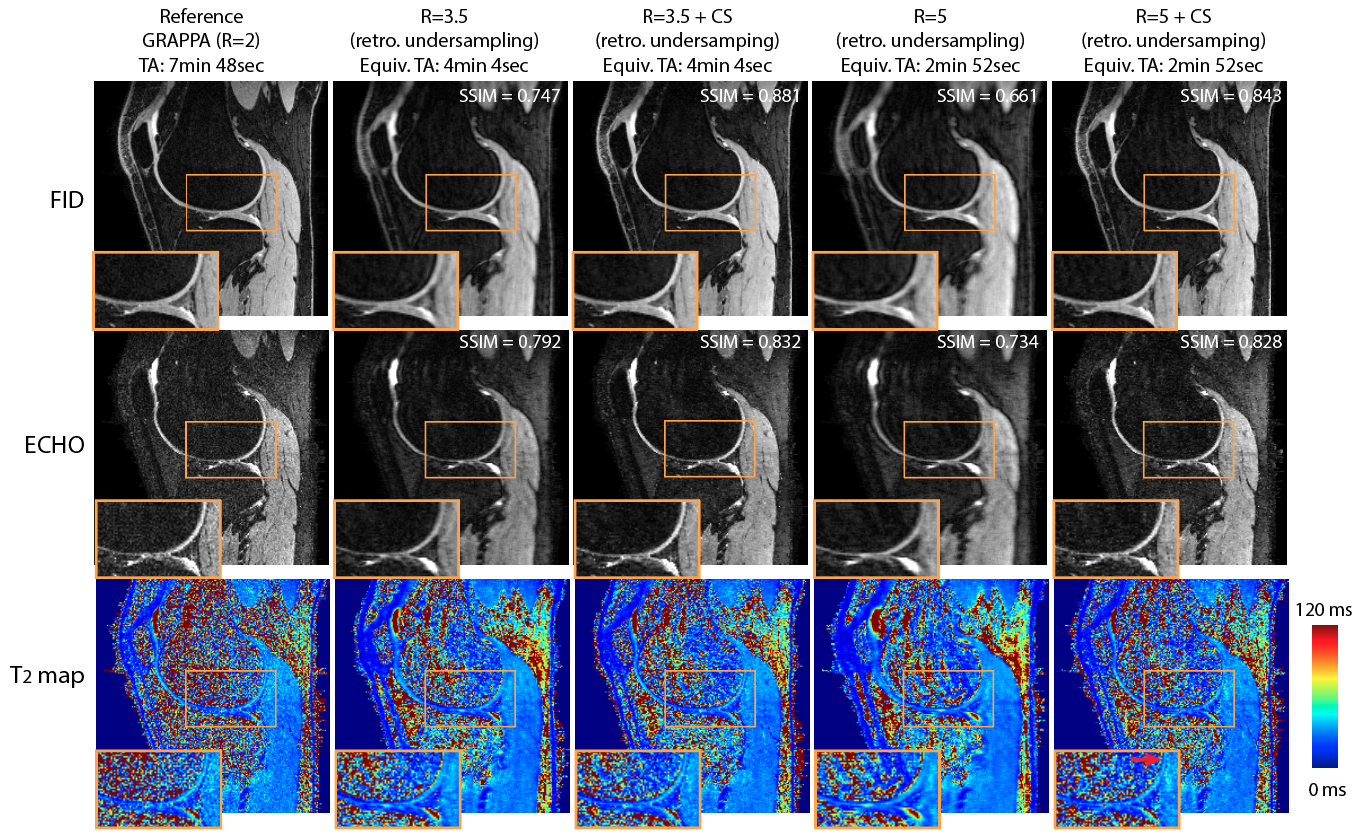
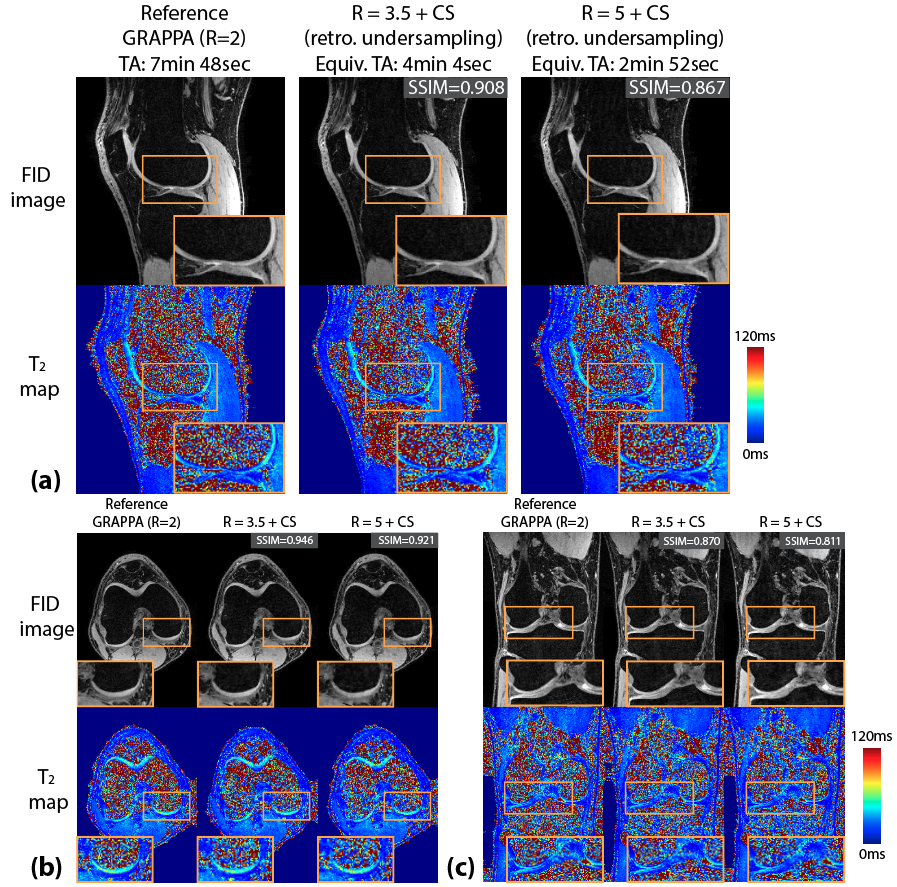
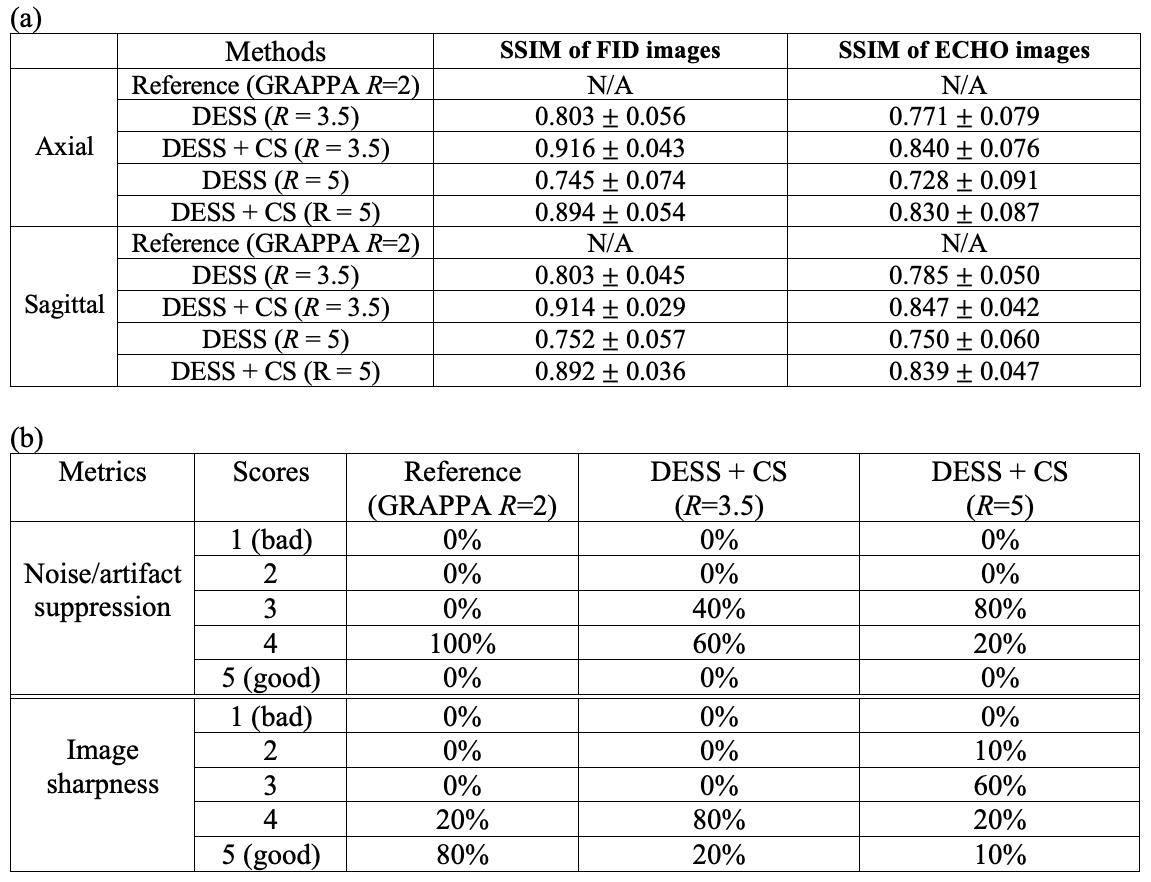
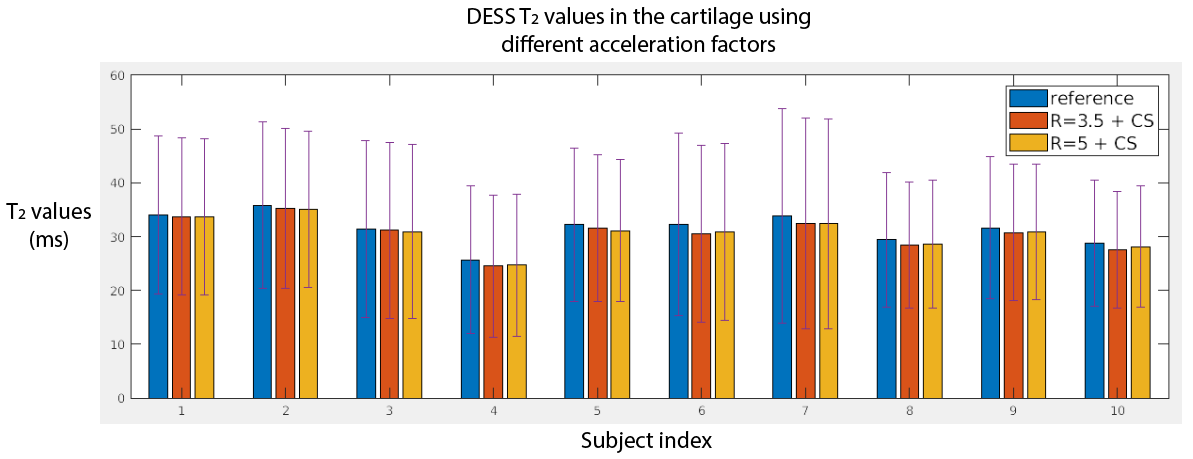
T2 values from fully-sampled DESS, DESS+GRAPPA and DESS+CS all showed high concordance correlation coefficients versus reference T2 values in the phantom (Figure 1). Figure 2 shows representative in vivo results. Both R=3.5+CS and R=5+CS can recover tissue features and achieve high SSIM scores (>0.8), but R=5+CS exhibits more blurring in the T2 maps (red arrows). Figure 3 shows that CS reconstructed images achieved high SSIM in all 3 orientations. Table 1 compares image quality using SSIM and radiological scores. CS results from both acceleration factors achieved high SSIM scores. However, R=5+CS had lower radiological scores. Figure 4 compares the cartilage DESS T2 values in all subjects. R=3.5+CS and R=5+CS both produced consistent DESS T2 values in the cartilage compared to in vivo reference DESS+GRAPPA.Discussion
We demonstrated accelerated 3D DESS T2 mapping (<5 minutes) with isotropic resolution in the reference phantom and healthy subjects. Widescale clinical adoption of the DESS sequence and T2 mapping have been limited by long acquisition times. We overcame this limitation by using CS while maintaining isotropic resolution, which allowed us to generate MPR images that optimally depict knee anatomy. We compared two undersampling factors (R=3.5 and R=5) with equivalent scan times (min:sec) of 4:04 and 2:52. Both achieved high SSIM and the R=3.5 results have similar radiological image quality scores compared to the reference. However, radiologist scoring suggests more smoothing and higher artifact level in R=5 results. On the other hand, the mean T2 values in the cartilage using R=5 are consistent with the reference, which suggests DESS R=5+CS could serve as a rapid (<3 minute) 3D T2 cartilage mapping method if the images are not intended for anatomic interpretation. In our future work, prospective 3D DESS undersampling and CS models considering multi-contrast constraints will be investigated.Conclusion
We achieved accelerated 3D T2 mapping with acquired isotropic resolution of 0.66x0.66x0.66 mm3 in <5 minutes equivalent scan time for knee cartilage using a 3D DESS sequence and CS reconstruction.Acknowledgements
This work was supported in part by Siemens Medical Solutions USA, Inc. We thank the research coordinators and the MRI technologists at UCLA.
References
[1] Dunn, T. C., Lu, Y., Jin, H., Ries, M. D., & Majumdar, S. (2004). T2 relaxation time of cartilage at MR imaging: comparison with severity of knee osteoarthritis. Radiology, 232(2), 592.
[2] David-Vaudey, E., Ghosh, S., Ries, M., & Majumdar, S. (2004). T2 relaxation time measurements in osteoarthritis. Magnetic resonance imaging, 22(5), 673-682.
[3] Mamisch, T. C., Trattnig, S., Quirbach, S., Marlovits, S., White, L. M., & Welsch, G. H. (2010). Quantitative T2 mapping of knee cartilage: differentiation of healthy control cartilage and cartilage repair tissue in the knee with unloading—initial results. Radiology, 254(3), 818-826.
[4] Staroswiecki, E., Granlund, K. L., Alley, M. T., Gold, G. E., & Hargreaves, B. A. (2012). Simultaneous estimation of T2 and apparent diffusion coefficient in human articular cartilage in vivo with a modified three‐dimensional double echo steady state (DESS) sequence at 3 T. Magnetic resonance in medicine, 67(4), 1086-1096.
[5] Sveinsson, B., Chaudhari, A. S., Gold, G. E., & Hargreaves, B. A. (2017). A simple analytic method for estimating T2 in the knee from DESS. Magnetic resonance imaging, 38, 63-70.
[6] Watanabe, A., Boesch, C., Siebenrock, K., Obata, T. and Anderson, S.E. (2007), T2 mapping of hip articular cartilage in healthy volunteers at 3T: A study of topographic variation. Journal of Magnetic Resonance Imaging, 26: 165-171.
[7] Li, X., Benjamin Ma, C., Link, T.M., Castillo, D.-D., Blumenkrantz, G., Lozano, J., Carballido-Gamio, J., Ries, M., Majumdar, S. (2007), In vivo T1ρ and T2 mapping of articular cartilage in osteoarthritis of the knee using 3T MRI, Osteoarthritis and Cartilage, 15: 789-797,
[8] Chaudhari, A. S., Fang, Z., Kogan, F., Wood, J., Stevens, K. J., Gibbons, E. K., & Hargreaves, B. A. (2018). Super‐resolution musculoskeletal MRI using deep learning. Magnetic resonance in medicine, 80(5), 2139-2154.
[9] Dregely, I., Margolis, D. A., Sung, K., Zhou, Z., Rangwala, N., Raman, S. S., & Wu, H. H. (2016). Rapid quantitative T2 mapping of the prostate using three‐dimensional dual echo steady state MRI at 3T. Magnetic Resonance in Medicine, 76(6), 1720-1729.
Figures
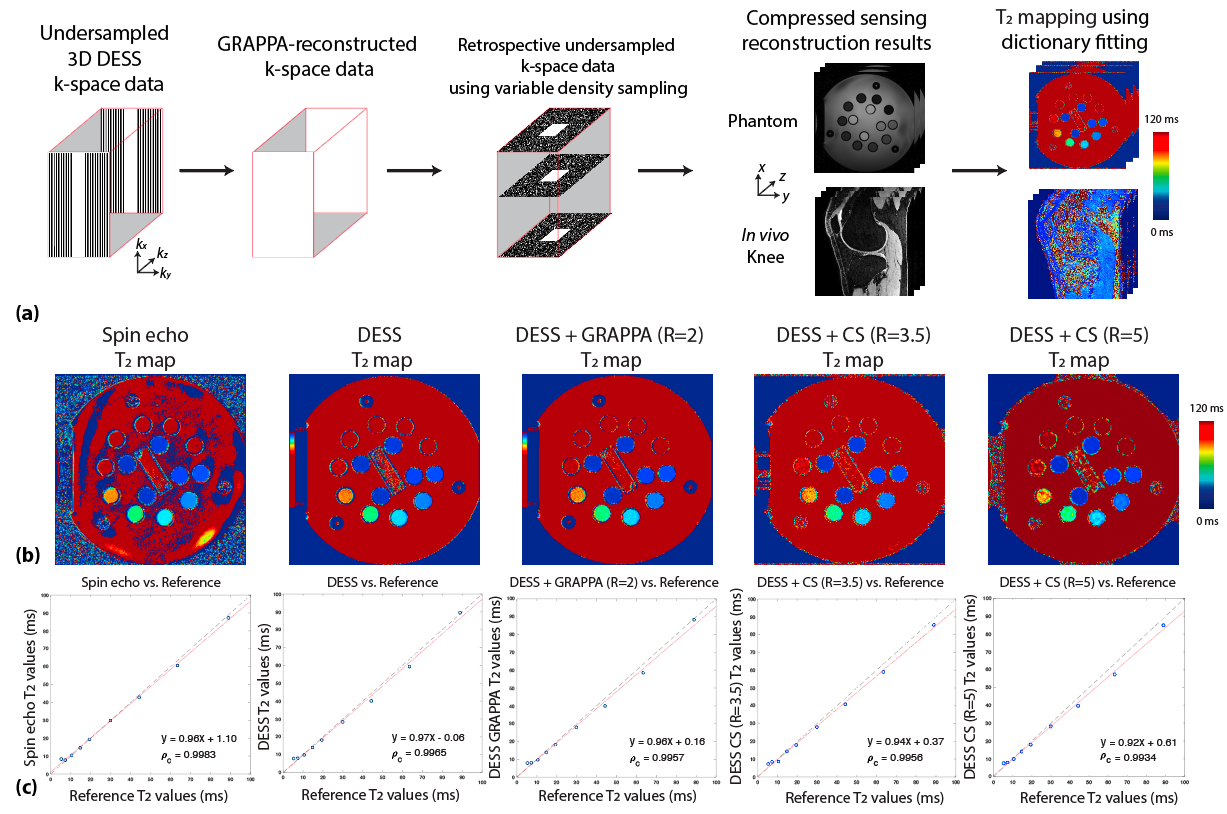
Figure 1. (a) Reconstruction pipeline using retrospectively undersampled 3D DESS MRI data. (b) T2 mapping results in the reference ISMRM/NIST phantom using 2D spin-echo, 3D DESS, 3D DESS+GRAPPA (R=2), 3D DESS+CS (R=3.5), and 3D DESS+CS (R=5). (c) Correlation plots between measured T2 values from each method versus reference phantom T2 values. (ρc: concordance correlation coefficient.)