1111
High Contrast Cartilaginous Endplate Imaging Using Dual-Inversion Recovery Prepared Ultrashort Echo Time (DIR-UTE) Sequence1Radiology, UCSD, San Diego, CA, United States, 2Bioengineering, UCSD, San Diego, CA, United States, 3GE Healthcare, San Diego, CA, United States, 4Medicine, UCSD, San Diego, CA, United States, 5Radiology Service, VA, San Diego, CA, United States
Synopsis
Keywords: MSK, Contrast Mechanisms, Cartilaginous endplate, Spine
The cartilaginous endplate (CEP) plays a key role in maintaining the normal function of the intervertebral disc (IVD) by acting as a bridge for the transport of nutrients into the IVD cells. In this study, we developed a 3D dual inversion recovery prepared ultrashort echo time (DIR-UTE) sequence for high contrast CEP imaging and compared its performance with previously developed techniques on a clinical 3T scanner. We found that the proposed DIR-UTE sequence demonstrated the best image contrast for CEP imaging, which is highly promising for future clinical use.Introduction
Intervertebral disc (IVD) degeneration has been recognized as the main cause of chronic low back pain (1). The cartilaginous endplate (CEP) is a thin layer of hyaline cartilage that acts as the nutrient transport bridge in the disc cells (2). Because the CEP has a relatively short T2 relaxation time (i.e., ~15ms) (3), conventional clinical sequences cannot detect sufficient CEP signals for direct imaging or quantification. Ultrashort echo time (UTE) sequences with echo times shorter than 100µs can overcome this limitation and is able to handle imaging tissues with very short T2s (4,5).Recently, several UTE techniques have been developed for long T2 suppression and selective imaging of short T2 tissues, such as dual-echo UTE with subtraction(6), T1 weighted fat saturated UTE (T1w-FS-UTE) (7), inversion recovery prepared and fat saturated UTE (IR-FS-UTE) (8) and dual inversion recovery prepared UTE (DIR-UTE) (9) sequences. The UTE sequences incorporating adiabatic full passage (AFP) pulses are very efficient in generating high contrast amongst short and long T2 tissues (8,9,11–13). Implementing such techniques from the literature, such as IR-FS-UTE, that have previously been used for high contrast imaging of the OCJ and CEP (8,14). In CEP imaging, the IR-FS-UTE sequence can produce a very high contrast between CEP and NP. However, the contrast between CEP and BM is limited because of the utilized FatSat module that prohibits efficient fat suppression if more spokes are used in a TR. This inefficient fat suppression can be overcome by replacing the FatSat module with another AFP pulse that is centered on the fat frequency, like the DIR-UTE technique. The DIR-UTE sequence has been shown to generate a very high image contrast for the OCJ region with efficient suppression of signals from both the superficial cartilage and marrow fat (9).
Given its advantages in high contrast imaging of short T2 tissues, in this study, we propose to further optimize the DIR-UTE sequence for high contrast imaging of CEP in the human lumbar spine, and compare its performance with other established UTE techniques, namely T1w-FS-UTE and IR-FS-UTE.
Methods
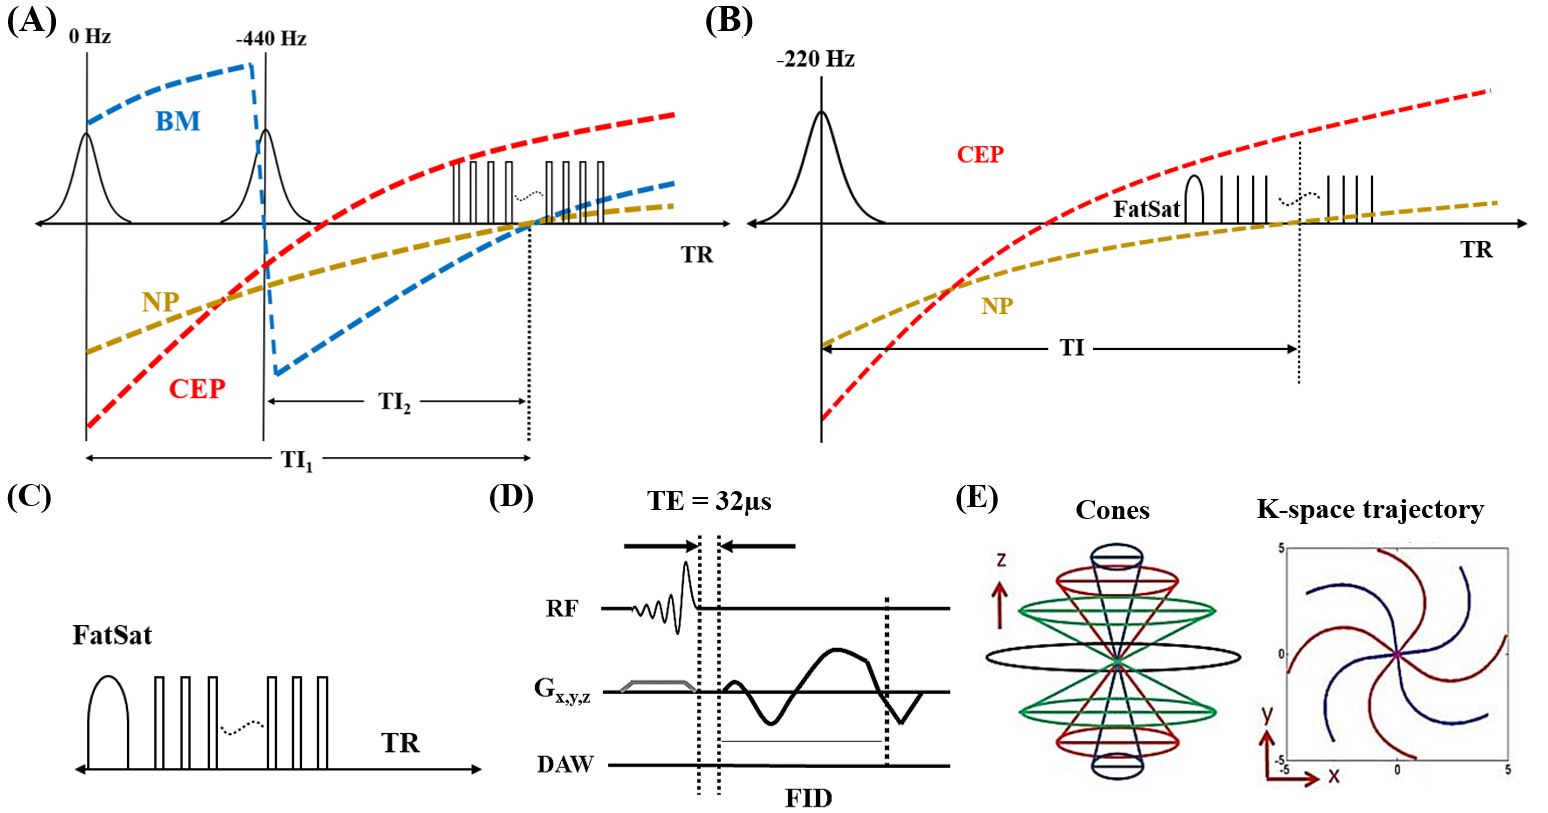
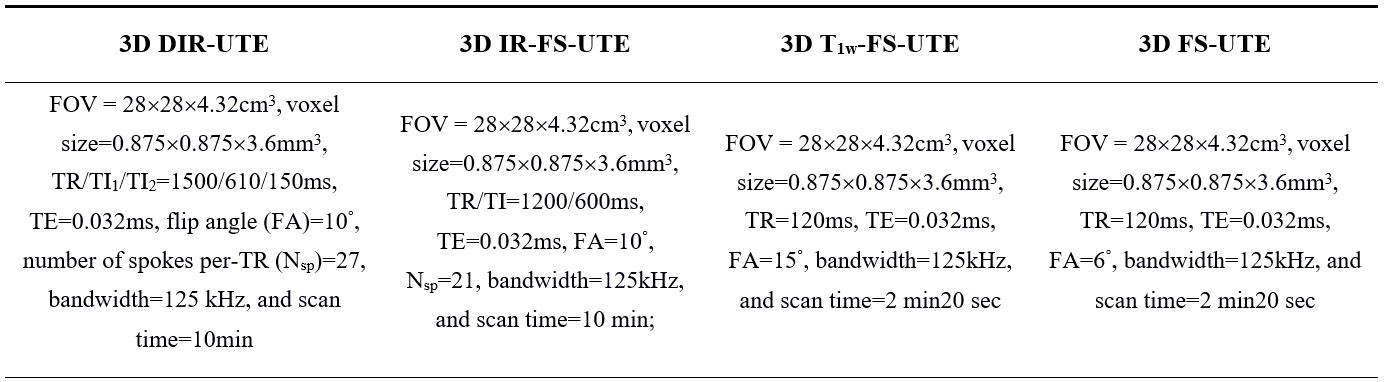
This study was approved by the institutional review board. Four healthy subjects and one patient with low back pain were recruited for lumbar spine imaging using both clinical (i.e., T2w-FSE) and UTE (DIR-UTE, IR-FS-UTE, T1w-FS-UTE, and FS-UTE) sequences on a 3T GE scanner.Figure 1 shows the sequence diagram for different UTE techniques. The DIR-UTE sequence utilizes two AFP pulses to invert long T2 water (e.g., NP) and fat with center frequencies of 0 and -440Hz respectively (Figure 1A). The IR-FS-UTE sequence employs an AFP pulse for inverting long NP while the FatSat module is utilized to improve CEP contrast against BM (Figure 1B). Only the FatSat module was applied for fat suppression in both T1w-FS-UTE and FS-UTE sequences (Figure 1C). The multispoke acquisition strategy was employed in all UTE sequences to reduce the total scan time. For signal excitation in each spoke, a slab selective half pulse (Shinnar-Le Roux design, duration 1132μs and bandwidth 16 kHz) with variable-rate selective excitation (VERSE) design (15) was utilized (Figure 1D). The 3D Cones trajectory enables efficient k-space coverage for all UTE scans (Figure 1E). The detailed parameters for all the sequences are listed in Table 1.
To evaluate image contrast, CNRs between the CEP and BM (CNRCEP-BM) and between the CEP and NP (CNRCEP-NP) were calculated as the mean differences in signal between these tissues divided by the background noise. The noise was calculated as the standard deviation of signals measured from an ROI in an artifact-free background region. The CNRs were calculated for each disc for each subject.
Results and Discussion
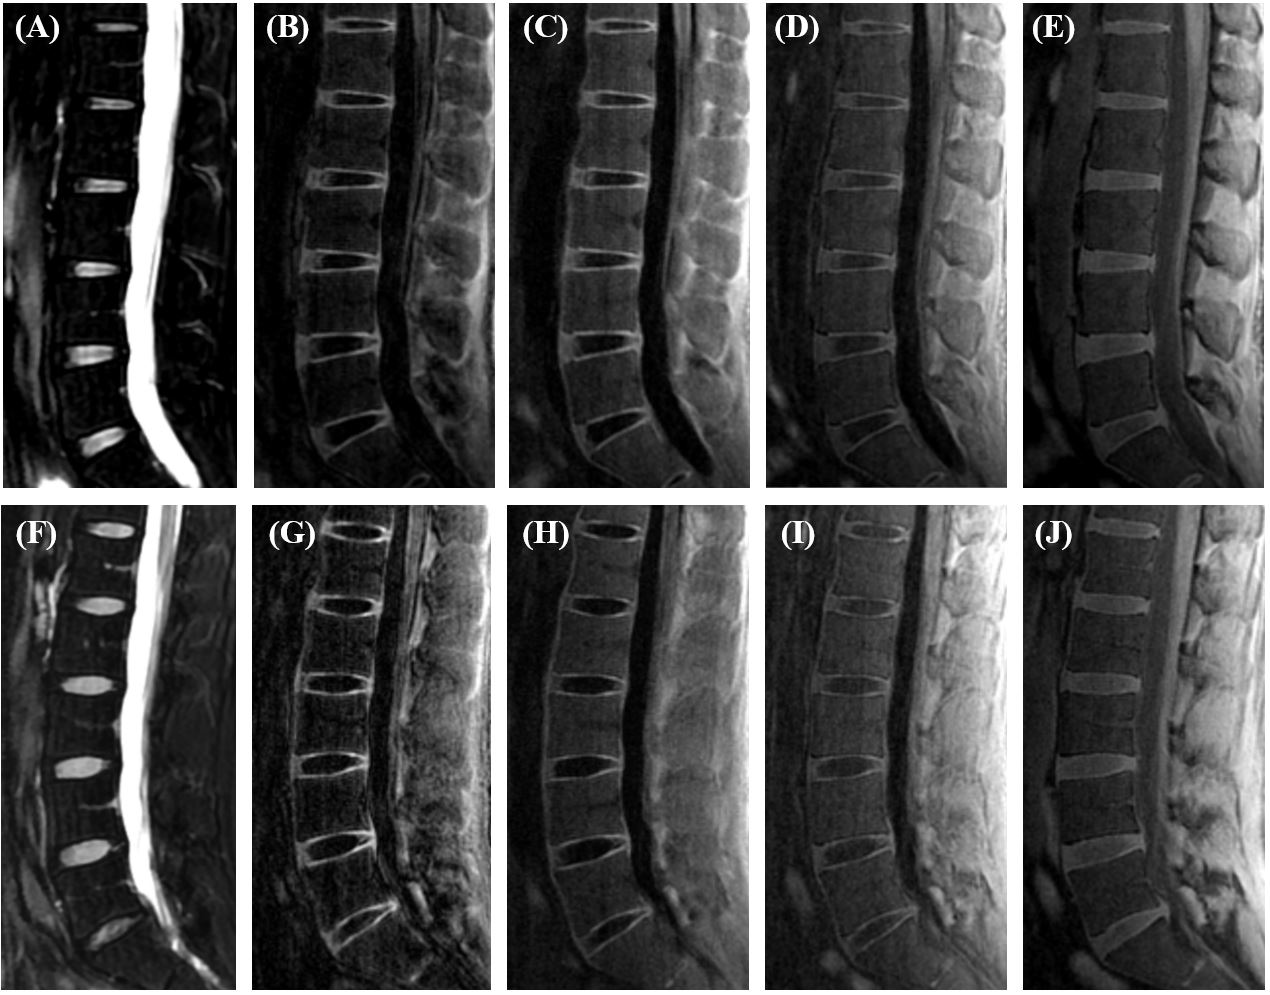
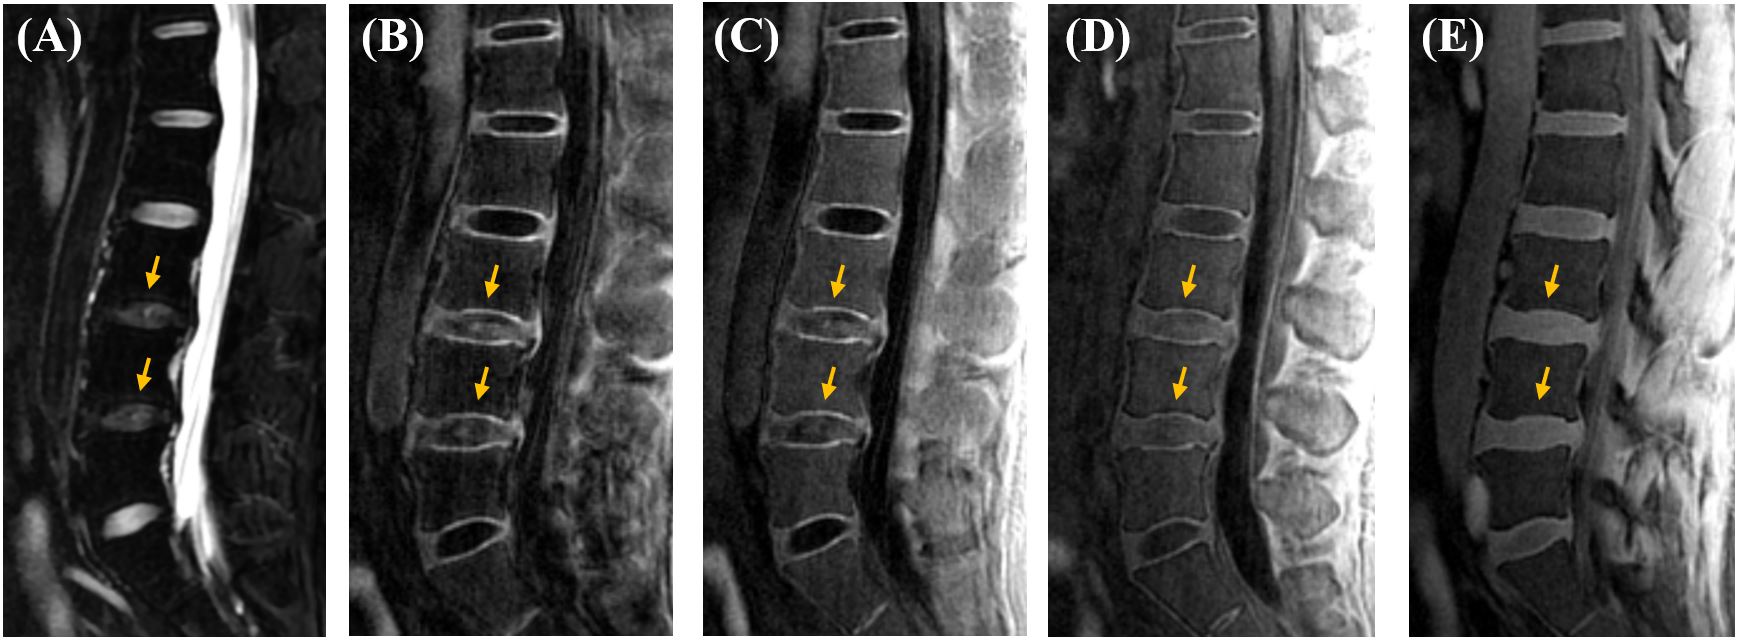
Figure 2 shows the representative lumbar spine images from two healthy volunteers. The CEP signal cannot be efficiently captured in the clinical T2w-FSE sequence owing to its relatively short T2 relaxation time, while it is clearly seen on all UTE images. The DIR-UTE, IR-FS-UTE, andT1w-FS-UTE sequences all produce higher CEP contrast than the regular FS-UTE sequence. The DIR-UTE images show the best CEP contrast.Figure 3 shows representative lumbar spine images from a patient with low back pain. Similar to healthy subjects, the clinical T2w-FSE sequence does not capture signals from the CEP region, while DIR-UTE, IR-FS-UTE, T1w-FS-UTE present better CEP contrast than regular FS-UTE. The NP regions of degenerated discs in DIR-UTE, IR-FS-UTE, and T1w-FS-UTE images show relatively higher signals than those in normal discs. This may be because of shortened T1 relaxation time in NP due to disc dehydration (16–18).
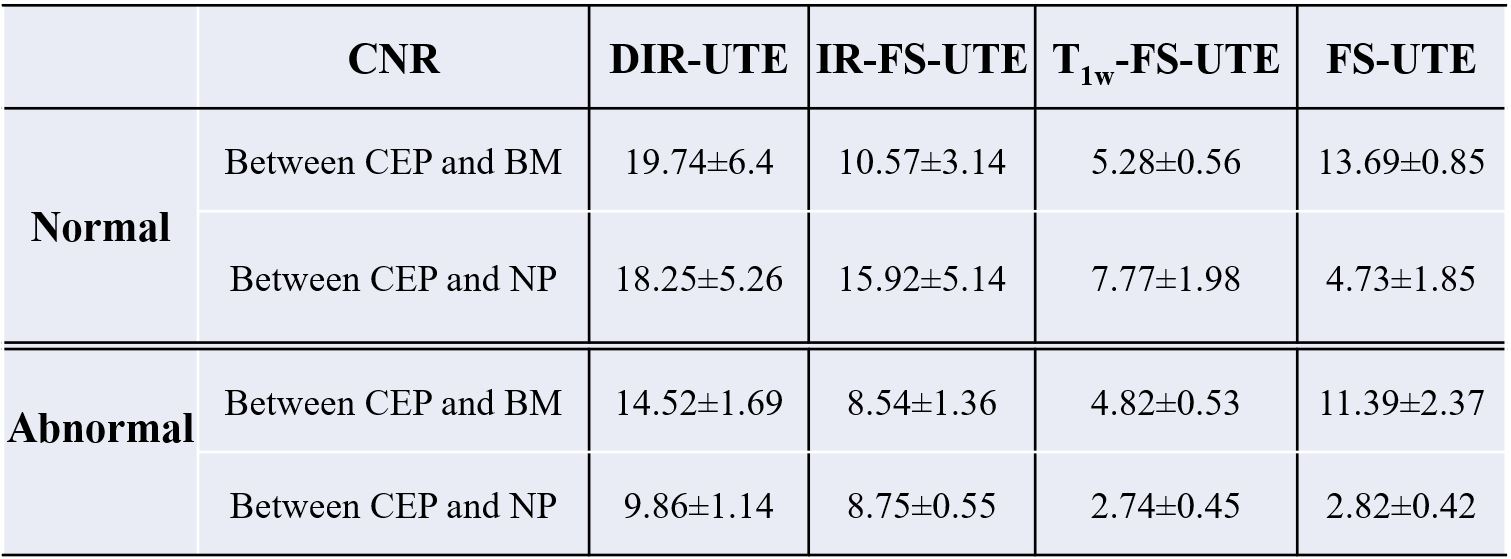
Table 2 summarizes CNRCEP-BM and CNRCEP-NP for all UTE sequences. Amongst these different sequences used, DIR-UTE presents the highest CEP contrast, followed by IR-FS-UTE, T1w-FS-UTE, and FS-UTE. The CEP region for the abnormal case records lower values than normal subjects.
These findings demonstrate that the 3D DIR-UTE sequence can achieve high contrast imaging of the CEP region with better CNRs compared to other sequences.
Conclusion
The optimized 3D DIR-UTE sequences proposed in this study showed the best CEP contrast of all the tested sequences, suggesting that the former may facilitate better evaluation of the vital CEP region in clinical practice.Acknowledgements
The authors acknowledge grant support from the National Institutes of Health (R01AR062581, R01AR068987, R01AR075825, R01AR079484, RF1AG075717 and R21AR075851), VA Clinical Science and Rehabilitation Research and Development Services (Merit Awards I01CX001388, I01CX002211, and I01RX002604), and GE Healthcare.References
1. Zheng CJ, Chen J. Disc degeneration implies low back pain. Theor. Biol. Med. Model. 2015;12:1–10 doi: 10.1186/s12976-015-0020-3.
2. Arpinar VE, Rand SD, Klein AP, Maiman DJ, Muftuler LT. Changes in perfusion and diffusion in the endplate regions of degenerating intervertebral discs: a DCE-MRI study. Eur. Spine J. 2015;24:2458–2467 doi: 10.1007/s00586-015-4172-y.
3. Chang EY, Du J, Chung CB. UTE imaging in the musculoskeletal system. J. Magn. Reson. Imaging 2015;41:870–883 doi: 10.1002/jmri.24713.
4. Ma Y, Jang H, Jerban S, et al. Making the invisible visible — ultrashort echo time magnetic resonance imaging : Technical developments and applications Making the invisible visible — ultrashort echo time magnetic resonance imaging : Technical developments and applications. 2022;041303 doi: 10.1063/5.0086459.
5. Afsahi AM, Ma Y, Jang H, et al. Ultrashort Echo Time Magnetic Resonance Imaging Techniques: Met and Unmet Needs in Musculoskeletal Imaging. J. Magn. Reson. Imaging 2021:1–16 doi: 10.1002/jmri.28032.
6. Du J, Bydder M, Takahashi AM, Carl M, Chung CB, Bydder GM. Short T2 contrast with three-dimensional ultrashort echo time imaging. Magn. Reson. Imaging 2011;29:470–482 doi: 10.1016/j.mri.2010.11.003.
7. Cai Z, Wei Z, Wu M, et al. Knee osteochondral junction imaging using a fast 3D T1-weighted ultrashort echo time cones sequence at 3T. Magn. Reson. Imaging 2020;73:76–83 doi: 10.1016/j.mri.2020.08.003.
8. Lombardi AF, Wei Z, Wong J, et al. High contrast cartilaginous endplate imaging using a 3D adiabatic inversion-recovery-prepared fat-saturated ultrashort echo time (3D IR-FS-UTE) sequence. NMR Biomed. 2021;34:1–11 doi: 10.1002/nbm.4579.
9. Lombardi AF, Jang H, Wei Z, et al. High‐contrast osteochondral junction imaging using a 3D dual adiabatic inversion recovery‐prepared ultrashort echo time cones sequence. NMR Biomed. 2021;34:1–11 doi: 10.1002/nbm.4559.
10. Lee YH, Kim S, Song HT, Kim IS, Suh JS. Weighted subtraction in 3D ultrashort echo time (UTE) imaging for visualization of short T2 tissues of the knee. Acta radiol. 2014;55:454–461 doi: 10.1177/0284185113496994.
11. Du J, Takahashi AM, Bae WC, Chung CB, Bydder GM. Dual inversion recovery, ultrashort echo time (DIR UTE) imaging: Creating high contrast for short-T2 species. Magn. Reson. Med. 2010;63:447–455 doi: 10.1002/mrm.22257.
12. Jang H, Ma Y, Searleman AC, et al. Inversion recovery UTE based volumetric myelin imaging in human brain using interleaved hybrid encoding. Magn. Reson. Med. 2020;83:950–961 doi: 10.1002/mrm.27986.
13. Ma YJ, Jang H, Wei Z, et al. Myelin imaging in human brain using a short repetition time adiabatic inversion recovery prepared ultrashort echo time (STAIR-UTE) MRI sequence in multiple sclerosis. Radiology 2020;297:392–404 doi: 10.1148/RADIOL.2020200425.
14. Ma YJ, Jerban S, Carl M, et al. Imaging of the region of the osteochondral junction (OCJ) using a 3D adiabatic inversion recovery prepared ultrashort echo time cones (3D IR-UTE-cones) sequence at 3 T. NMR Biomed. 2019;32:1–13 doi: 10.1002/nbm.4080.
15. Hargreaves BA, Cunningham CH, Nishimura DG, Conolly SM. Variable-rate selective excitation for rapid MRI sequences. Magn. Reson. Med. 52.
16. Wei Z, Lombardi AF, Lee RR, et al. Comprehensive assessment of in vivo lumbar spine intervertebral discs using a 3D adiabatic T1ρ prepared ultrashort echo time (UTE-Adiab-T1ρ) pulse sequence. Quant. Imaging Med. Surg. 2022;12:269–280 doi: 10.21037/qims-21-308.
17. Antoniou J, Steffen T, Nelson F, et al. The human lumbar intervertebral disc: Evidence for changes in the biosynthesis and denaturation of the extracellular matrix with growth, maturation, ageing, and degeneration. J. Clin. Invest. 1996;98:996–1003 doi: 10.1172/JCI118884.
18. URBAN JPG, HOLM S, MAROUDAS A, NACHEMSON A. Nutrition of the Intervertebral Disc. Clin. Orthop. Relat. Res. 1982;170:296-302 doi: 10.1097/00003086-198210000-00039.
Figures