1110
Utilization of an MRI compatible loading device for the evaluation of unloaded-to-loaded changes in region specific tibial cartilage T1ρ and T2:
Erin C Argentieri1, Andrew C Zhu2, Arden Wach2, Ashley Pekmezian2, Sonia Bansal2, Ryan E Breighner1, Hollis G Potter1, Suzanne A Maher2, and Matthew F Koff1
1Radiology and Imaging, Hospital for Special Surgery, New York, NY, United States, 2Biomechanics, Hospital for Special Surgery, New York, NY, United States
1Radiology and Imaging, Hospital for Special Surgery, New York, NY, United States, 2Biomechanics, Hospital for Special Surgery, New York, NY, United States
Synopsis
Keywords: Cartilage, Quantitative Imaging
Evaluation of unloaded-to-loaded changes within cartilage revealed that tibial cartilage thickness, T1ρ, and T2 metrics all decreased/shortened following application of 50% BW axial load. Shortening of loaded qMRI values is likely attributed to water loss from the cartilage matrix due to PG/matrix damage and attendant loss of cartilage FCD within this cadaveric model. As both the static and dynamic responses of cartilage to load are impacted by degeneration, quantification of unloaded-to-loaded T1ρ and T2 values may provide additional insight into cartilage health. Future work will evaluate unloaded-to-loaded cartilage T2* metrics to better elucidate movements of free and bound water pools.Introduction
Quantitative MRI (qMRI) is increasingly used to evaluate early biostructural changes related to the initiation and progression of osteoarthritis (OA). Typically, articular cartilage T1ρ & T2 values are prolonged in the setting of degeneration1-5. Compression of cartilage leads to extracellular matrix deformation and alterations in tissue water content that imparts changes to ion concentration and fixed charge density (FCD)6. Cartilage FCD becomes altered in the setting of OA and, has been shown to have larger impact on overall cartilage function as the collagen network degenerates6. Therefore, the purpose of this study was to utilize an MRI compatible loading device to evaluate changes in tibial cartilage thickness, T1ρ and T2 metrics between loaded and unloaded conditions. We hypothesized that differences in tibial cartilage thickness (TCT), T1ρ and T2 metrics would exist by region and compartment – within and between unloaded and loaded conditions.Methods
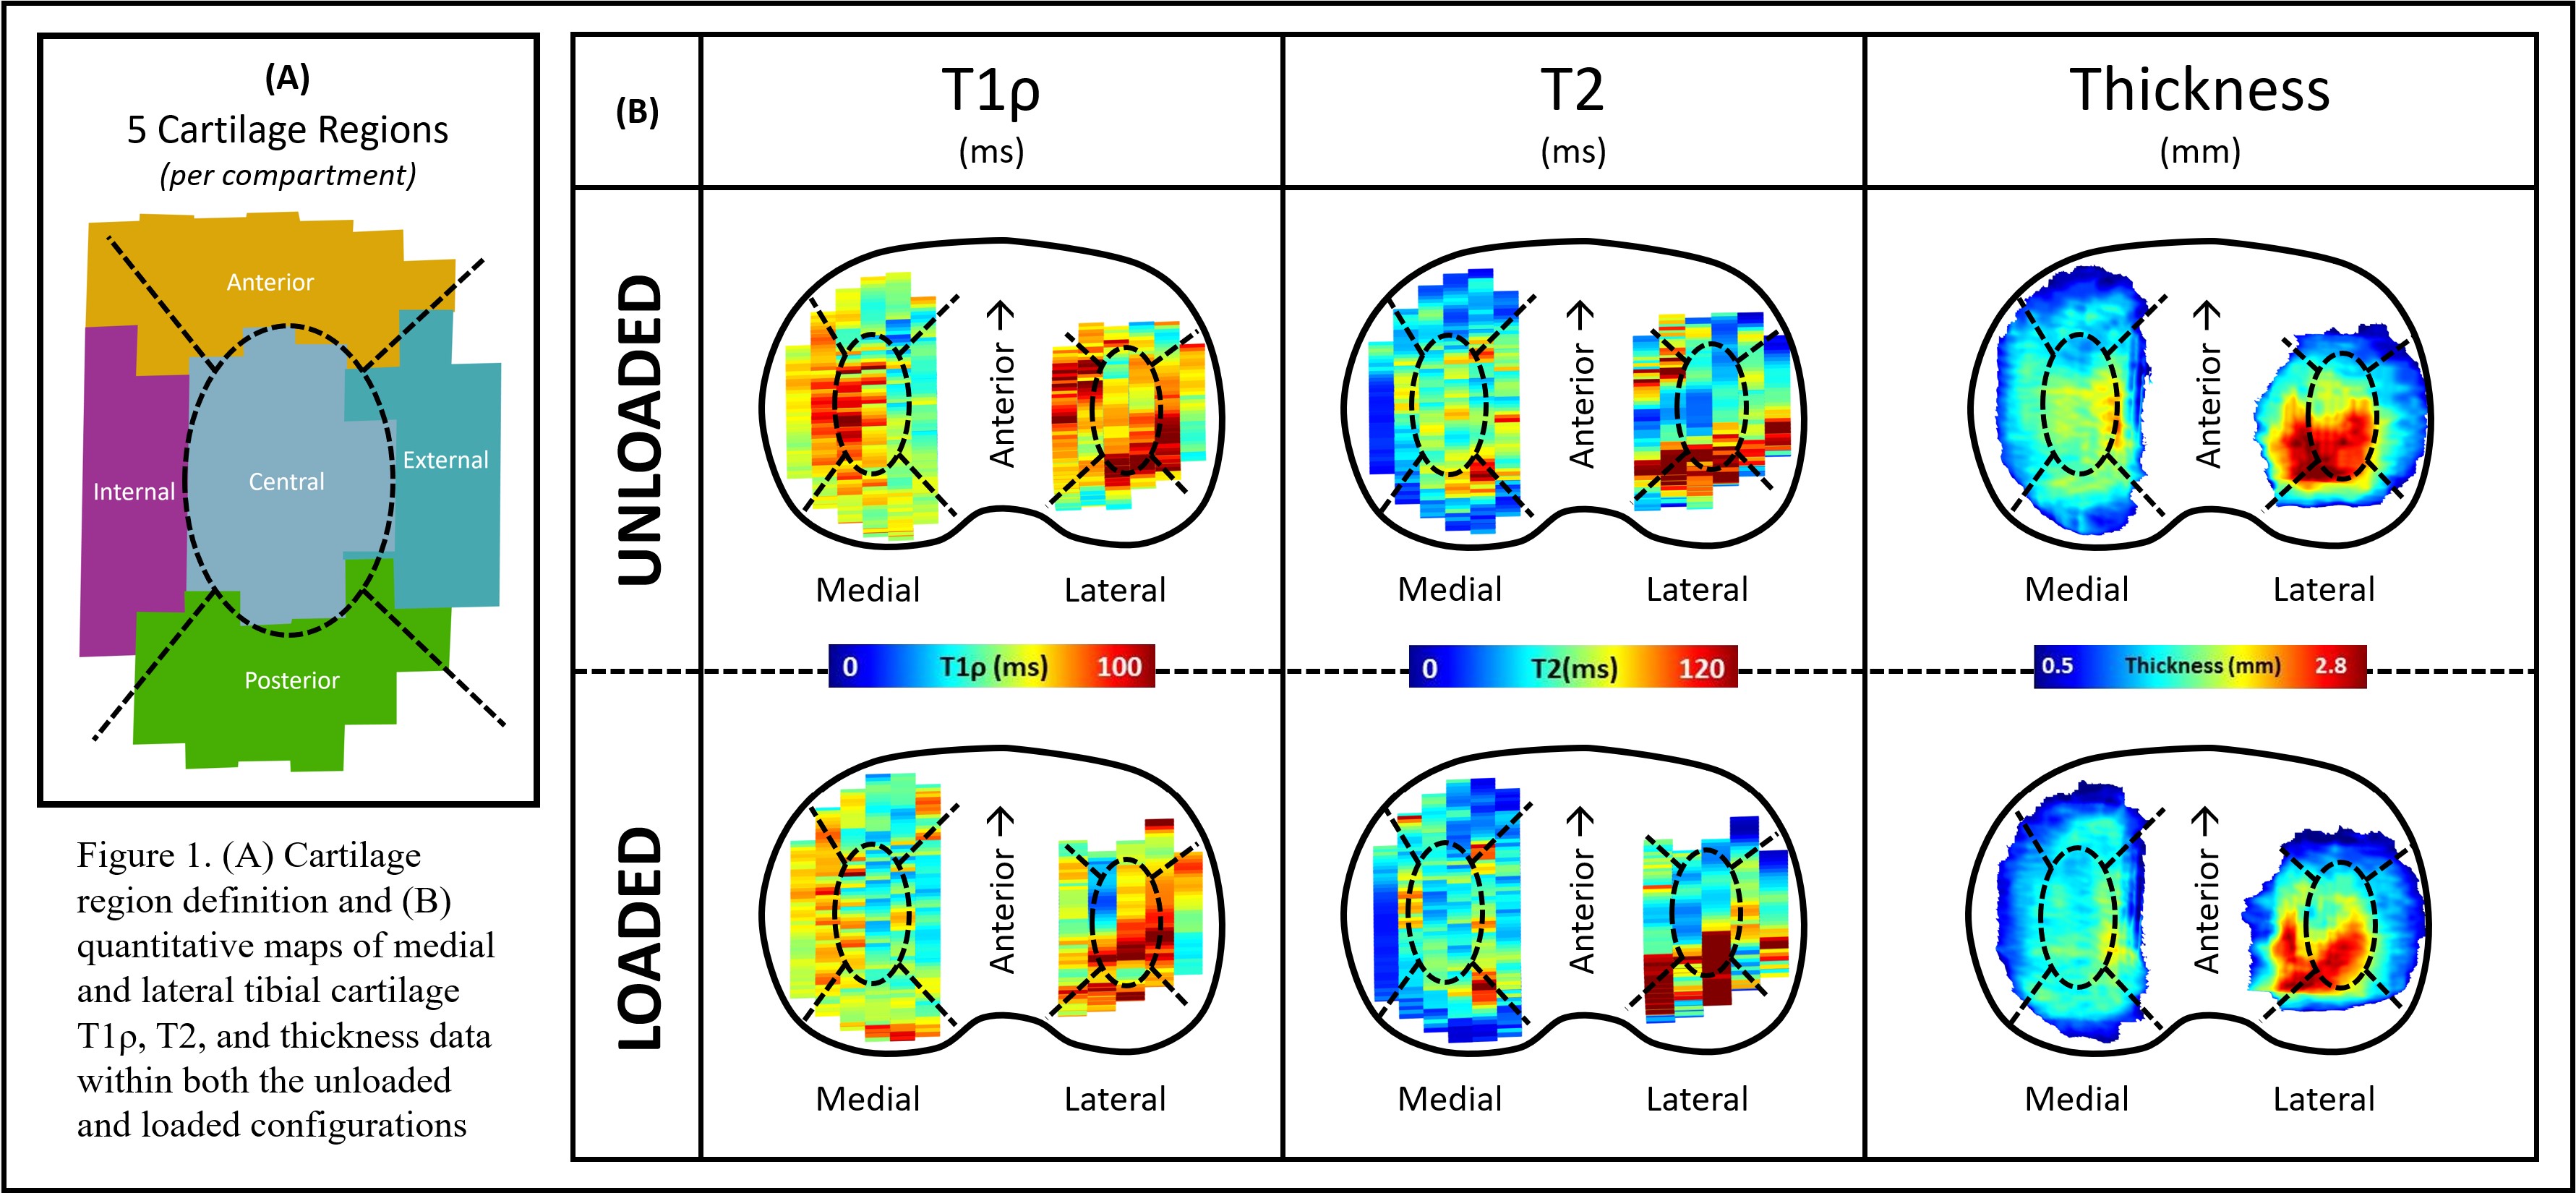
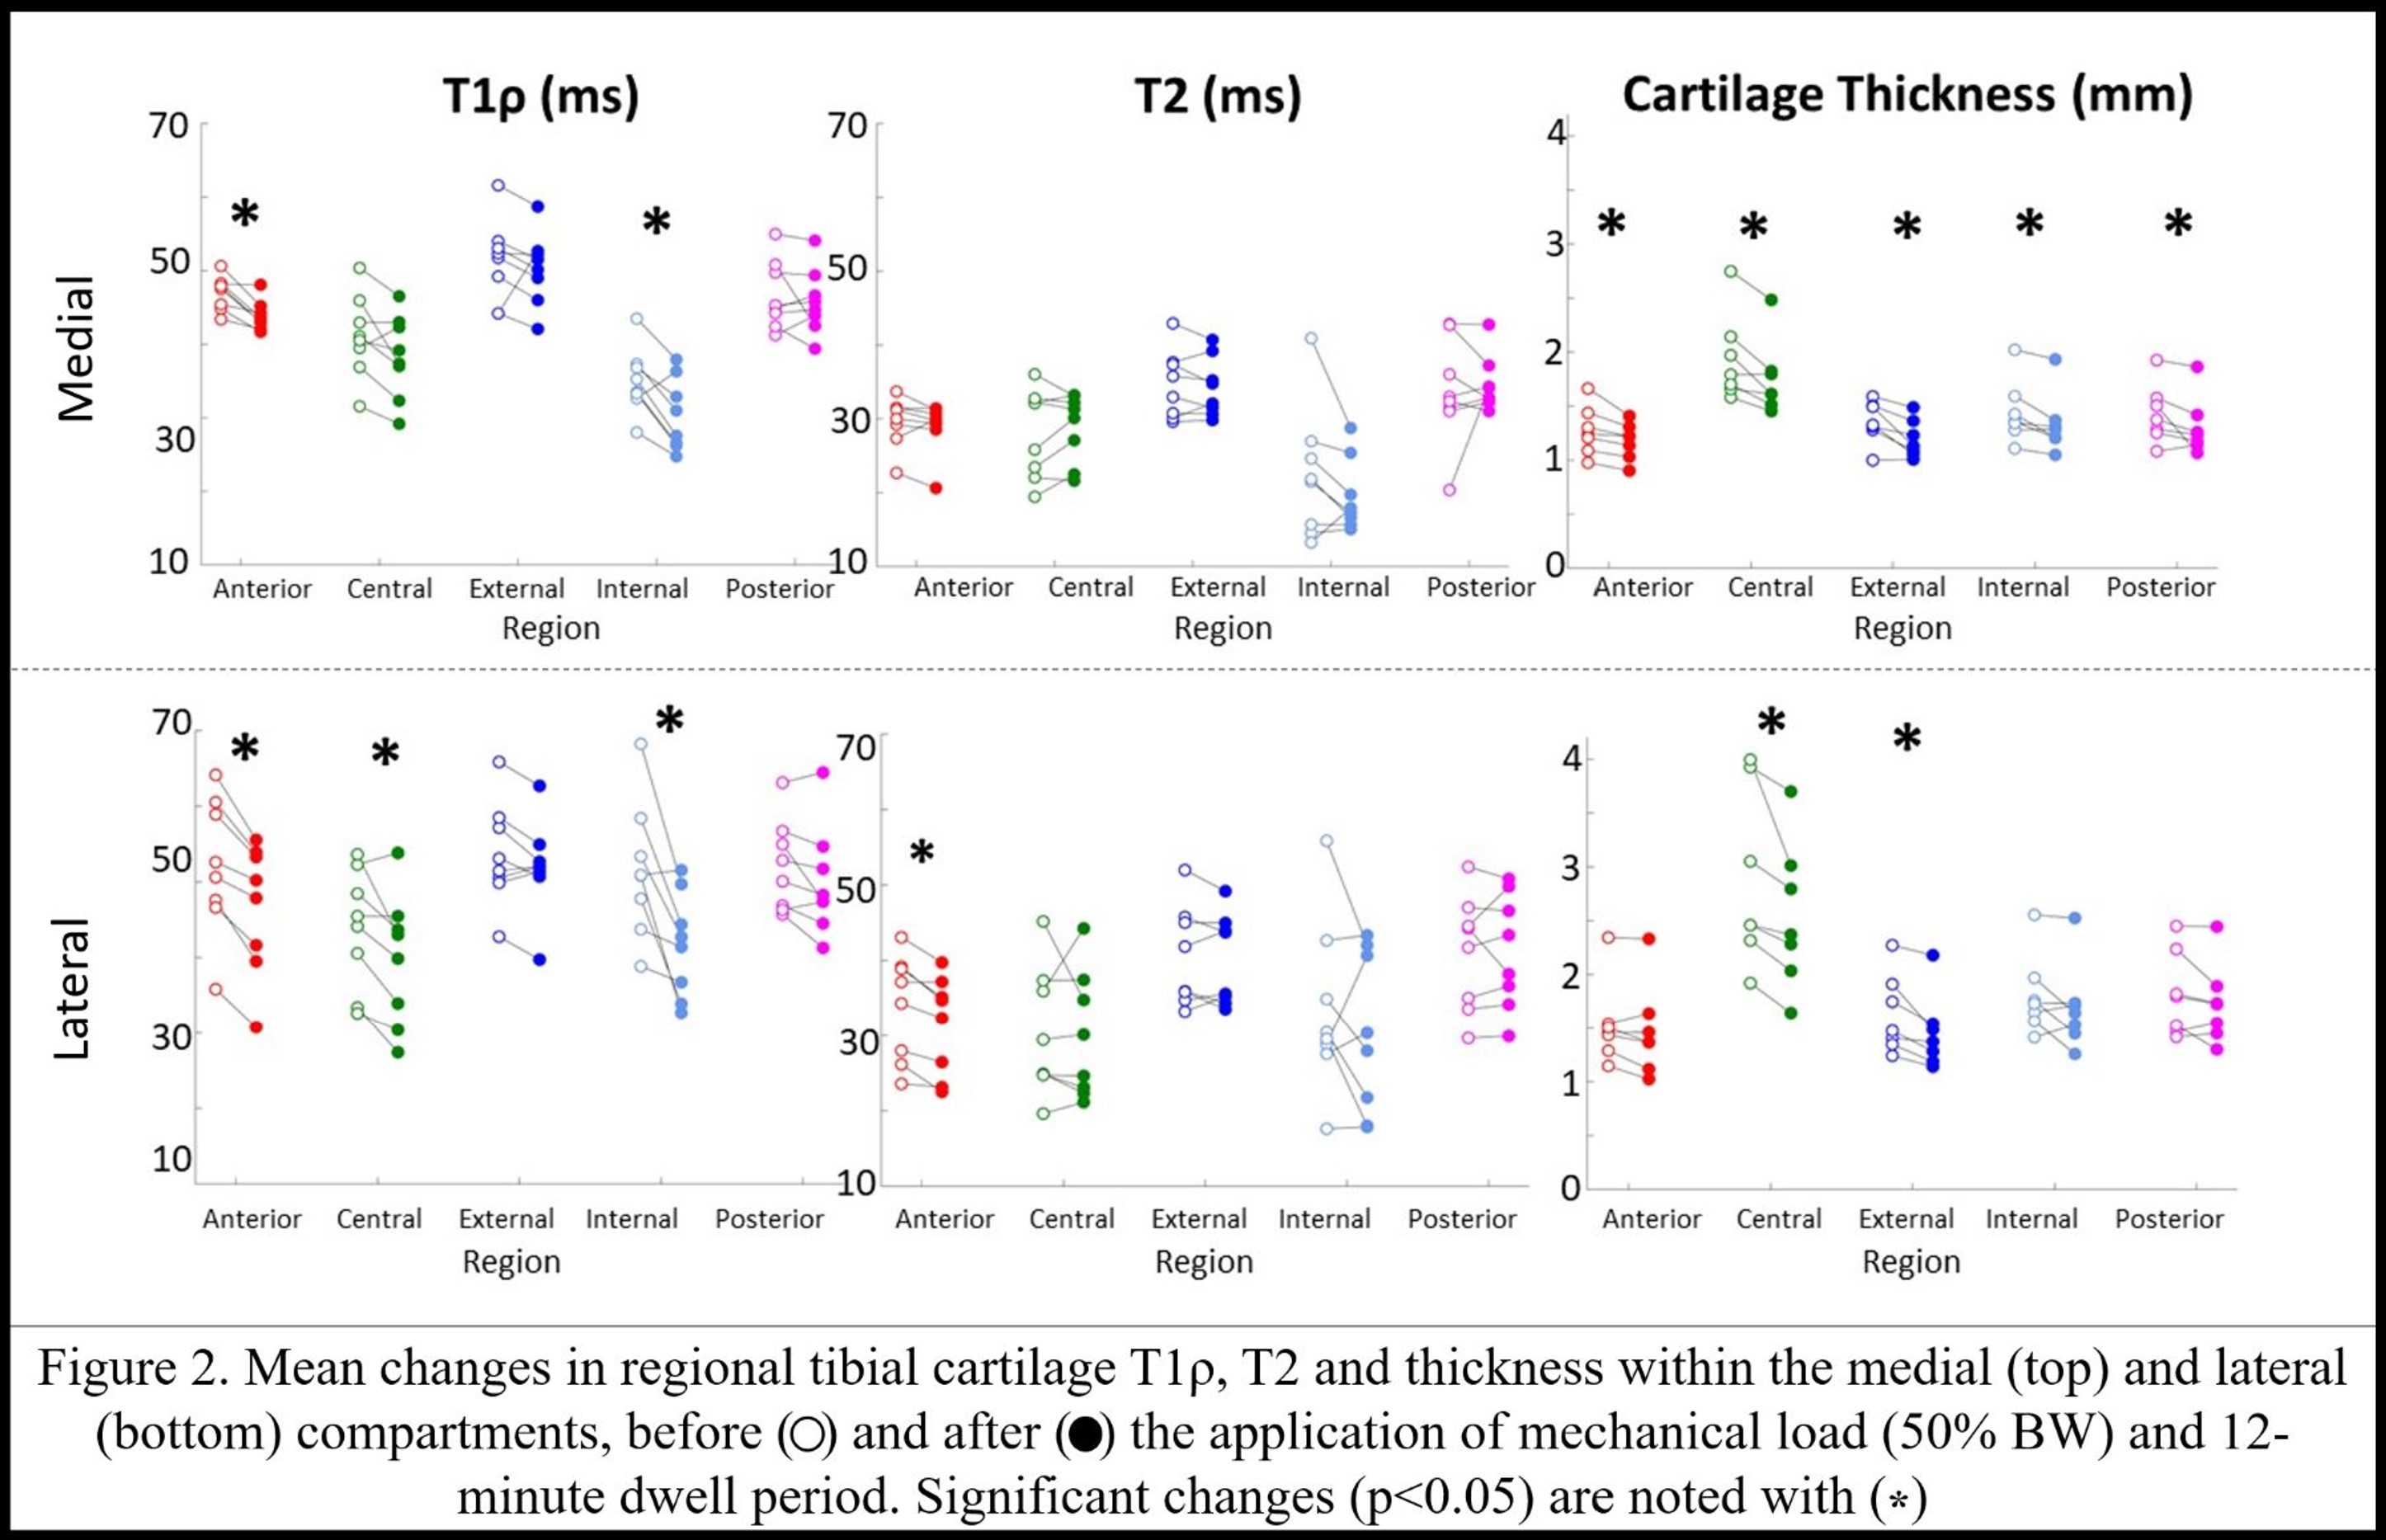
Intact cadaver knee joints (n=8) were mounted in an MRI compatible loading device equipped with a six-axis load cell7. MRI Acquisition: Imaging was performed on a clinical 3T scanner (GE Healthcare) with a 16-channel flex coil. Morphologic 3D SPGR with fat-saturation series (voxel size: 0.31x0.31x1.3mm3, TE/TR: 3.9 ms/13.6 ms) were used to derive TCT metrics. A combined T1ρ-T2 acquisition9 was utilized to assess proteoglycan content and collagen organization, respectively (voxel size: 0.58 x 0.17 x 4 mm3; Spin Lock Times:0,10,40,80ms; Echo times:0,12.9,25.7,51.4ms). Load/Unloaded MRI: Images were acquired with the joints in unloaded (first) and loaded (second) configurations. Loading consisted of applying 50% body weight to the joint, followed by 12-minute dwell period to permit tissue stress relaxation8. Identical MRI acquisition parameters were used during imaging for the unloaded and loaded configurations. Image Analysis: Medial and lateral tibial cartilages were segmented (MeVisLab) for derivation of TCT and T1ρ and T2 values. Each compartment was separated into five (Anterior[A]/Posterior[P]/Central[C]/Internal[I]/External [E]) regions relative to meniscal coverage (Fig 2.)11. Two-way repeated measures ANOVAs (SAS V9.3, Cary, NC) were used to detect changes and differences of mean T1ρ, T2, and TCT values within each compartment and region before and after the application of load. Significance was set at p<0.05.Results
Significant differences in T1ρ, T2 and TCT were present among regions and changes occurred due to joint loading. Unloaded Inter-Regional qMRI Differences: Medial Compartment: The Internal region demonstrated the shortest T1ρ and T2 values as compared to other regions (p<0.0001). Lateral Compartment: The shortest T1ρ values were found within the Central region as compared to other regions (p=0.03). Central T2 values were only significantly shorter than the Posterior and External regions (p=0.03). Loaded Inter-Regional qMRI Differences: Medial Compartment: the shortest T1ρ values were found within the Internal region, while Central region T1ρ was shorter than External, Posterior and Anterior regions (p<0.0001). Internal region T2 values were shortest, while T2 metrics within Anterior and Central regions were similar, but significantly shorter than Posterior and External regions (p<0.0001). Lateral Compartment: While T1ρ values of the Central, Internal and Anterior regions were similar, only the Central region was significantly shorter than the Posterior and External regions (p<0.0001). A similar trend was found for T2 values (p=0.0003). Cartilage thickness: Medial and lateral central cartilage regions demonstrated the thickest cartilage across all regions and loading configurations (p<0.0001). Unloaded-to-Loaded Intra-Regional Changes (Figures1&2): Medial Compartment: All regions became significantly thinner (p<0.047) following load application, and a significant reduction of T1ρ within the Anterior (Δ=-3.2ms, p=0.008) and Internal (Δ=-4.6ms, p=0.023) regions was demonstrated. No significant T2 changes were found. Lateral Compartment: Following load application, the Central and External regions became significantly thinner (p=0.016), T1ρ in the Anterior (Δ=-5.5ms, p=0.008), Internal (Δ=-9.87ms, p=0.016), and Central (Δ=-4.1ms, p=0.04) regions and T2 values in the Anterior region (Δ=-2.4ms, p=0.016) were significantly reduced.Discussion
Unloaded and loaded tibial cartilage T1ρ and T2 values and thickness (TCT) were evaluated in a region and compartment specific manner and revealed shortened qMRI metrics and decreased TCT, from the unloaded-to-loaded conditions. Shortening of loaded qMRI values is likely attributed to water loss from the cartilage matrix due to PG/matrix damage and attendant loss of the cartilage FCD within this cadaveric model. Previous work has demonstrated that tibial cartilage tissue and fibril strains follow the pattern of changes in FCD distribution – within the current study the majority of cartilage regions with significant unloaded-to-loaded decreases in cartilage thickness also exhibited significant changes in one or both qMRI metrics.6 While more regions exhibited significant changes in T1ρ as compared to T2, regional variation in both qMRI metrics decreased following the application of compressive load. Together these findings suggest that observed changes are related to water/FCD loss from cartilage under load. Additionally, variation in cartilage composition, morphology, and permeability across regions results in varied regional responses to applied load12. Our results emphasize the need to incorporate a regional analysis within each compartment as local changes may be obscured if averaging values across the entire compartment13, 14.Conclusion
As both the static and dynamic responses of cartilage to load are impacted by degeneration, quantification of unloaded-to-loaded T1ρ and T2 values may provide additional insight into cartilage health. Future work will evaluate unloaded-to-loaded cartilage T2* metrics to better elucidate the movement of free and bound water pools.Acknowledgements
Research reported in this abstract was supported by NIH/NIAMS under award number R01AR06663 and The Russell Warren Chair in Tissue Engineering. We also thank Sara Sacher for her assistance in generating figures.References
1.Regatte et al., 2006 JMRI; 2.Souza et al., 2014 OA&C; 3.Li et al., 2009 MRM; 4.Li et al., 2015 OA&C; 5.Schooler et al., 2014 OA&C; 6.Räsänen et al., 2017 J Biomech; 7.Maher et al., 2017 JOR; 8.Wang et al., 2015 J Biomech; 9.Li et al., 2014 JMRI; 11.Wirth et al., 2008 IEEE TMI; 12.Potter et al., 2012 AJSM; 13.Cotofana et al., 2011 Eur Radiol; 14.Argentieri et al., 2014 OA&CFigures
DOI: https://doi.org/10.58530/2023/1110