1109
Bariatric Surgery Effects on Knee Articular Cartilage and Osteoarthritis Symptoms – a 12-month Follow-up Using T2 Relaxation Time and WOMAC Index1Research Unit of Health Science and Technology, University of Oulu, Oulu, Finland, 2Medical Research Center, University of Oulu and Oulu University Hospital, Oulu, Finland, 3Department of Diagnostic Radiology, Oulu University Hospital, Oulu, Finland, 4Research Service Unit, Oulu University Hospital, Oulu, Finland, 5Center for Life Course Health Research, University of Oulu, Oulu, Finland, 6Finnish Institute of Occupational Health, Oulu, Finland, 7Department of Surgery, Oulu University Hospital, Oulu, Finland, 8Department of Physical Medicine and Rehabilitation, Oulu University Hospital, Oulu, Finland, 9Research Unit of Translational Medicine, University of Oulu, Oulu, Finland
Synopsis
Keywords: Cartilage, Osteoarthritis
Obesity is a common risk factor for osteoarthritis (OA). We set out to study knee cartilage using T2 relaxation time, and knee OA symptoms with WOMAC OA index in obese individuals. Bariatric surgery patients were split into successful and unsuccessful weight loss groups, and compared with a control group of obese individuals over a 12-month follow-up. The lesser weight loss group displayed improvement of cartilage with lower T2 values in the lateral compartment of femoral cartilage, compared to the higher weight loss. We also observed improvement of knee symptoms in both successful and unsuccessful weight loss groups after 12 months.Introduction
Obesity is a common risk factor for osteoarthritis (OA)1. The most effective treatment for morbid obesity is bariatric surgery2. Weight loss has displayed great benefits to OA3.We set out to study knee osteoarthritis symptoms and articular cartilage in obese patients using T2 relaxation time, which is an established quantitative MRI parameter known to correlate with cartilage structure and mechanical properties4, and Western Ontario and McMaster Universities (WOMAC) OA index5. Our aim was to study the effects of Roux-en-Y gastric bypass operation6 on T2 relaxation time and WOMAC OA index of obese patients over a 12-month follow-up.
Methods
Forty-four obese patients (37 females (84%), mean age 50±7 years, mean BMI 42.3±6.5 kg/m2) undergoing Roux-en-Y gastric bypass operation were enrolled and divided into two groups based on the total weight loss (TWL) over our 12-month follow-up: successful weight loss (≥20% TWL), and unsuccessful weight loss (<20% TWL)7. An additional 46 patients (38 females (83%)) treated with conservative weight reduction regimens served as an age- and BMI- matched control group.All the patients underwent imaging of knee joint with a 3.0 T MRI unit (Skyra, Siemens Healthcare, Erlangen, Germany) using an 18-channel body matrix coil and a 32-channel spine coil. Sagittal 2D T2 mapping was acquired using a MESE sequence (TR=1680ms; TEs=13.8, 27.6, 41.4, 55.2, 69ms; FOV=160x160mm2; matrix=256x256; resolution=0.62x0.62x3.00mm3; 18 slices). Each patient was scanned prior to surgery and 12 months post-operatively.
T2 relaxation time maps were calculated pixel-wise using monoexponential model fitting. Mean T2 values were obtained by manually segmenting sagittal T2 maps of knee joint. Cartilage of central (c) femur (F) and tibia (T) of medial (M) and lateral (L) compartments were chosen to represent weight bearing regions of the knee joint (Figure 1). WOMAC questionnaire5 was administered to all participants to assess OA symptoms.
Repeated measures analysis of variance was performed to evaluate the effect of gastric bypass surgery on the T2 relaxation times of knee cartilage and WOMAC indexes. Values were compared between the three groups. Analysis of T2 times was performed for each cartilage region on bulk (b, full-thickness), deep (d, 50% lower half) and superficial (s, 50% upper half) partitions of the cartilage.
Results
Successful weight loss (≥20% TWL) was achieved among 26 (58%) of the 45 intervention patients. Significant difference in change of mean BMI was detected between all three groups at 12 months (Table 1).The difference in change of T2 relaxation time was found to be significant in bcFL and dcFL regions at 12 months (Table 2, Figures 2-3), as <20% TWL group displayed a higher rate of reduction to the T2 values compared to ≥20% TWL group. dcTM region displayed significantly higher values in <20% TWL group compared to the control group at 12 months.
At 12 months, both <20% TWL and ≥20% TWL groups displayed significant pain reduction compared to the control group. ≥20% TWL group also displayed significantly improved function and reduced stiffness compared to the control group (Table 1). Differences between <20% TWL and control group were not observed to be significant (p=0.063 for stiffness, p=0.051 for function).
Discussion
No clinically significant changes in cartilage quality were observed between the three groups using T2 relaxation time. However, we observed an unexpected decrease of T2 relaxation time in <20% TWL group compared to ≥20% TWL group in lateral femur, suggesting improved cartilage quality8. Possibly the larger weight loss with improvement of symptoms has increased the amount of exercise, resulting in alternated mechanical stimulus and biochemical activity of the chondrocytes9, which could have increased cartilage degeneration in the larger weight loss group. Bariatric surgery also affects patient walking patterns10, which could result in a better biomechanical relief on lateral knee compartment in the <20% TWL group. This hypothesis is supported by findings on the medial compartment, where <20% TWL group displays the highest increase in T2 time, suggesting a shift of mechanical stress from lateral to medial compartment. We also know that the nutrition of patients with successful or unsuccessful weight loss can be very different12, which could also affect metabolism of the cartilage. It could also be that the follow-up of 12 months is a too short period to observe any significant changes in the cartilage.We observed significant changes in WOMAC OA indexes 12 months after bariatric surgery. All measured symptoms were significantly reduced in ≥20% TWL group compared to the control group. Similarly, pain intensity was significantly reduced, and stiffness and physical function suggested improvement in <20% TWL group compared to the control group. Thus, even though <20% TWL is classified as an unsuccessful result in terms of bariatric surgery7, it still provides improvement of knee symptoms, although not as significant as ≥20% TWL.
Conclusion
Cartilage extracellular matrix composition, measured by T2 relaxation time, displayed improvement on lateral femoral cartilage with unsuccessful weight loss, though the clinical significance of this is not clear. Successful weight loss with gastric bypass surgery provides significant improvement on knee symptoms, compared to conservative weight reduction, at 12 months. Unsuccessful weight loss with bariatric surgery also improves knee symptoms, though not as significantly. We will conduct a follow-up at 3- and 5-year time points in the future.Acknowledgements
We thank Pertti Siira, Anne Kukkonen and Esa Liukkonen for their help with data collection.References
1. Pottie P, Presle N, Terlain B, Netter P, Mainard D, Berenbaum F. Obesity and osteoarthritis: more complex than predicted! Ann Rheum Dis. 2006;65(11):1403-1405. doi:10.1136/ARD.2006.061994
2. Buchwald H, Owen H, Wangensteen SD, et al. Consensus conference statement bariatric surgery for morbid obesity: health implications for patients, health professionals, and third-party payers. Surg Obes Relat Dis. 2005;1(3):371-381. doi:10.1016/J.SOARD.2005.04.002
3. Vincent HK, Heywood K, Connelly J, Hurley RW. Obesity and weight loss in the treatment and prevention of osteoarthritis. PM R. 2012;4(5 Suppl). doi:10.1016/J.PMRJ.2012.01.005
4. Nissi MJ, Töyräs J, Laasanen MS, et al. Proteoglycan and collagen sensitive MRI evaluation of normal and degenerated articular cartilage. Journal of Orthopaedic Research. 2004;22(3):557-564. doi:10.1016/j.orthres.2003.09.008
5. McConnell S, Kolopack P, Davis AM. The Western Ontario and McMaster Universities Osteoarthritis Index (WOMAC): a review of its utility and measurement properties. Arthritis Rheum. 2001;45(5):453-461. doi:10.1002/1529-0131(200110)45:5<453::aid-art365>3.0.co;2-w
6. Buchwald H, Avidor Y, Braunwald E, et al. Bariatric surgery: a systematic review and meta-analysis. JAMA. 2004;292(14):1724-1737. doi:10.1001/JAMA.292.14.1724
7. Corcelles R, Boules M, Froylich D, et al. Total Weight Loss as the Outcome Measure of Choice After Roux-en-Y Gastric Bypass. Obes Surg. 2016;26(8):1794-1798. doi:10.1007/S11695-015-2022-Y
8. Li X, Pai A, Blumenkrantz G, et al. Spatial distribution and relationship of T1rho and T2 relaxation times in knee cartilage with osteoarthritis. Magn Reson Med. 2009;61(6):1310-1318. doi:10.1002/MRM.21877
9. Eckstein F, Hudelmaier M, Putz R. The effects of exercise on human articular cartilage. J Anat. 2006;208(4):491-512. doi:10.1111/J.1469-7580.2006.00546.X
10. Vartiainen P, Bragge T, Lyytinen T, Hakkarainen M, Karjalainen PA, Arokoski JP. Kinematic and kinetic changes in obese gait in bariatric surgery-induced weight loss. J Biomech. 2012;45(10):1769-1774. doi:10.1016/J.JBIOMECH.2012.05.002
11. Richette P, Poitou C, Garnero P, et al. Benefits of massive weight loss on symptoms, systemic inflammation and cartilage turnover in obese patients with knee osteoarthritis. Ann Rheum Dis. 2011;70(1):139-144. doi:10.1136/ARD.2010.134015
12. Ostad AN, Barghchi H, Jangjoo A, et al. Macro- and Micro-nutrient Intake Adequacy in Gastric Bypass Patients after 24 Months: a Cross-sectional Study. Clin Nutr Res. 2021;10(4):341-352. doi:10.7762/CNR.2021.10.4.341
Figures
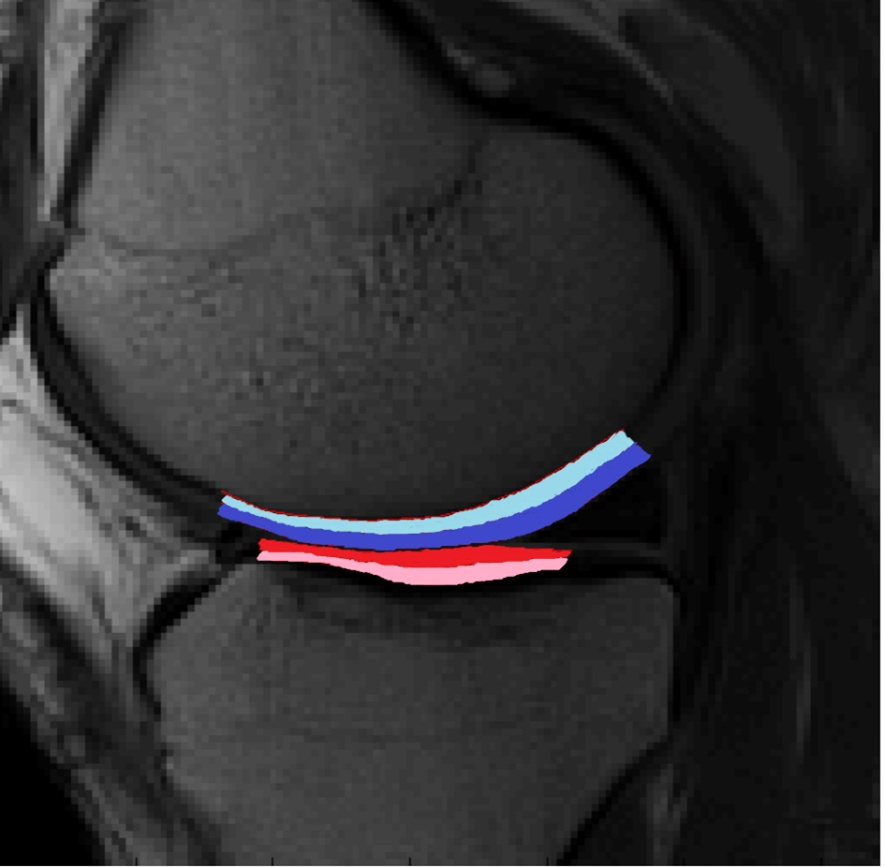
Figure 1. Sagittal T2-weighted image of tibiofemoral joint of a 57-year-old male from the intervention group. Studied regions of interest are presented with colors: central femur (blue), central tibia (red). Lighter color indicates deep (d) and darker color superficial (s) cartilage. Bulk (b) cartilage contains both superficial and deep component.
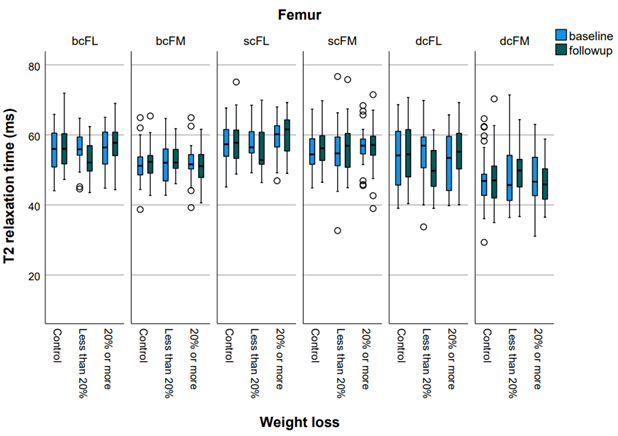
Figure 2. T2 relaxation times presented as boxplots for each region of interest and each studied group on femoral cartilage. Baseline and follow-up values are presented by blue and green color, respectively. b=bulk, s=superficial, d=deep, c=central, F=femoral, M=medial, L=lateral.
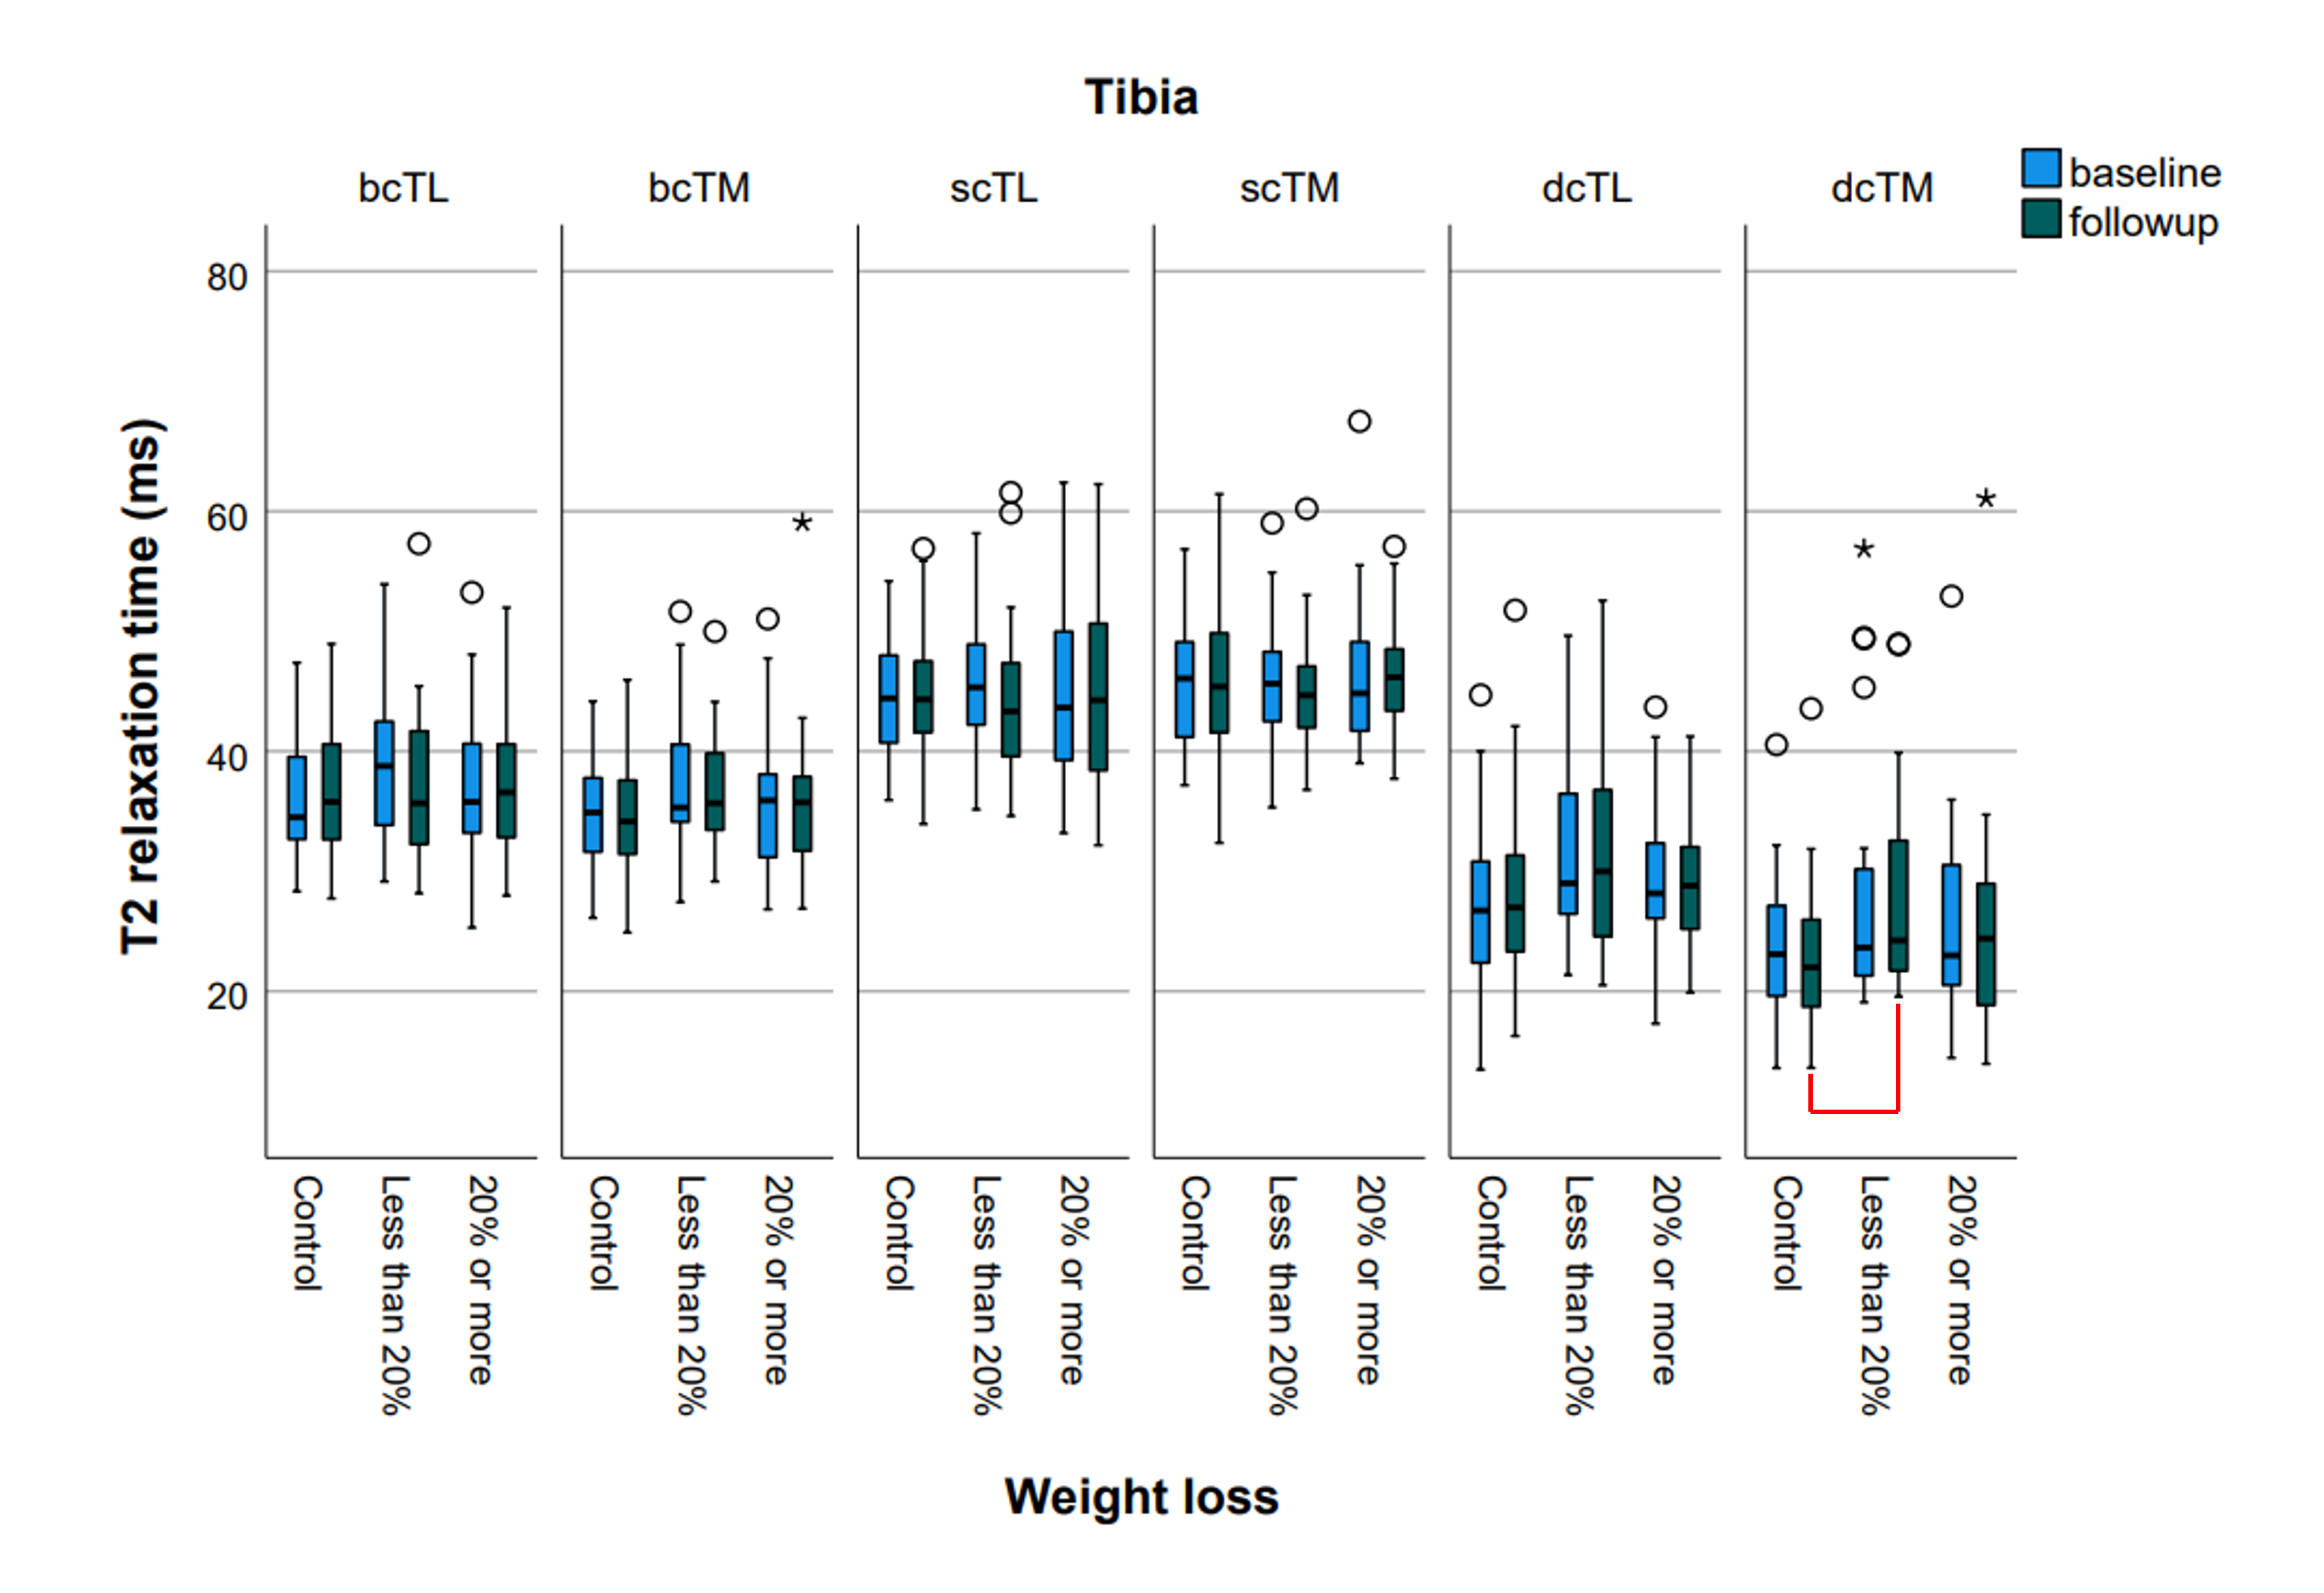
Figure 3. T2 relaxation times presented as boxplots for each region of interest and each studied group on tibial cartilage. Baseline and follow-up values are presented by blue and green color, respectively. Significant differences are marked with red color. b=bulk, s=superficial, d=deep, c=central, F=femoral, M=medial, L=lateral.
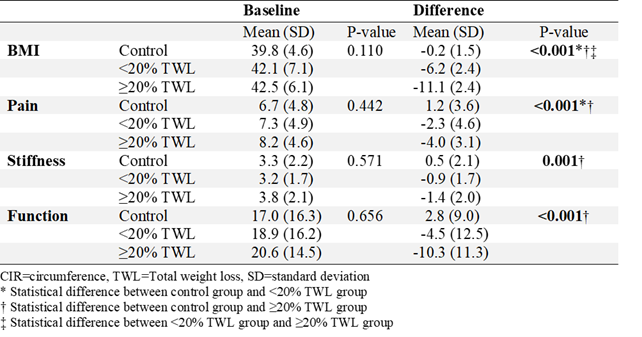
Table 1. Body mass index (BMI) and WOMAC indexes presented as means with standard deviations (SD) separately for the control group, unsuccessful intervention group (<20% TWL), and successful intervention group (≥20% TWL). Difference indicates the change of the respective parameter in the respective study group after 12 months. P-values are presented for the differences of the baseline values, and the change over 12 months. P < 0.05 indicates statistical significance.
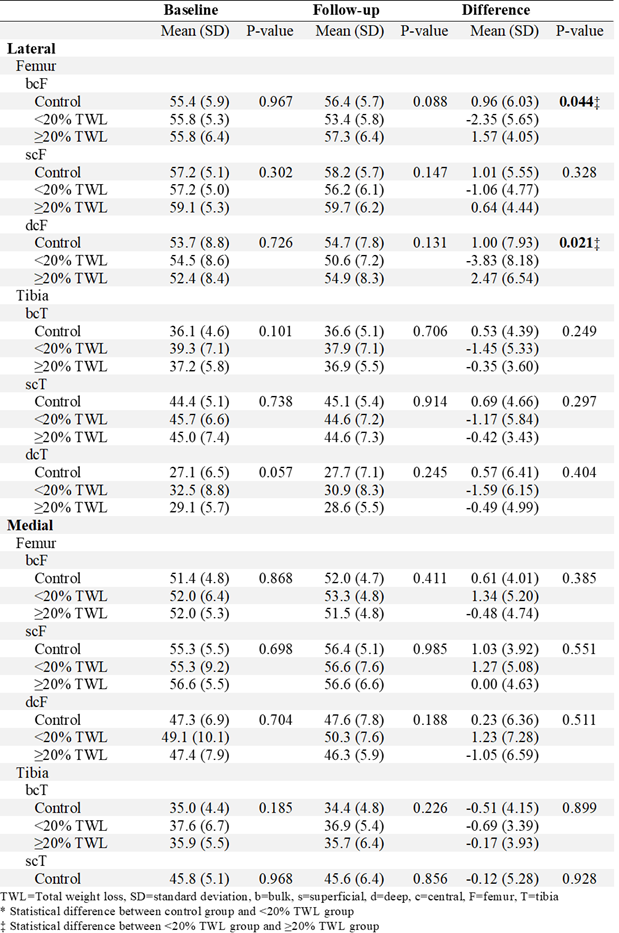
Table 2. Mean T2 relaxation times with standard deviations (SD) presented separately for the control group, unsuccessful intervention group (<20% TWL), and successful intervention group (≥20% TWL) in each region of interest (ROI). Difference indicates the change of T2 relaxation time in the respective study group after 12 months. P-values are presented for the differences of the baseline values, follow-up values, and the change over 12 months. P < 0.05 indicates statistical significance.