1107
Validation of Constrained qBOLD-Based 3D CMRO2 Mapping With Repeatability Test and Hypercapnic Challenge1School of Electronics Engineering, Kyungpook National University, Daegu, Korea, Republic of, 2Department of Radiology, University of Pennsylvania, Philadelphia, PA, United States
Synopsis
Keywords: Quantitative Imaging, Metabolism
In the original qBOLD, it is challenging to separate deoxyhemoglobin’s contribution to R2' from other sources modulating the voxel signal. Further, extracting DBV and Yv from measured R2' is a nontrivial task. It was recently shown that the constrained qBOLD method was able to properly separate the several confounding factors, yielding the expected contrast for both Yv and DBV maps across the entire brain, and, together with a separate measurement of CBF, leading to whole-brain 3D CMRO2 maps within physiologically plausible ranges. Here, we validated the new 3D qBOLD method with respect to repeatability and hypercapnic gas breathing challenges.Introduction
Quantitative BOLD (qBOLD)1,2 allows evaluation of oxidative metabolism of the brain in the resting-state by quantifying deoxygenated blood volume (DBV) and hemoglobin oxygen saturation level of venous blood (Yv), based on measurements of RF-reversible transverse relaxation rate constant R2′. However, it is challenging in the original qBOLD to separate deoxyhemoglobin’s contribution to R2′ from other sources modulating the voxel signal, for instance, R2, R2′ from non-heme iron (R2,nh′), and macroscopic magnetic field inhomogeneities (ΔB0). Furthermore, the qBOLD model is highly sensitive to noise, resulting in unstable estimation of DBV and Yv, even with an accurate measurement of the heme-originated R2′ (R2,h′)3. To address these issues, we had previously introduced a prior-constrained qBOLD method4 in which a plurality of preliminary parametric maps (R2, R2′, ΔB0, voxel susceptibility (Δχ), and cerebral venous blood volume (CBVv)) are constrained in the qBOLD model. In that work it was shown that the method was able to properly separate the above-mentioned confounders, yielding the expected contrast for both Yv and DBV maps across the entire brain5, and, together with a separate measurement of cerebral blood flow (CBF), leading to whole-brain 3D cerebral metabolic rate of oxygen (CMRO2) maps within physiologically plausible ranges4. The purpose of the present work was to validate the new 3D qBOLD method with respect to repeatability and hypercapnic gas breathing challenges.Methods
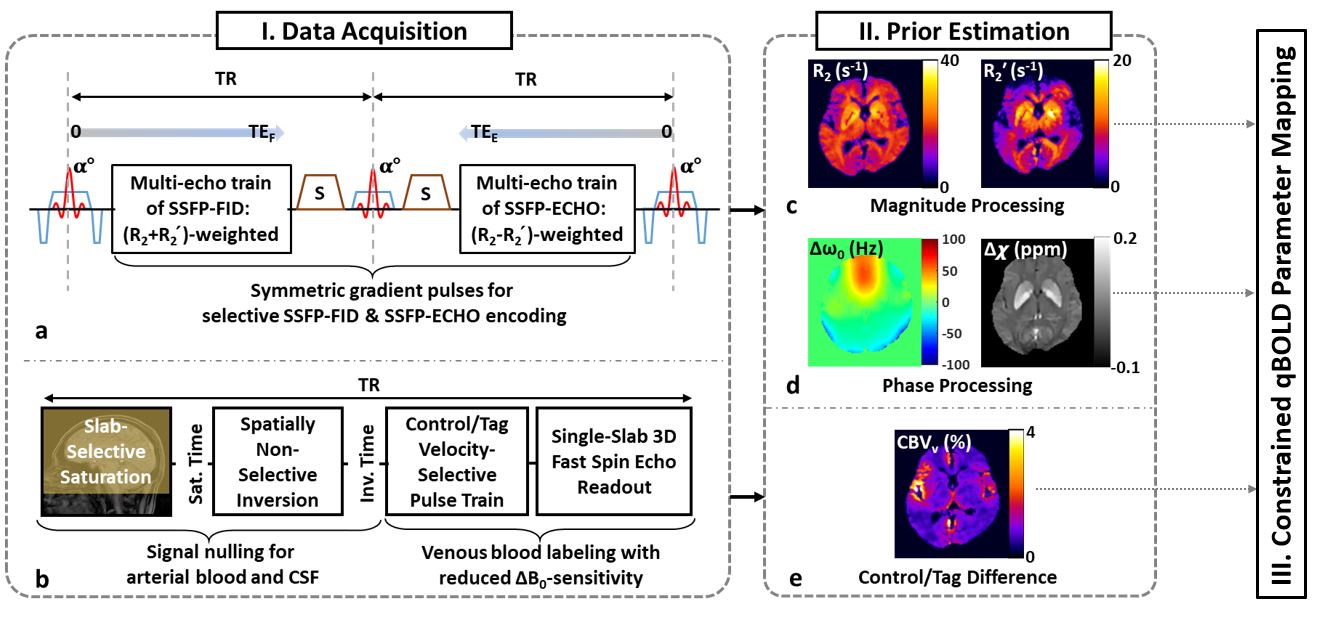
Summary of constrained qBOLD: The qBOLD protocol in this study consists of two in-house developed pulse sequences: alternating unbalanced SSFP-FID and SSFP-ECHO (AUSFIDE)5 (Fig. 1a) and velocity-selective venous-spin-labeling (VS-VSL)6 (Fig. 1b), yielding voxelwise maps of 3D R2, R2′, ΔB0, Δχ (Figs. 1c, 1d) and a volumetric map of CBVv (Fig. 1e), respectively. In the qBOLD processing step, the AUSIFDE-derived parameters serve as prior information in solving the following constrained optimization problem:$$\arg min_{\mathbf{\Theta}}\sum_{TE}|\mathbf{y}(TE)-\Xi (\mathbf{\Theta},TE))|^{2}+w|\Delta \chi -\Psi (\mathbf{\Theta})|^{2}+p|{{R_{2}}'}-\Upsilon (\mathbf{\Theta})|^{2}$$ [1]
where Θ={Yv,DBV,R2′,χnb} is the set of unknown parameters (χnb: non-blood susceptibility). Definitions for the models, Ξ, Ψ, and Γ, along with sub-parameters therein are provided in Reference 4. In solving Eq. (1), VS-VSL-derived CBVv maps were used to initialize and guide the solution of DBV. The regularization parameters w and p were empirically determined.
Given the estimates of Yv across the entire brain, oxygen extraction fraction (OEF) was computed by OEF = 1-Yv/Ya with Ya = 0.98 (arterial blood oxygen saturation) assumed. Finally, 3D pseudo-continuous arterial spin labeling (pCASL) with stack-of-spirals readout7 was employed for CBF mapping, leading to the derivation of CMRO2 by: CMRO2=Ca·CBF·Ya·OEF where Ca is the oxygen carrying capacity of arterial blood, obtained by scaling a hematocrit level.
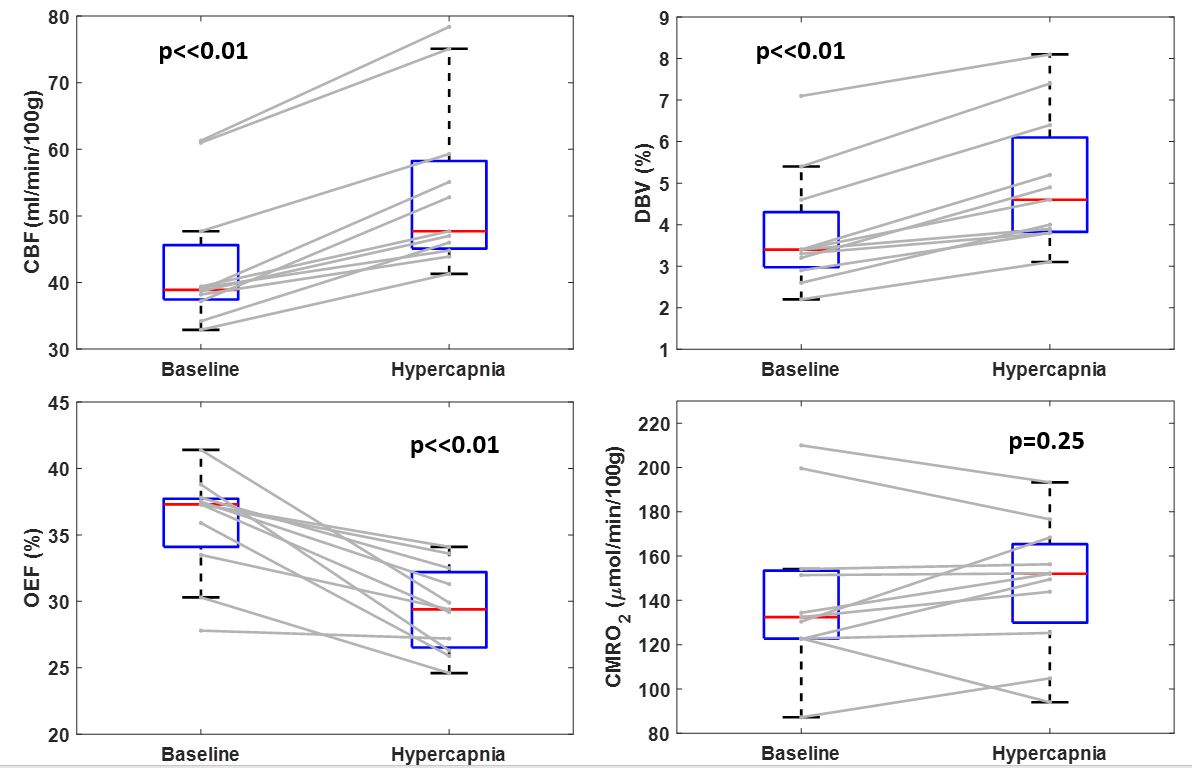
Experiments & analyses: All experiments were performed at 3T (Siemens Prisma). To evaluate the present method’s reproducibility, data were collected twice in seven healthy volunteers using the three pulse sequences (AUSFIDE, VS-VSL, and pCASL). In all study subjects, the second scans took place within two weeks apart from the first one. Additionally, high-resolution T1-weighted images were also acquired for brain segmentation. See Reference 4 for imaging parameters and data processing details. Both DBV and OEF maps in a representative subject were presented for the two scans. Furthermore, the interscan agreement of the two parameters in gray-matter (GM) was evaluated using box plots and paired t-tests. The same protocol was also applied in 11 healthy participants under baseline and hypercapnic states, respectively, for further validation of the technique. Here, the RespirAct system (Thornhill Research) was used to target +8 mmHg of end-tidal partial pressure of CO2 from baseline (equivalent to about 6% inspired CO2). Following data processing, whole-brain 3D maps of CBF, DBV, OEF, and CMRO2 were obtained in a representative subject at baseline and hypercapnia. Thereafter, GM averages of the four parameters across the 11 study subjects were compared between the two states using paired t-tests.
Results
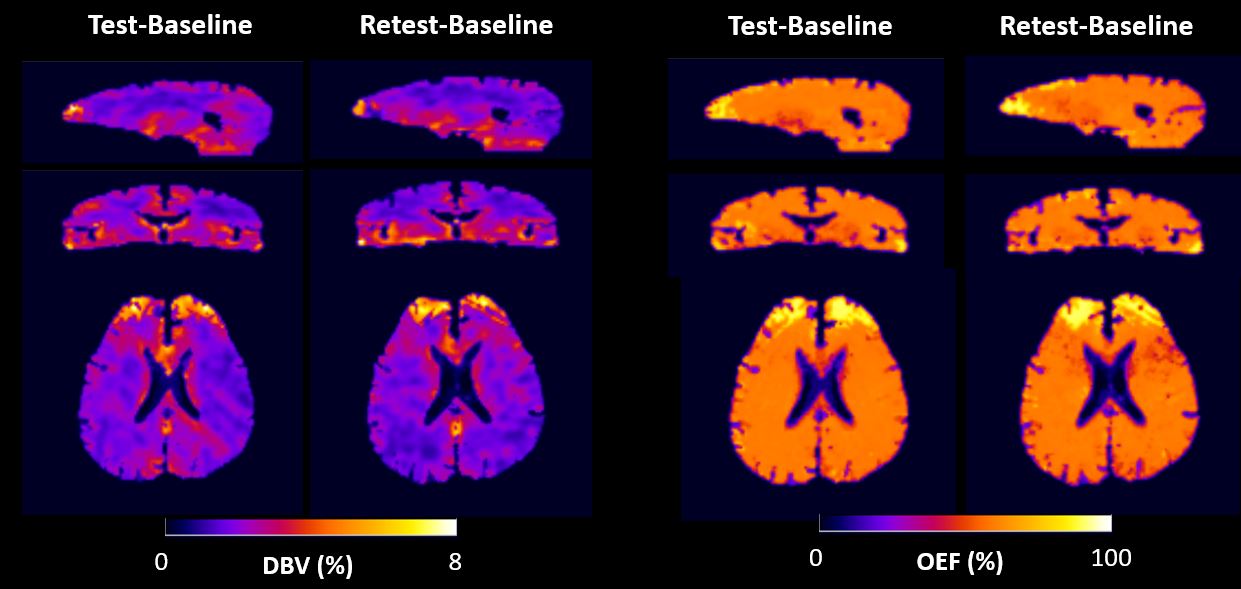
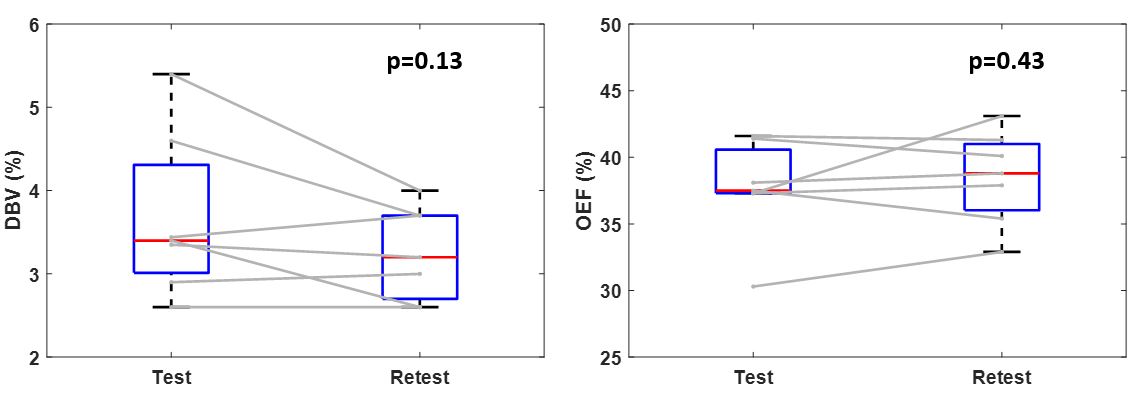
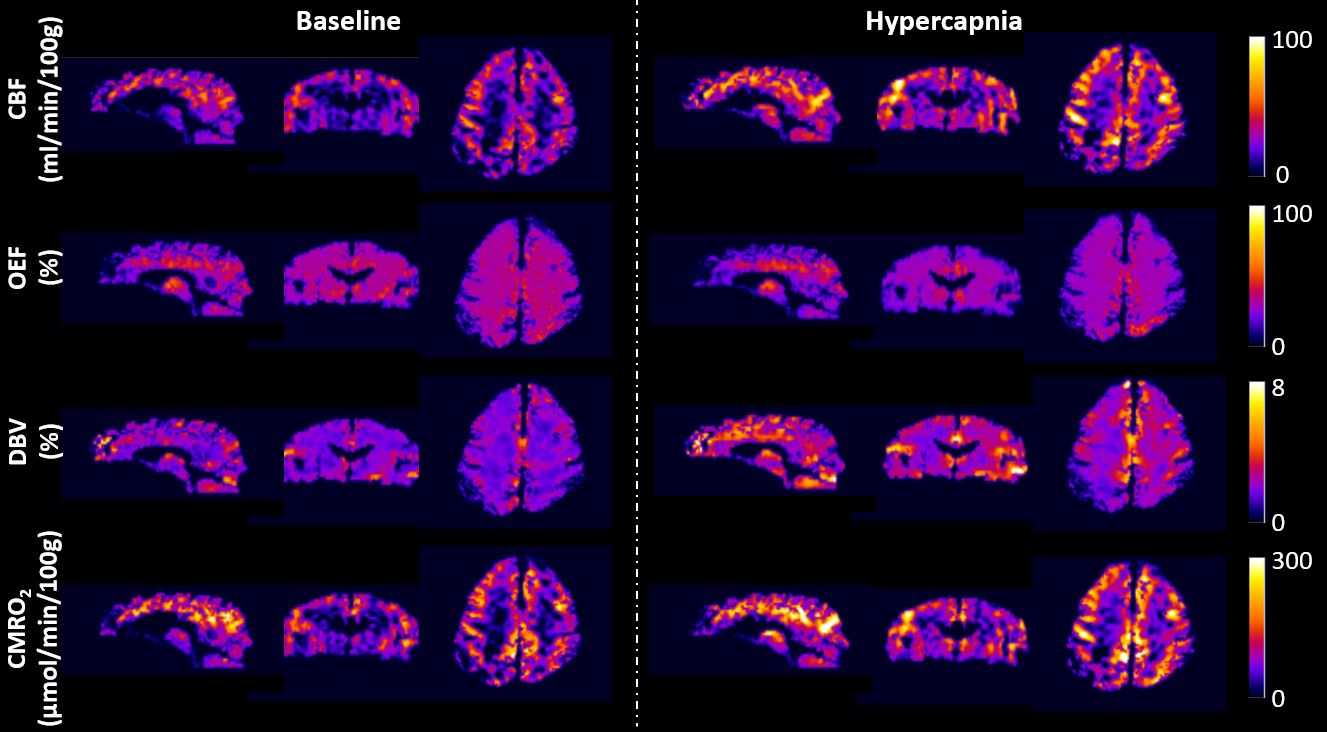
Figure 2 displays test/retest whole-brain 3D maps of DBV and OEF in the three orthogonal planes in a study subject. In both scans, DBV images highlight the expected gray/white matter contrast while OEF values are largely invariable across the entire brain, being consistent with the results in our previous study4. Figure 3 shows box plots of GM averages of DBV and OEF in the seven subjects. Paired t-test suggests that the test-retest difference in both DBV and OEF quantifications is not statistically significant.Figure 4 shows parametric maps of CBF, DBV, OEF and CMRO2 reformatted into the three orthogonal planes, obtained in a subject breathing normoxic/normocapnic and hypercapnic gas mixtures. Box plots of GM averages of the four parameters in the two states are shown in Fig. 5. Statistical comparisons reveal that the hypercapnia-induced increases of both CBF and DBV and decrease of OEF were all significant, whereas the CMRO2 changes due to the hypercapnic stimulus were nonsignificant.
Discussion and Conclusions
We evaluated the performance of the constrained qBOLD based oximetric technique by examining its repeatability and detectability on physiologic changes resulting from external stimuli. Results suggest that the method yields the expected contrast across the brain regions (GM vs. WM), across the measurement times (test vs. retest), and further across the brain states (baseline vs. hypercapnia), albeit so far in healthy subjects. Clinical validation in patients with neurovascular disease, for example, arterial steno-occlusive disease is forthcoming.Acknowledgements
NIH grants P41-EB029460 and R21-EB031364, and NRF Korea grant 2021R1F1A1045621References
1. An HY, Lin WL. Quantitative measurements of cerebral blood oxygen saturation using magnetic resonance imaging. J Cereb Blood Flow Metab 2000; 20:1225-1236.
2. He X, Yablonskiy DA. Quantitative BOLD: mapping of human cerebral deoxygenated blood volume and oxygen extraction fraction: default state. Magn Reson Med. 2007;57:115-126.
3. Lee H, Englund EK, Wehrli FW. Interleaved quantitative BOLD: Combining extravascular R2’- and intravascular R2-measurements for estimation of deoxygenated blood volume and hemoglobin oxygen saturation. NeuroImage. 2018;174:420-431.
4. Lee H, Wehrli FW. Whole-brain 3D mapping of oxygen metabolism using constrained quantitative BOLD. NeuroImage 2022;250:118952.
5. Lee H, Wehrli FW. Alternating unbalanced SSFP for 3D R2’ mapping of the human brain. Magn Reson Med. 2021;85:2391-2402.
6. Lee H, Wehrli FW. Venous cerebral blood volume mapping in the whole brain using venous-spin-labeled 3D turbo spin echo. Magn Reson Med. 2020;84:1991-2003.
7. Vidorreta, M., Wang, Z., Rodríguez, I., Pastor, M.A., Detre, J.A., Fernández-Seara, M.A., 2013. Comparison of 2D and 3D single-shot ASL perfusion fMRI sequences. Neuroimage 66, 662-671.
Figures