1104
Improving single-shot multi-parametric mapping via multi-slice information sharing based on multiple overlapping-echo detachment imaging1Department of Electronic Science, Fujian Provincial Key Laboratory of Plasma and Magnetic Resonance, Xiamen University, Xiamen, China, 2MSC Clinical & Technical Solutions, Philips Healthcare, Shenzhen, China
Synopsis
Keywords: Quantitative Imaging, Brain, Multi-slice information sharing; modulation pattern; overlapping-echo detachment imaging
Multi-parametric quantitative magnetic resonance imaging (mqMRI) has important applications in clinic. Multiple overlapping-echo detachment (MOLED) imaging can achieve single-shot mqMRI. However, the existing methods mainly focus on single-slice reconstruction. To improve the reconstruction quality of parametric maps by exploring data redundancy among adjacent slices, we proposed a multi-slice information sharing method via multiple modulation patterns of MOLED k-space and deep neural network. The results show that our method can effectively utilize the correlation information among adjacent slices and improve the reconstruction quality compared to the single-slice reconstruction method.
Introduction
Multiple overlapping-echo detachment imaging (MOLED) is developed for accelerating MR parametric mapping by acquiring multiple MR echo signals with different signal evolution in the same k-space.1,2 Although MOLED has achieved successful parametric mapping, information correlations among slices are ignored in reconstruction. Data redundancy among adjacent slices has been proven to be helpful for improving the quality of reconstruction.3-8 To make use of data redundancy among adjacent slices to improve reconstruction quality, a multi-slice information sharing strategy was introduced into the reconstruction of MOLED parametric maps. Three modulation patterns of the MOLED k-space were used alternately in adjacent slices. In the training and testing, the MOLED images of multiple adjacent slices were fed into the deep neural network, and the reconstruction results of the middle slice were output. Simulation results show that the proposed technique can effectively improve the reconstruction quality of single-shot multi-parameter quantitative mapping based on MOLED.Methods
Pulse sequence: The MOLED pulse sequence is illustrated in Figure 1(a). Four excitation pulses with the same flip angle α = 30° are followed by a refocusing pulse with a flip angle of β = 180° to generate four echoes with different TEs. The gradients G1, G2, G3 and G4 are echo-shifting gradients used to shift the four echoes away from the k-space center along the phase-encoding and frequency-encoding directions. The phase and magnitude difference between multiple echo signals result in the interference stripes on the MOLED image. The MOLED image carries adequate information for quantitatively estimating the target parameters. As illustrated in Figure 1(b), three modulation patterns of the k-space were designed, which were used alternately in adjacent slices. These echoes were arranged as optimally as possible so that the echo times in the three modulation patterns were uniformly distributed. Thus, the deep neural network could efficiently utilize the correlation information among adjacent slices.Simulation experiments: The brain phantoms from BrainWeb (https://brainweb.bic.mni.mcgill.ca/)9, made from 20 healthy adults with inter-subject anatomical variabilities, were used to synthesize MRI datasets. Each brain phantom represented a three-dimensional discrete tissue mask covering the whole brain for a total of 11 tissue types, including, for example, gray/white matter, CSF, and connective tissues. Experimental parameters were: field of view (FOV) = 22×22 cm2, sampling matrix = 128×128, slice thickness = 1.0 mm. The four TEs were about 22/51/84/112 ms for MOLED modulation pattern A (MP-A), and 15/40/95/119 ms for MP-B, and 30/60/72/103 ms for MP-C.
Network:Figure 2 shows the schematic diagram of U-Net used in mqMRI reconstruction. The real and imaginary parts of the MOLED images were input into the network as multiple channels.
Results
For intuitive assessment of the reconstruction results, Figure 3 shows four representative slices of one brain. We can see that the proposed method can achieve better reconstruction accuracy and higher image quality compared to single-slice method. Table 1 presents the averages and standard deviations of the root mean square error (RMSE) and structural similarity (SSIM) for the T2 and M0 maps. To further investigate the impacts of individual difference on the performance of the methods, the statistical values are summarized into box plots, as shown in Figure 4. It can be seen that the average performance of the proposed method is better than the single-slice method.Discussion and conclusion
In this study, we present a deep learning-based method for multi-slice information sharing reconstruction of single-shot multi-parametric mapping via MOLED. The quantitative metrics and visualization comparison demonstrate the advantage of our method over single-slice reconstruction. It effectively utilizes the correlation information among adjacent slices and improves the reconstruction results.Acknowledgements
This work was supported by the National Natural Science Foundation of China under grant numbers 11775184 and 82071913.
References
1. Cai CB, Zeng YQ, Zhuang YC, et al. Single-shot T2 mapping through overlapping-echo detachment (OLED) planar imaging. IEEE Transactions on Biomedical Engineering. 2017; 64(10): 2450-2461.
2. Zhang J, Wu J, Chen SJ, et al. Robust single-shot T2 mapping via multiple overlapping-echo acquisition and deep neural network. IEEE Transactions on Medical Imaging. 2019; 38(8): 1801-1811.
3. Datta S, Deka B, Mullah H U, et al. An efficient interpolated compressed sensing method for highly correlated 2D multi-slice MRI. 2016 International Conference on Accessibility to Digital World (ICADW). 2016: 187-192.
4. Deka B, Datta S. Calibrationless joint compressed sensing reconstruction for rapid parallel MRI. Biomedical Signal Processing and Control. 2020; 58: 101871.
5. Song Y, Zhu Z, Lu Y, et al. Reconstruction of magnetic resonance imaging by three‐dimensional dual‐dictionary learning. Magnetic Resonance in Medicine, 2014; 71(3): 1285-1298.
6. Zhao Y, Yi Z, Liu Y, et al. Calibrationless multi‐slice Cartesian MRI via orthogonally alternating phase encoding direction and joint low‐rank tensor completion. NMR in Biomedicine. 2022; 35(7): e4695.
7. Xiao Z, Du N, Liu J, et al. SR-Net: A sequence offset fusion net and refine net for undersampled multislice MR image reconstruction. Computer Methods and Programs in Biomedicine. 2021; 202: 105997.
8. Shangguan P, Jiang WJ, Wang JC, et al. Multi-slice compressed sensing MRI reconstruction based on deep fusion connection network. Magnetic Resonance Imaging. 2022, 93: 115-127.
9. Aubert-Broche B, Griffin M, Pike GB, et al. Twenty new digital brain phantoms for creation of validation image data bases. IEEE Transactions on Medical Imaging. 2006; 25(11): 1410-1416.
Figures
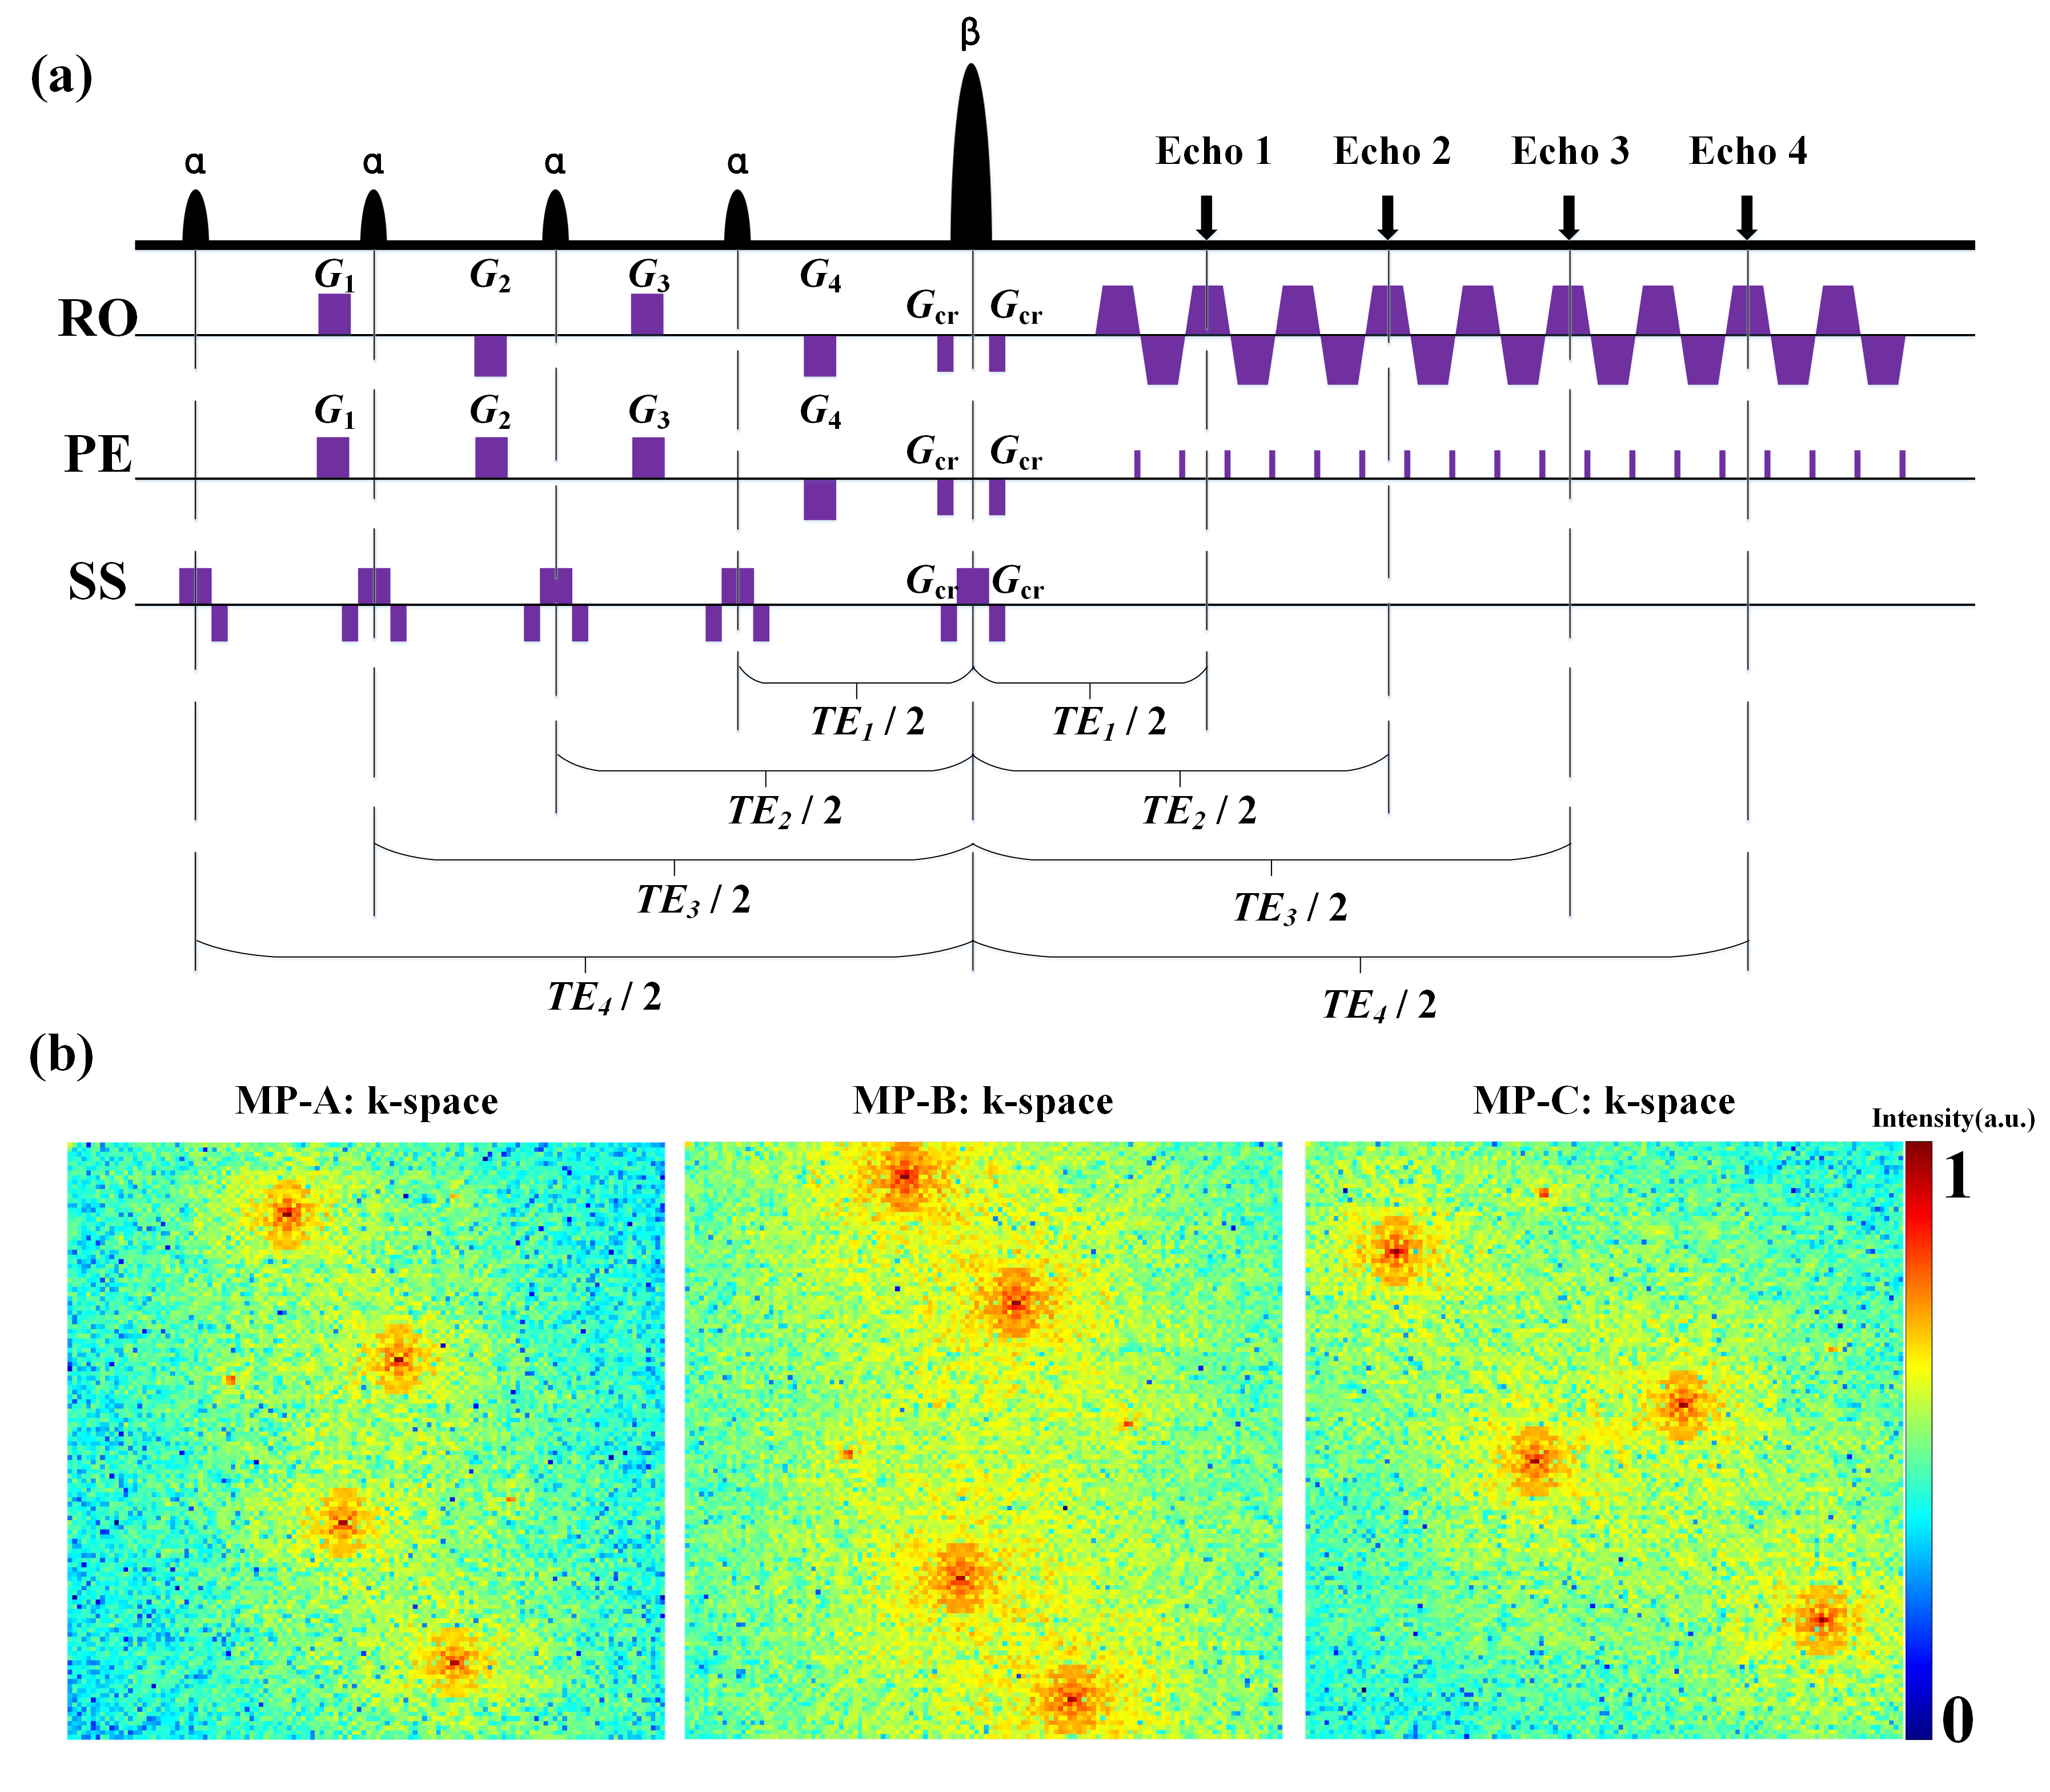
Figures 1. (a) The MOLED sequence diagram.α denotes the excitation pulse. β is refocusing pulse. RO,PE, and SS represent the readout, phase-encoding, and slice selective direction. Gro is the readout gradient. Gpe is the phase-encoding gradient. (b) Three different modulation patterns of the k-space.
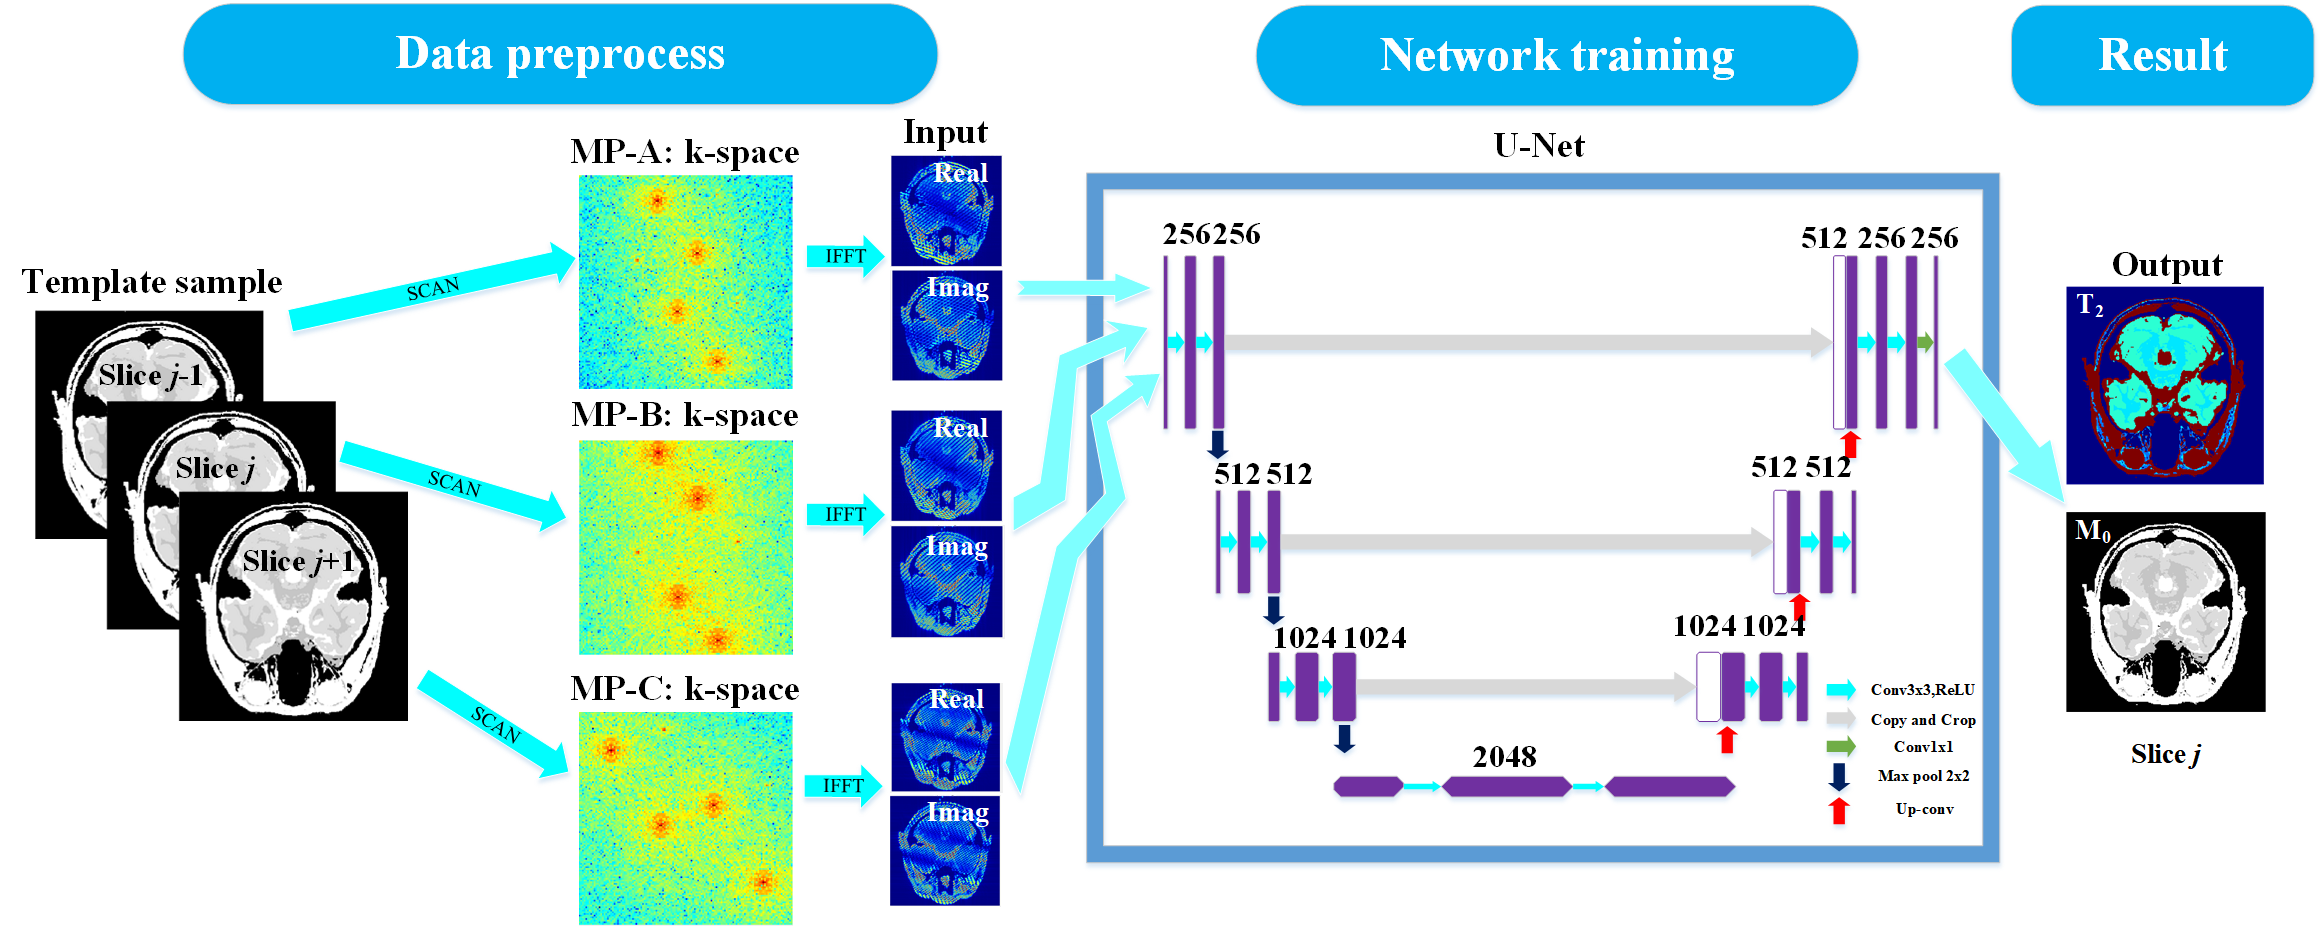
Figures 2. The flowchart of deep neural network reconstruction. IFFT denotes inverse fast Fourier transform. The inputs of the neural network are the real and imaginary parts of the MOLED images. The purple boxes represent the feature maps,and the number of channels is labeled on the top of the boxes. Each white box represents the copied feature maps.
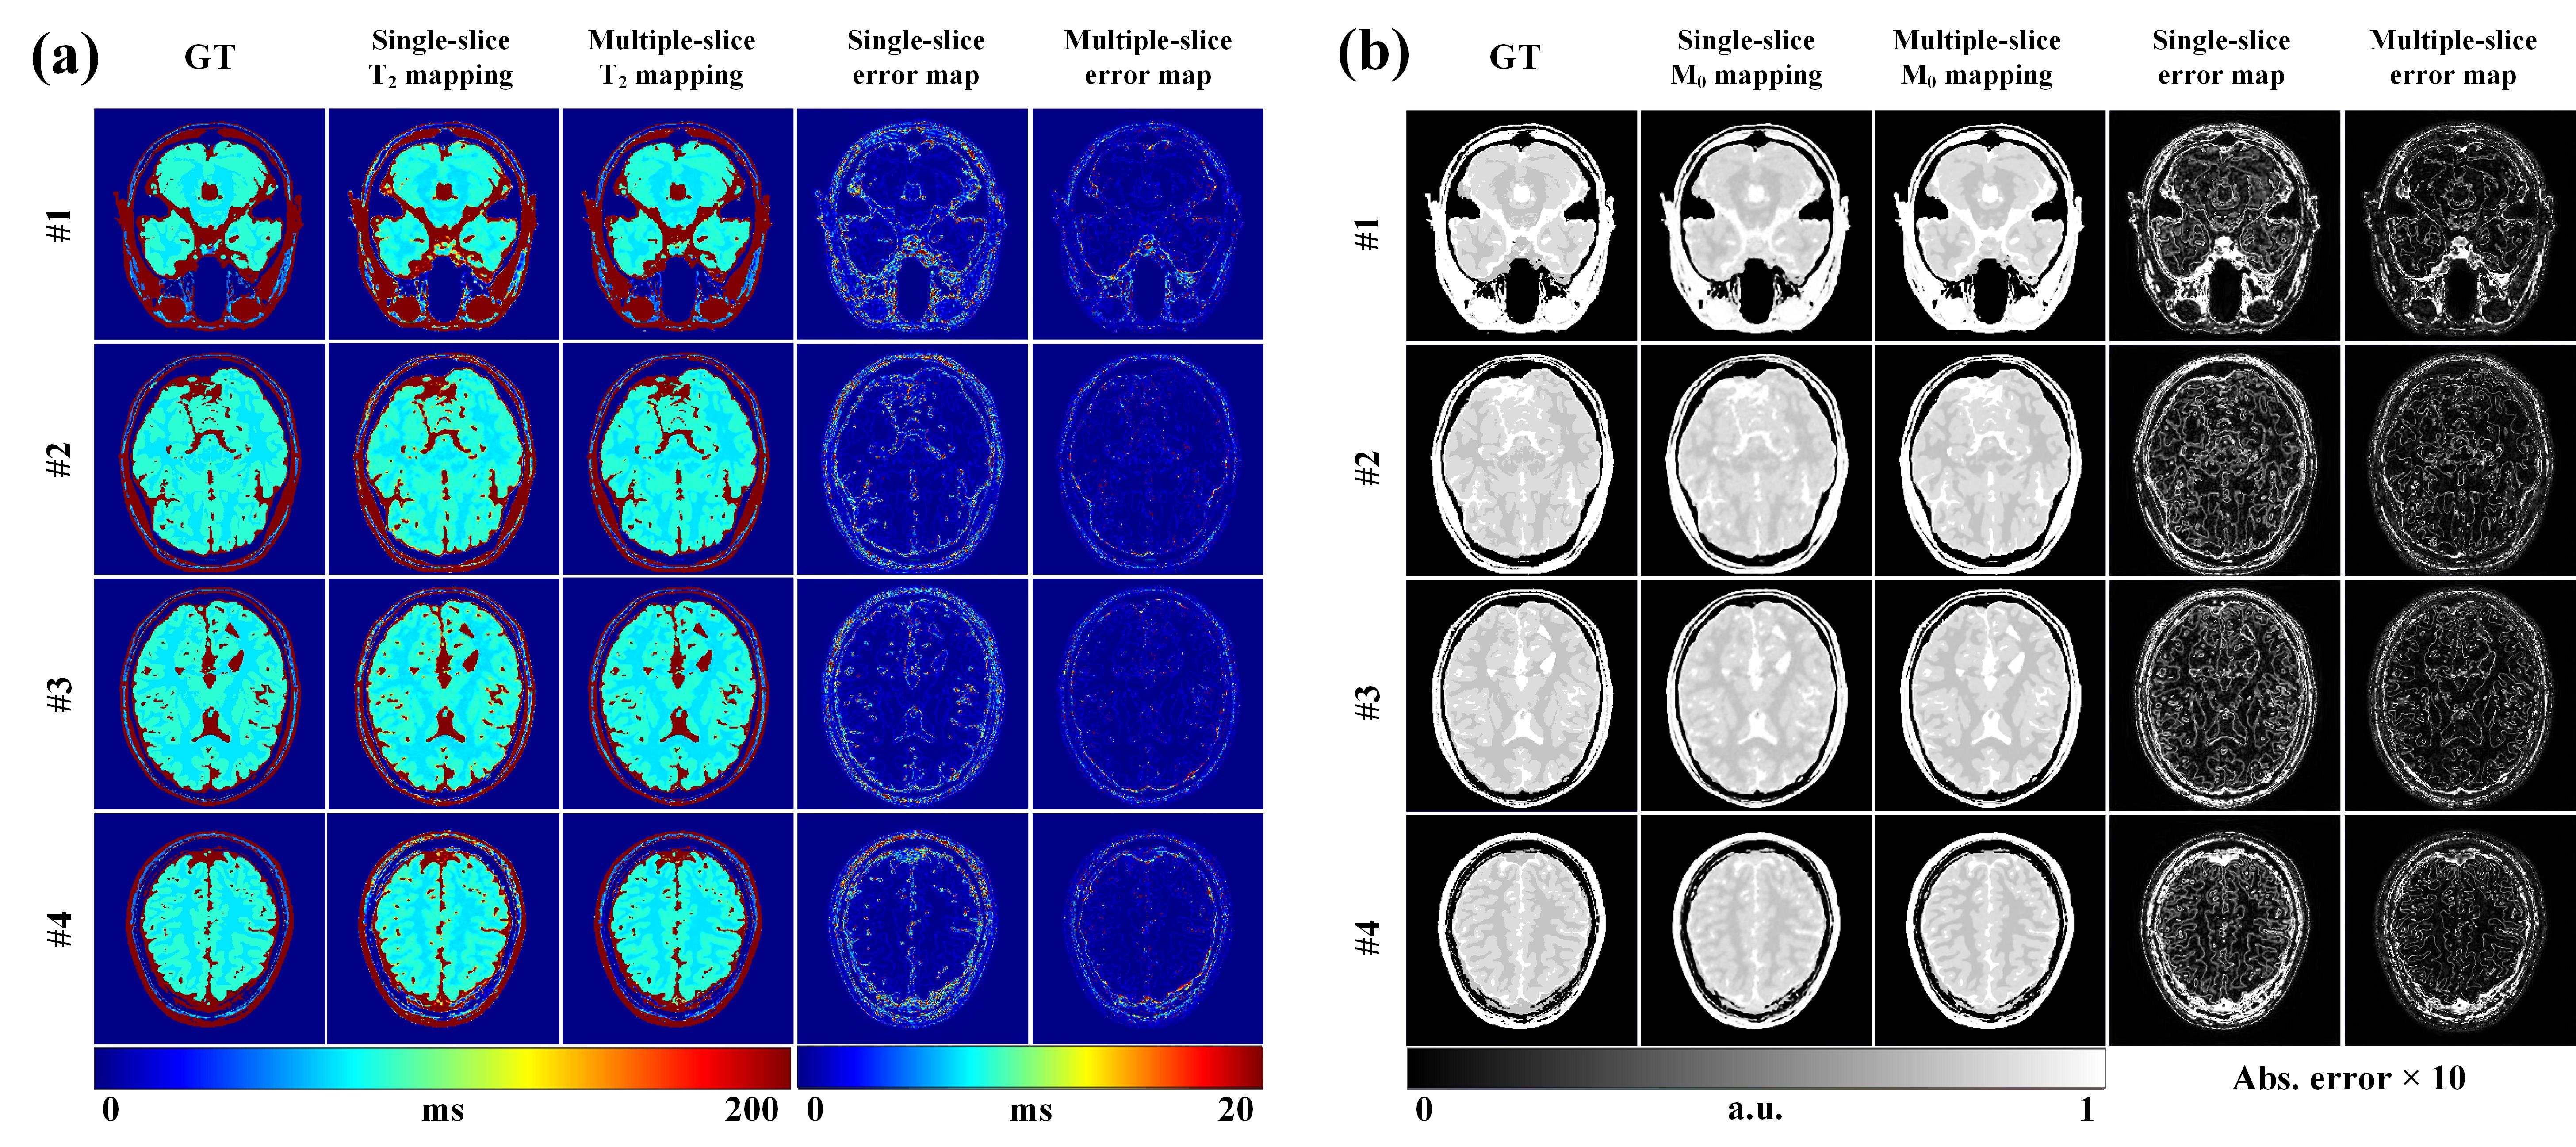
Figures 3. T2 mapping (a) and M0 mapping (b) results of four representative slices reconstructed using different methods.
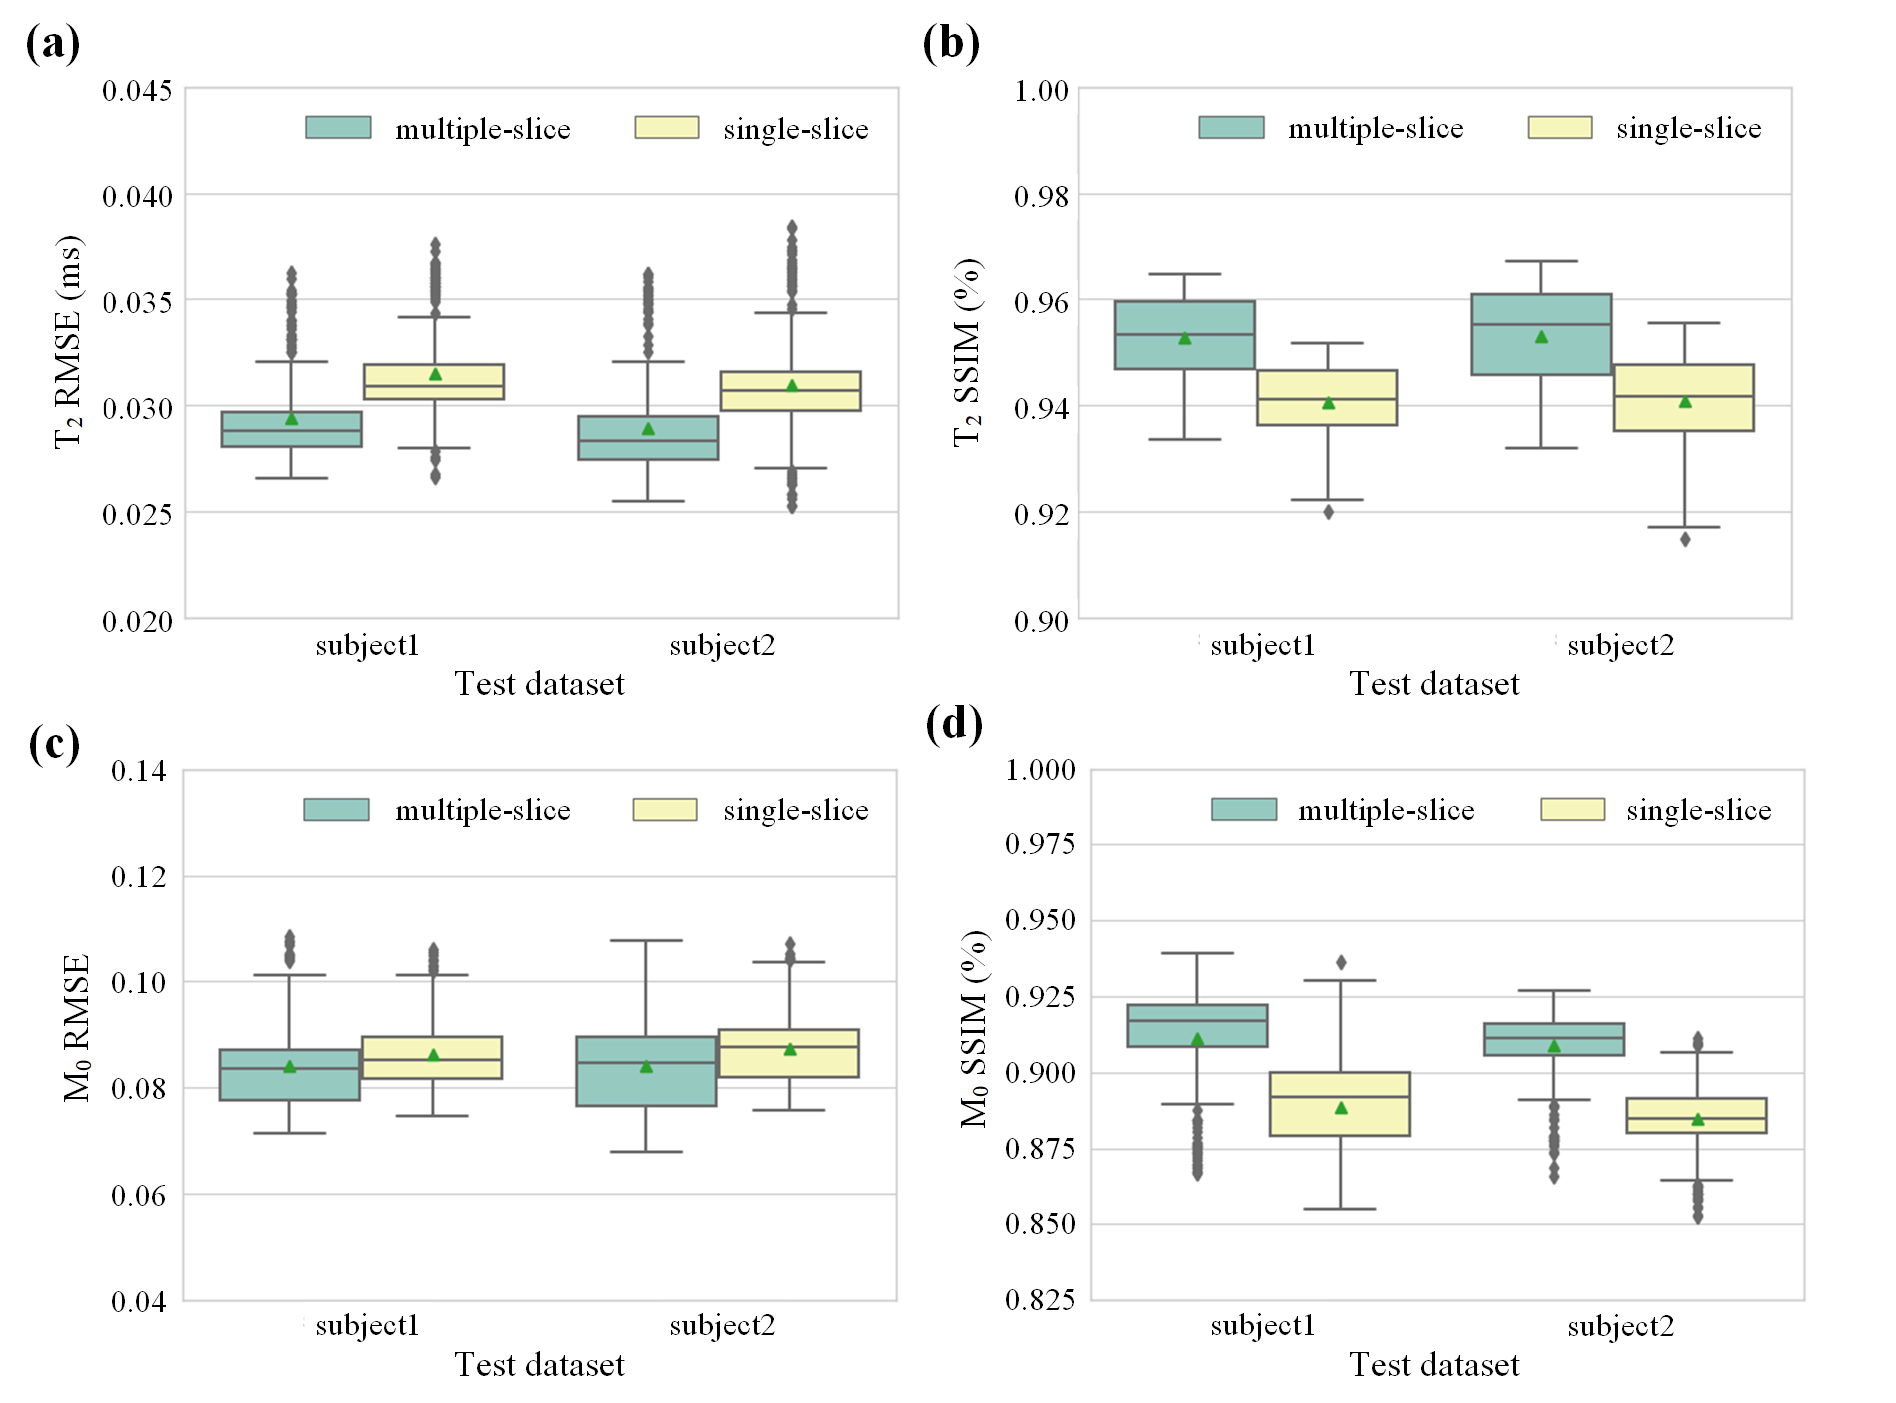
Figures 4. (a) Box plot of the T2 RMSE. (b) Box plot of the T2 SSIM.(c) Box plot of the M0 RMSE. (d) Box plot of the M0 SSIM.
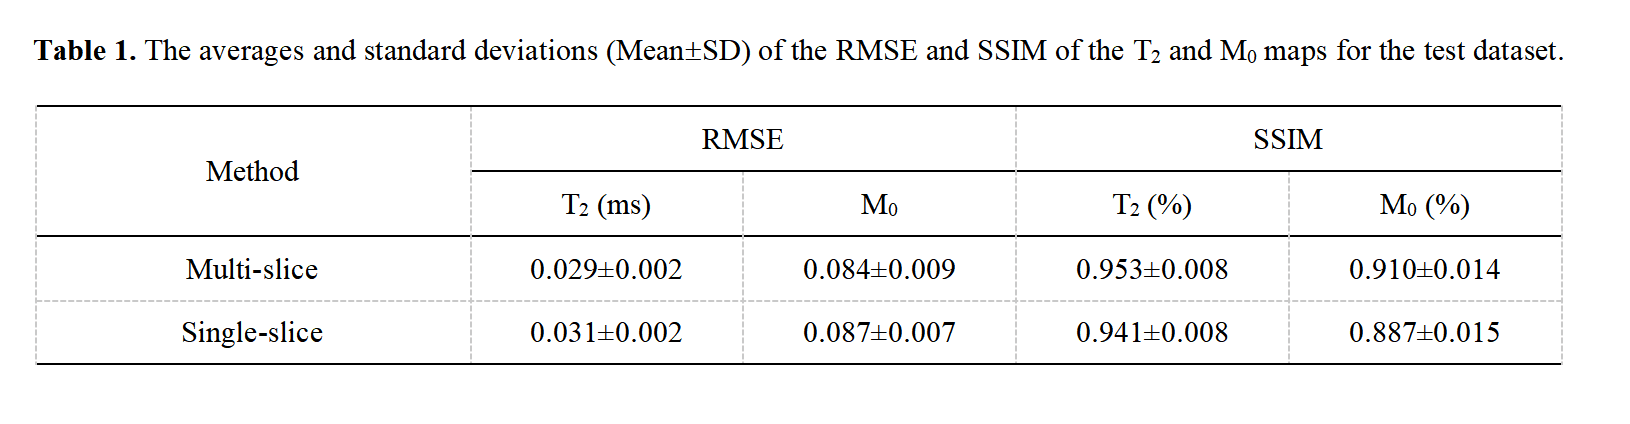
Table 1. The averages and standard deviations(Mean±SD) of the RMSE and SSIM of the T2 and M0 mapsfor the test dataset.