1100
Bayesian Networks Reveal the Interplay Between Quantitative Liver MRI Metrics1University of Oxford, Oxford, United Kingdom, 2Perspectum, Oxford, United Kingdom
Synopsis
Keywords: Quantitative Imaging, Liver, cT1, T2*, PDFF, volume, future liver remnant
Understanding the interplay between quantitative MRI metrics is crucial for reliable clinical assessment of liver health. This study utilised Bayesian networks to visualise hidden relationships between cT1, T2*, proton density fat fraction (PDFF), volume and future liver remnant (FLR). Analysing the directionality between Bayesian networks on a pre-operative dataset with 130 participants and a post-operative dataset with 90 participants, clear causal relationships from PDFF to cT1 and from PDFF to volume were found, which are supported by published literature. An additional discovery is the potential for correlation between metrics to help strengthen the clinical utility of cT1 after surgery.Introduction
Understanding the interplay between MRI metrics is vital for reliable liver health assessment. For example, high levels of liver iron concentration and liver fat fraction are known to lead to erroneous estimations of T1 and T2 1,2. In mitigation, the biomarker corrected T1 (cT1) has been introduced. Bayesian network (BN) can be used to identify hidden factors that affect measured metrics (i.e., confounders) and potentially explain causality. This study therefore reports progress toward BN design to explore the interplay between metrics: liver cT1, T2*, proton density fat fraction (PDFF), volume, and future liver remnant (FLR). Specifically, the study aims to discover unknown relationships between these metrics and assess how incorporating specialist knowledge improves data-driven BN analysis.Methods
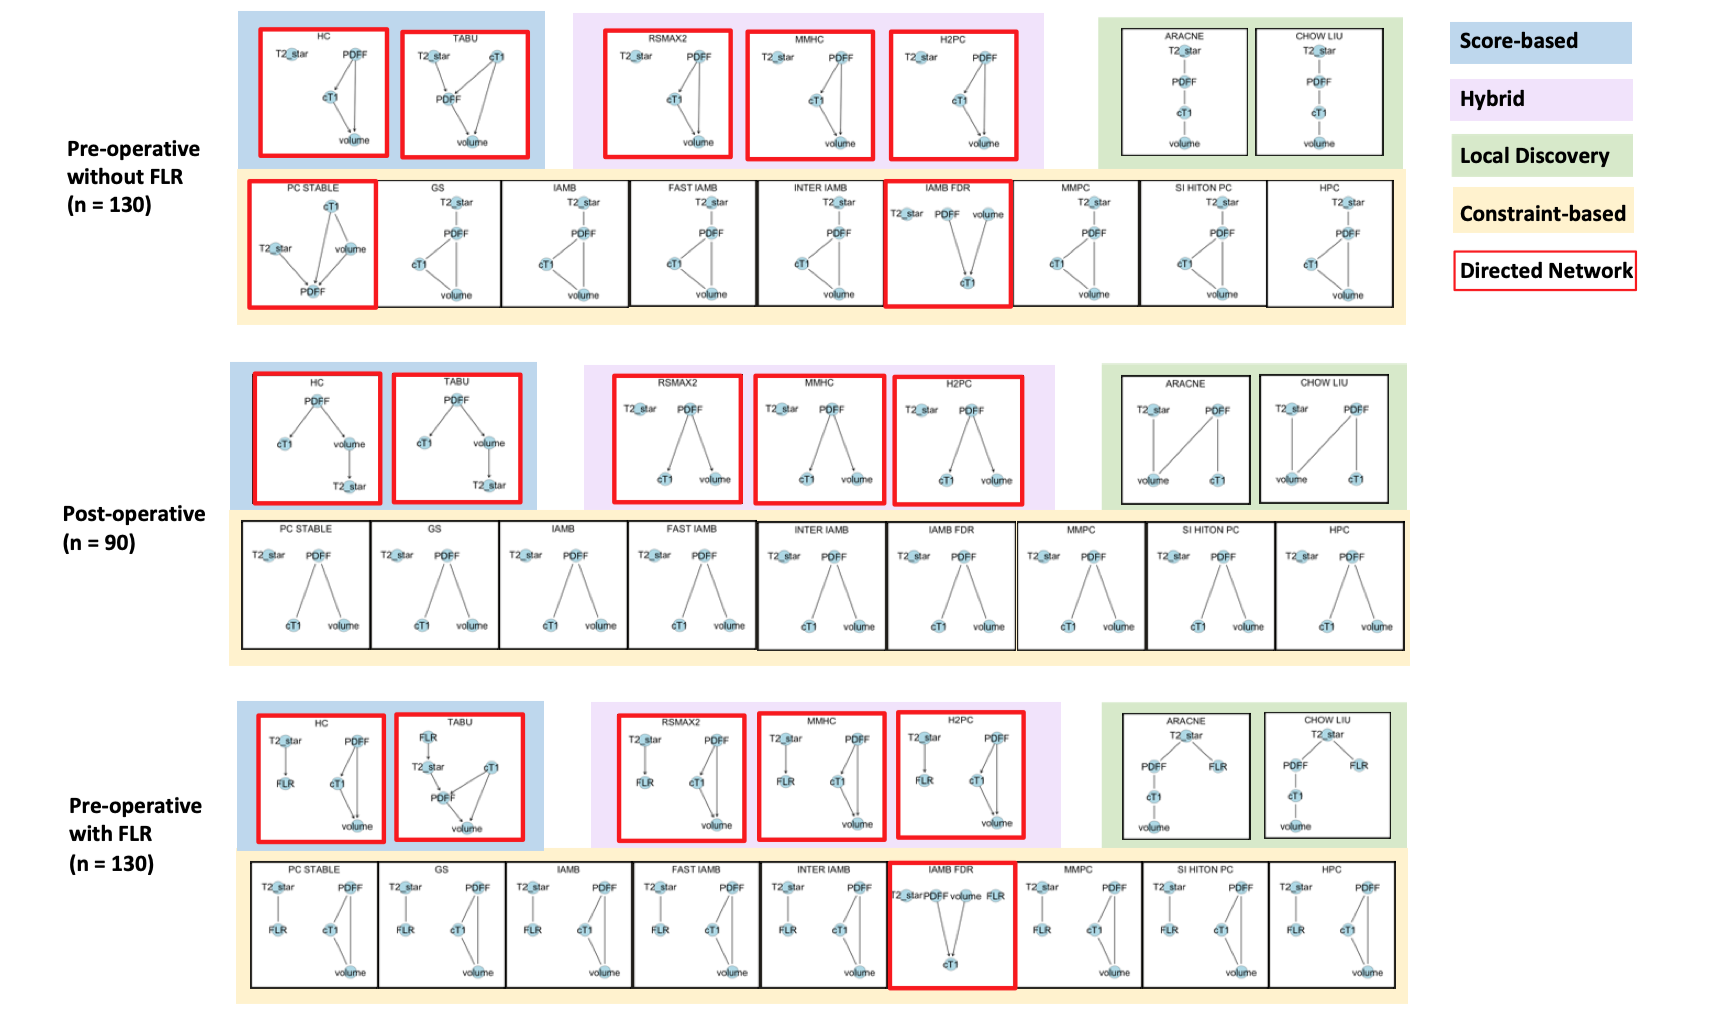
Patient data were curated from the HepaT1ca clinical trial, designed to quantify liver health in surgical candidates with metastatic tumours 3. Three datasets were analysed: (1) pre-operative (130 participants), including the FLR metric 4; (2) pre-operative, excluding the FLR metric; (3) post-operative (90 participants). Sixteen Bayesian structure learning algorithms from the R bnlearn package (Bell Laboratories, USA), were applied: nine constraint-based (Parent Children [PC stable], Grow-Shrink [GS], Incremental Association Markov Blanket [IAMB], Fast Incremental Association [Fast-IAMB], Interleaved Incremental Association [Inter-IAMB], Incremental Association with false discovery rate (FDR) Correction [IAMB-FDR], Max-Min Parents & Children [MMPC], Semi-Interleaved Hiton-PC [SI-HITON-PC], Hybrid Parents & Children [HPC]); two score-based (Hill Climbing [HC], Tabu Search [Tabu]); three hybrid (Max-Min Hill Climbing [MMHC], Hybrid HPC [H2PC], General 2-Phase Restricted Maximization [rsmax2]); two local discovery (Chow-Liu, ARACNE) 5. Network structures were generated by applying each BN algorithm to each dataset (16 algorithms x 3 datasets), producing 48 networks (Figure 1). Similarity, directionality, and potential causal relationships (presented as arcs: →) were studied to interpret relationships between measured metrics. Domain knowledge regarding quantitative MRI and liver physiology was incorporated by consulting a senior physicist and senior clinical scientist, who interpreted and critiqued the BN algorithm results.Results
Network SimilaritySimilarity between networks was only investigated within each dataset, since BNs rely on provided data for network structure decisions. Substantial similarity was found between network structures generated by algorithms with the same design (i.e., within each colour shaded box in Figure 1); while networks generated by algorithms with different designs showed little similarity (i.e., across colour shaded boxes in Figure 1). However, different algorithm designs generating different network structures is not necessarily a limitation, as this allows consideration of different relationships and may prove advantageous in discovering hidden relationships. There is also no fundamental reason to support the accuracy of a “popular” structure, motivating verification using domain knowledge.
Network Directionality
Directed networks are more valuable, providing insights into potential causal relationships (presented as arcs: →) instead of merely correlations (presented as edges: ---). Eighteen directed networks were generated (see red bounding boxes in Figure 1) and then considered for further analysis.
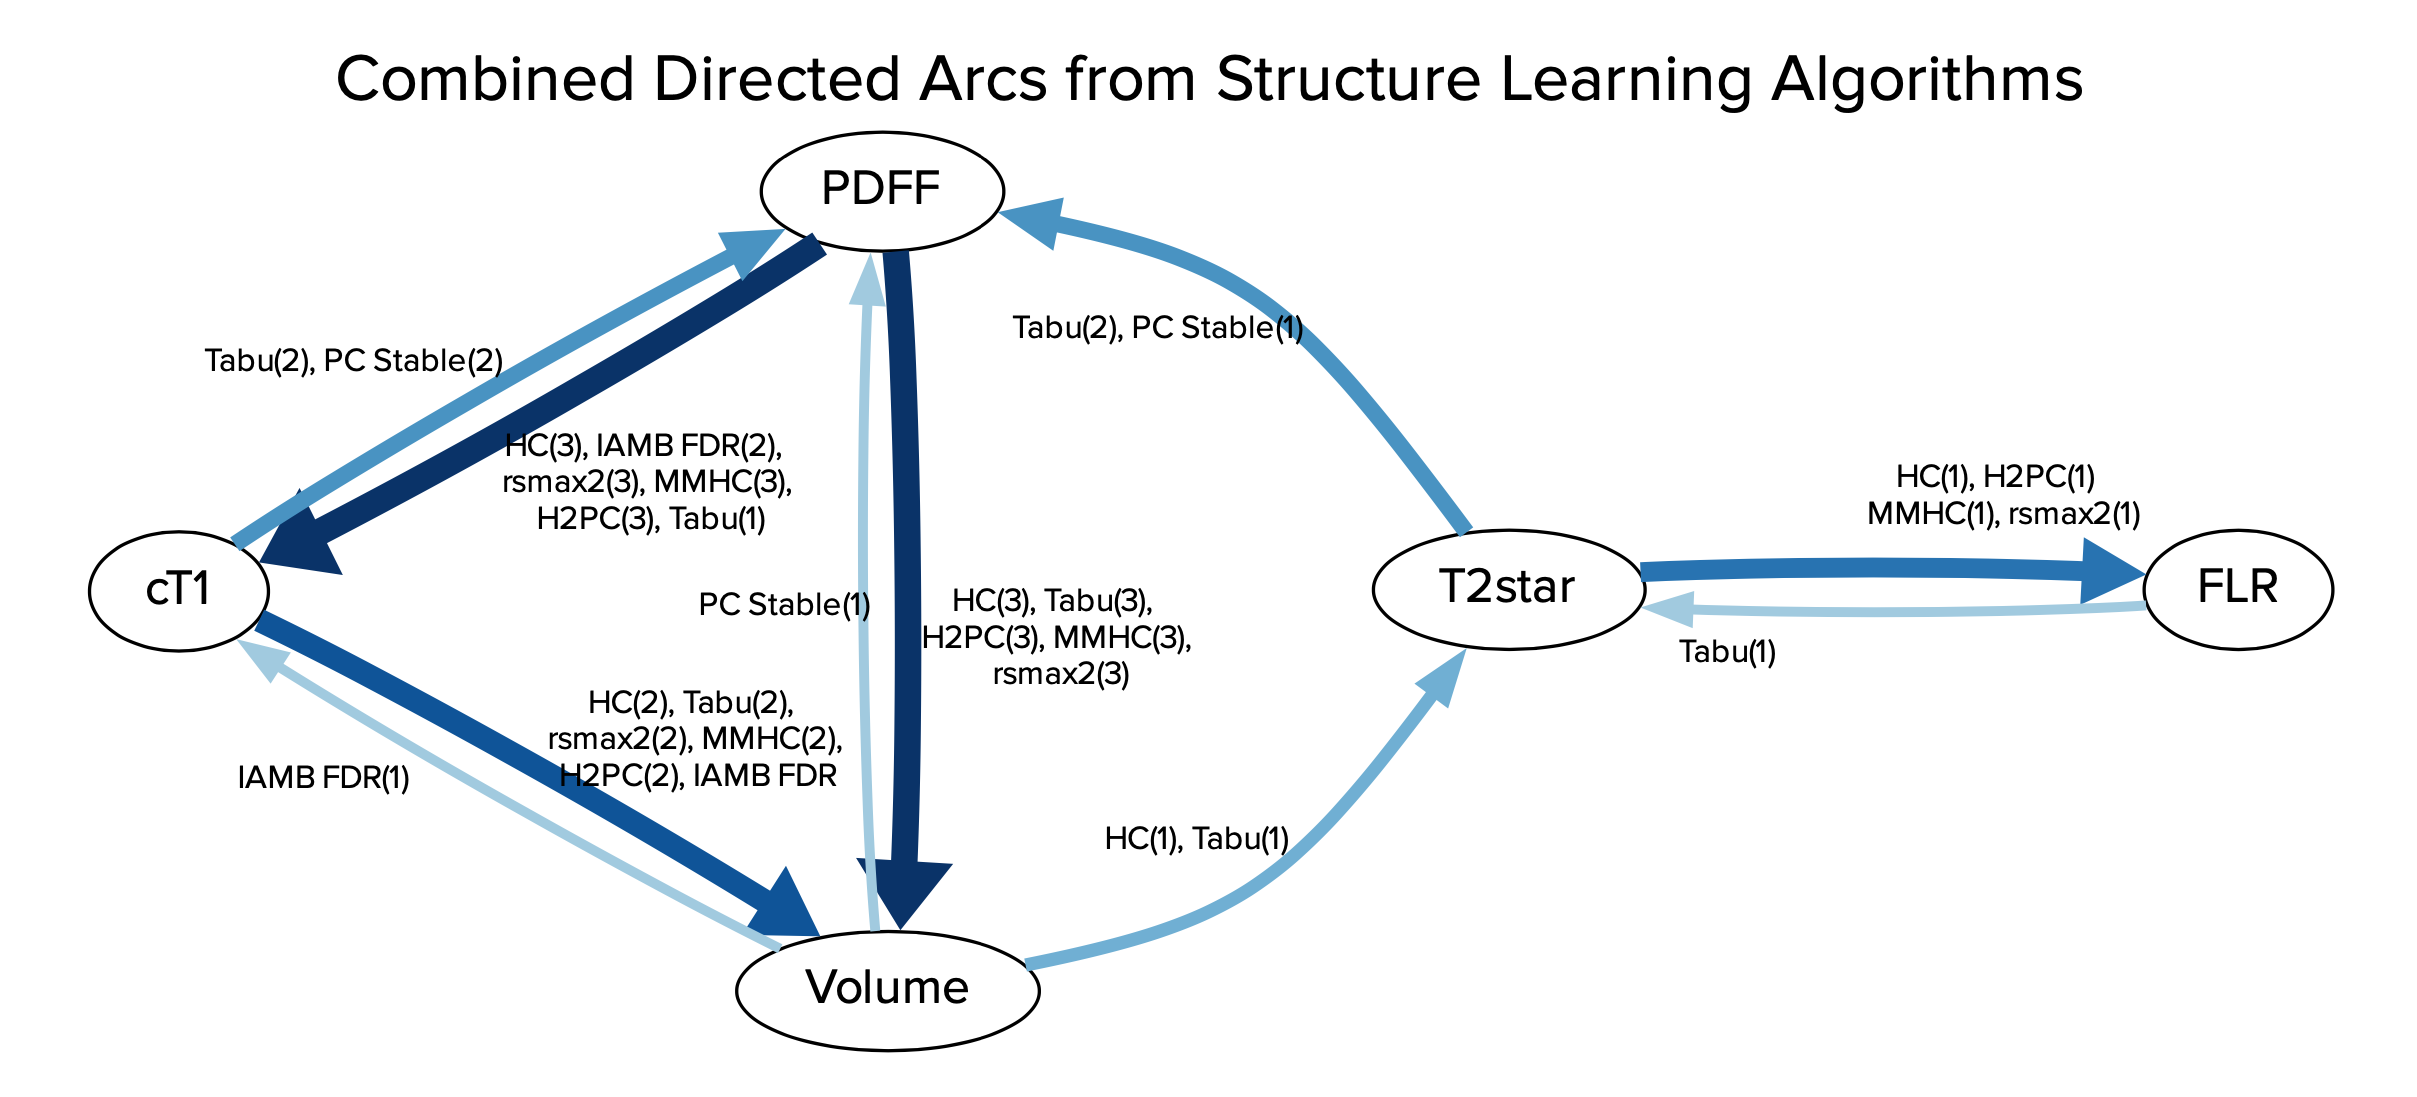
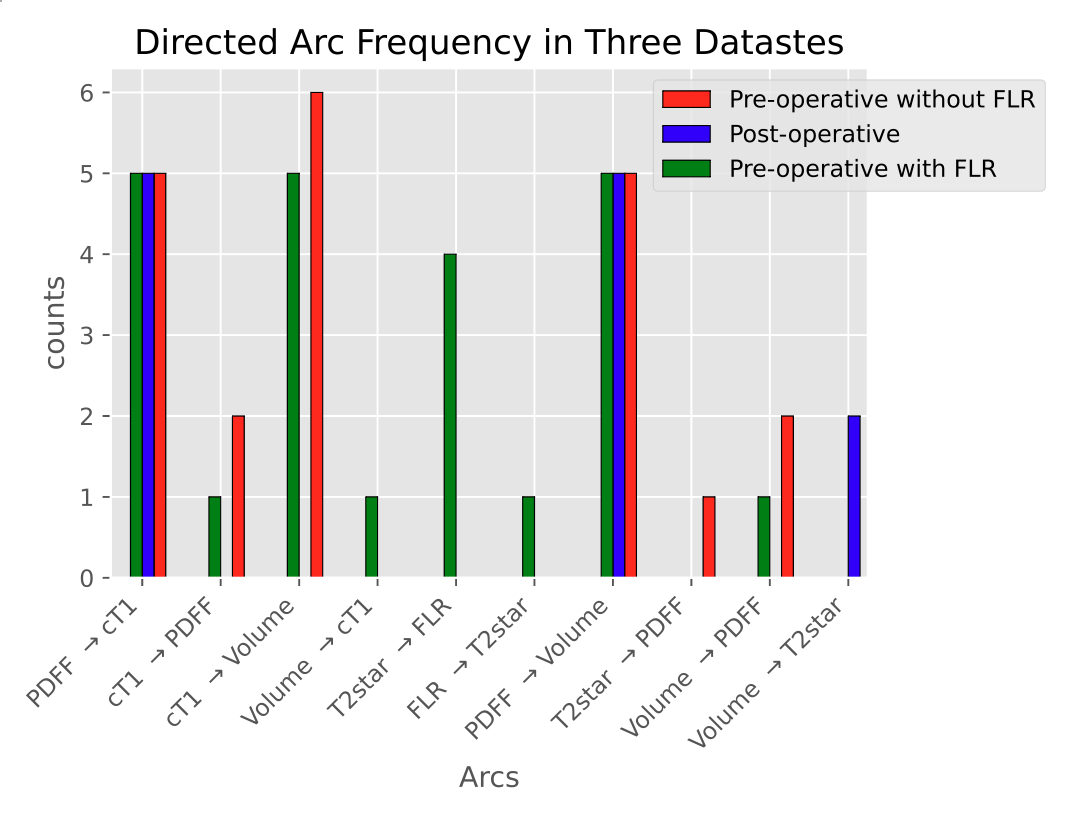
Common Arcs in Directed Networks
A combined directed network is shown in Figure 2, and arc generation frequencies in Figure 3. Arcs such as cT1 → PDFF, Volume → cT1, T2* → FLR, FLR → T2*, T2* → PDFF, Volume → PDFF and Volume → T2* were only generated by one or two algorithms and lacking a physiological basis, and are therefore considered “unreasonable”. The three arcs: PDFF → cT1, PDFF → Volume, and cT1 → Volume were generated most frequently. Most notably, PDFF → cT1 and PDFF → volume were generated by all five algorithms in all three datasets.
Discussion
PDFF → cT1 is considered “reasonable” because it is supported by Mozes et al., who found that fat fractions up to 40 % can have an additive effect on measurements of T1 at 3T 1, and Thiesson et al., who found a T1 bias from lipids at 1.5T 6. PDFF → Volume is also considered “reasonable” because it agrees with Lin et al., who found correlation between total liver volume and PDFF 7. However, no evidence could be found to support the relationship cT1→ Volume. Discussion with the clinical specialists revealed a potential confounding effect from PDFF, where higher fat concentration leads to both higher cT1 and larger liver volume. Supporting this, PDFF was found as a parent node over cT1 and volume in many of the networks. This highlights the value of causal analysis (which can be performed using BNs) over correlation studies, as directionality in the networks helped identify the confounding effect of PDFF. Furthermore, the cT1 → Volume arc is only present in the pre-operative datasets, which implies different correlation strengths for cT1 → Volume (liver parenchyma + tumour) and cT1 → Volume (liver parenchyma only). This correlation strength difference could potentially be used as a supplementary factor for post-surgery liver health evaluation, although more work is required to investigate this.Conclusion
This study demonstrated that Bayesian network structure learning algorithms can identify causal relationships and confounders between MRI metrics. Moreover, comparing BN arcs showed potential for correlation between metrics to become a useful tool to strengthen a metric’s (e.g., cT1) clinical utility after intervention (e.g., surgery). This understanding may then be applied during surgical decision-making to help predict patients at risk of poor outcomes after liver resection.Acknowledgements
I appreciate the University of Oxford for providing scientific support and Perspectum for sponsoring me for this study.References
1. Mozes FE, Tunnicliffe EM, Pavlides M, Robson MD. Influence of fat on liver T1 measurements using modified Look–Locker inversion recovery (MOLLI) methods at 3T. Journal of Magnetic Resonance Imaging. 2016;44(1):105-11.
2. Li TQ, Aisen AM, Hindmarsh T. Assessment of hepatic iron content using magnetic resonance imaging. Acta Radiologica. 2004;45(2):119-29.
3. Mole DJ, Fallowfield JA, Kendall TJ, Welsh F, Semple SI, Bachtiar V, Kelly M, Wigmore SJ, James Garden O, Wilman HR, Banerjee R. Study protocol: HepaT1ca–an observational clinical cohort study to quantify liver health in surgical candidates for liver malignancies. BMC cancer. 2018;18(1):1-7.
4. Vauthey JN, Chaoui A, Do KA, Bilimoria MM, Fenstermacher MJ, Charnsangavej C, Hicks M, Alsfasser G, Lauwers G, Hawkins IF, Caridi J. Standardized measurement of the future liver remnant prior to extended liver resection: methodology and clinical associations. Surgery. 2000;127(5):512-9.
5. Scutari M, Ness R. bnlearn: Bayesian network structure learning, parameter learning and inference. R package version. 2012;3:805.
6. Thiesson SB, Thompson RB, Chow K. Characterization of T1 bias from lipids in MOLLI and SASHA pulse sequences. Journal of Cardiovascular Magnetic Resonance. 2015;17(1):1-2.
7. Lin SC, Heba E, Bettencourt R, Lin GY, Valasek MA, Lunde O, Hamilton G, Sirlin CB, Loomba R. Assessment of treatment response in non‐alcoholic steatohepatitis using advanced magnetic resonance imaging. Alimentary pharmacology & therapeutics. 2017 Mar;45(6):844-54.
Figures