1099
Initial Demonstration of Simultaneous Estimation of Water-Specific T1, PDFF, R2*, and QSM in the Liver Using Free-Breathing GraspT1-Dixon MRI1Electrical Engineering and Computer Sciences, University of California, Berkeley, Berkeley, CA, United States, 2Biomedical Engineering and Imaging Institute and Department of Radiology, Icahn School of Medicine at Mount Sinai, New York, NY, United States, 3Center for Advanced Imaging Innovation and Research (CAI2R), NYU Grossman School of Medicine, New York, NY, United States
Synopsis
Keywords: Quantitative Imaging, Multi-Contrast
This work demonstrates the feasibility of simultaneous estimation of fat/water-separated T1, proton density fat fraction (PDFF), R2*, and quantitative susceptibility mapping (QSM) of the liver using free-breathing GraspT1-Dixon MRI from a single rapid acquisition with an inversion-recovery (IR)-prepared multi-echo stack-of-stars sequence. For fat/water-separated T1 mapping, water-only images are generated from multi-echo images at different inversion times (TIs), from which a water-specific T1 map is estimated. For other parameters, acquired data from all TIs are averaged to generate a single set of multi-echo images, from which PDFF, R2*, and QSM are estimated.Introduction
Despite growing interest in using quantitative image markers for assessing different liver diseases, current liver MRI exams in the clinic remain largely of qualitative nature. To date, only proton density fat fraction (PDFF) quantification and R2* mapping are available to evaluate fatty-liver diseases and iron overload in clinical routine. Recently, it has been shown that PDFF and R2* mapping can be performed during free breathing using a multi-echo stack-of-stars sequence (1). Free-breathing fat/water-separated T1 mapping is also possible using an inversion recovery (IR)-prepared multi-echo stack-of-stars sequence (2). Moreover, it has been shown that fat is a major confounding factor for T1 mapping of the liver. Thus, removing the influence of fat is especially important for patients with fatty-liver diseases (3).Multi-gradient-echo (mGRE) images allow also for quantitative susceptibility mapping (QSM). QSM is a relatively new contrast in liver imaging. Several studies have shown potential value of QSM as a probe of the liver iron load (4, 5) and fibrosis (6). These studies have suggested that QSM may provide valuable information about liver-tissue properties that are complementary to other image markers. Purpose of this work was to demonstrate the feasibility of simultaneous estimation of water T1, PDFF, R2*, and QSM during free breathing using GraspT1-Dixon, a technique that extends Golden-angle RAdial Sparse Parallel (GRASP) MRI (2, 7) for quantitative multiparametric imaging.
Methods
GraspT1-Dixon is based on an inversion-recovery-prepared multi-echo stack-of-stars gradient-echo sequence, as described previously (2). Data acquisition is segmented into multiple repetitions that are rotated by the golden angle (111.25°). Each repetition starts with an IR preparation. Different repetitions are separated by an idle time, which allows for signal recovery and ensures B1 robustness (8). After data acqusition, all repetitions are synchronized to generate repetition-combined images at different inversion times (TIs), providing abundant information for extracting different image parameters, as shown in Figure 1. As first step, fat/water separation is performed for dynamic multi-echo images at different TIs. A water-specific T1 map is generated from the separated water-only images based on a three-parameter model (9). As second step, a single set of multi-echo images is generated using data from all TIs for estimation of PDFF, R2*, and B0 maps following the pipeline shown in Figure 2. A low-pass Fermi filter is applied to reduce noise and artifacts, and the raw phase is unwrapped using a 2D Laplacian-based unwrapping method. Following the phase-offset correction, fat/water separation is then performed using a Graph-Cut-based method (10) to generate different images and maps. As third step, the resulting B0 map is then filtered using a joint 2D and 3D V-SHARP method (11) to recover the volumetric local tissue phase. QSM is then calculated using the iLSQR QSM method (12) .The proposed GraspT1-Dixon technique was tested in three healthy volunteers. Imaging was performed on a 3T MRI scanner (MAGNETOM Skyra, Siemens Healthcare GmbH, Germany). Relevant imaging parameters included: FOV=360x360mm2, matrix size=256x256, spatial resolution=1.4x1.4mm2, slice thickness=5mm, number of slices=16, number of echoes=6, TE1/deltaTE/TE6 =1.4/1.6/10.8 ms, flip angle=5°. 26 repetitions were acquired for each subject, and 48 radial stacks were acquired in each repetition. The total acquisition time was 4:47 min. For T1 mapping, image reconstuction was performed using the GRASP-Pro technique (13). For estimation of other paramters, all k-space data from different TIs were combined, and image reconstruction was performed using standard non-uniform FFT (NUFFT).
Results
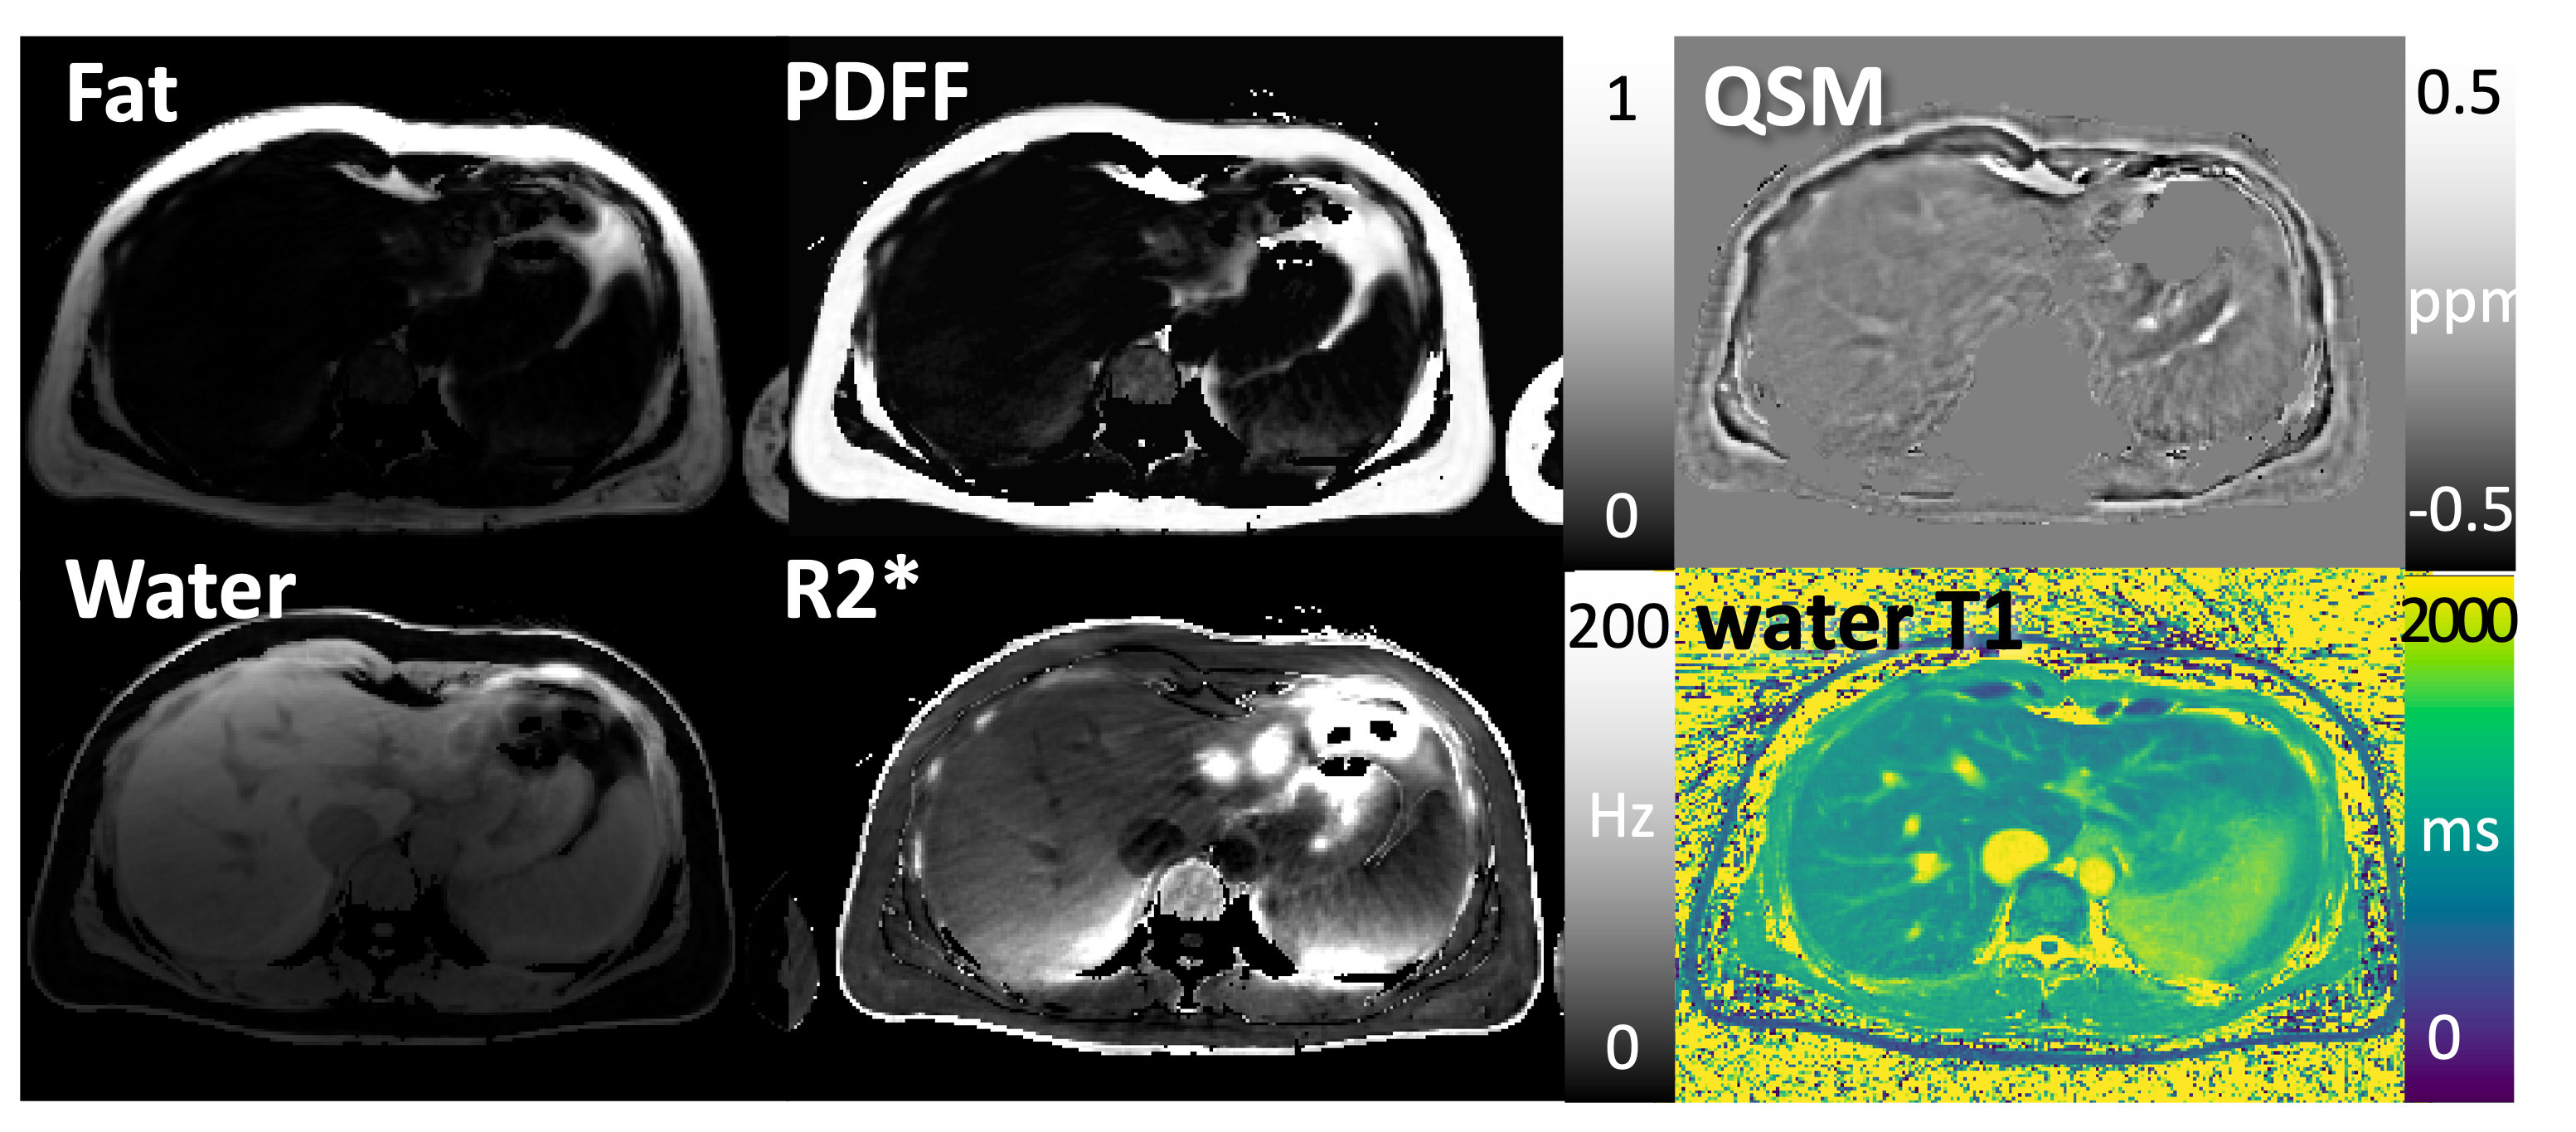
Different images and parameter maps, including water/fat-separated images, water-specific T1 map, R2* map, PDFF, and QSM are shown in Figures 3-5 for three volunteers, respectively. Note that estimation of several image parameters using this sequence, including water T1, PDFF and R2*, has been validated previously (1, 2, 8). Regions with strong field inhomogeneities outside the liver were removed using a mask, ensuring high quality of QSM within the liver region. In the QSM maps, regions with high fat fraction are brighter because fat is paramagnetic compared to other tissue types. Veins in the liver are also visible in QSM as bright line structures because they contain paramagnetic deoxygenated hemoglobin.Conclusion
This work demonstrates the feasibility of simultaneous estimation of fat/water-separated T1, PDFF, R2*, and QSM of the liver in volunteers using free-breathing GraspT1-Dixon MRI. All image parameters can be obtained in less than 5 minutes with a single free-breathing acquisition. Calculating QSM as additional imaging output might provide complementary clinical value, as it may serve as quantitative measure for assessing liver fibrosis, which contains collagen - a diamagnetic substance visible in QSM. In addition to direct quantification of this tissue property, QSM also provides superior contrast of the veins. Maximum intensity projections (MIPs) calculated from QSM may be used to visualize the vascular structure without extra contrast injection. Nevertheless, QSM obtained with the proposed approach still needs to be validated against the current gold standard acquired with an approved Cartesian sequence during suspended respiration.Acknowledgements
This work was supported in part by the NIH (R01EB030549, R21EB032917).References
1. Schneider M, Benkert T, Solomon E, et al.: Free-breathing fat and R2* quantification in the liver using a stack-of-stars multi-echo acquisition with respiratory-resolved model-based reconstruction. Magn Reson Med2020; 84:2592–2605.
2. Feng L, Liu F, Soultanidis G, et al.: Magnetization-prepared GRASP MRI for rapid 3D T1 mapping and fat/water-separated T1 mapping. Magn Reson Med 2021; 86:97–114.
3. Li Z, Vasanawala SS, Feng L: A simulation study of the negative impact of fat on the accuracy of T1 measurements.
4. Li J, Lin H, Liu T, et al.: Quantitative susceptibility mapping (QSM) minimizes interference from cellular pathology in R2* estimation of liver iron concentration. J Magn Reson Imaging 2018; 48:1069–1079.
5. Lin H, Wei H, He N, et al.: Quantitative susceptibility mapping in combination with water-fat separation for simultaneous liver iron and fat fraction quantification. Eur Radiol 2018; 28:3494–3504.
6. Yang ZX, Liang HY, Hu XX, et al.: Feasibility of histogram analysis of susceptibility-weighted MRI for staging of liver fibrosis. Diagn Interv Radiol 2016; 22:301–307.
7. Feng L, Grimm R, Block KT obia., et al.: Golden-angle radial sparse parallel MRI: combination of compressed sensing, parallel imaging, and golden-angle radial sampling for fast and flexible dynamic volumetric MRI. Magn Reson Med 2014; 72:707–717.
8. Li Z, Xu X, Yang Y, Feng L: Repeatability and robustness of MP-GRASP T1 mapping. Magn Reson Med2022; 87:2271–2286.
9. Deichmann R, Haase A: Quantification of T1 values by SNAPSHOT-FLASH NMR imaging. J Magn Reson1992; 96:608–612.
10. Hernando D, Kellman P, Haldar JP, Liang ZP: Robust water/fat separation in the presence of large field inhomogeneities using a graph cut algorithm. Magn Reson Med 2010; 63:79–90.
11. Wei H, Zhang Y, Gibbs E, Chen NK, Wang N, Liu C: Joint 2D and 3D phase processing for quantitative susceptibility mapping: application to 2D echo-planar imaging. NMR Biomed 2017; 30.
12. Li W, Wang N, Yu F, et al.: A method for estimating and removing streaking artifacts in quantitative susceptibility mapping. Neuroimage 2015; 108:111–122.
13. Feng L, Wen Q, Huang C, Tong A, Liu F, Chandarana H: GRASP-Pro: imProving GRASP DCE-MRI through self-calibrating subspace-modeling and contrast phase automation. Magn Reson Med 2020; 83:94–108.
Figures