1098
Water-Specific T1 Mapping of the Liver: The Influence of R2* Estimation and Number of Echoes1Department of Radiology, Stanford University, Stanford, CA, United States, 2BioMedical Engineering and Imaging Institute (BMEII), Icahn School of Medicine at Mount Sinai, New York, NY, United States, 3Department of Radiology, Icahn School of Medicine at Mount Sinai, New York, NY, United States
Synopsis
Keywords: Quantitative Imaging, Liver, fat, Dixon
Fat represents a major confounding factor for T1 mapping of the liver. Recently, a number of novel magnetization-prepared multiecho imaging approaches have been proposed to obtain water-only T1 mapping, and they all hold great potential for clinical applications. However, several questions have raised along with this this trend, such as (1) whether concurrent estimation of R2star and the number of echoes is necessary and whether it would affect the quantification of water T1; and (b) whether the number of echoes would affect T1 estimation. This work aimed to investigate these two questions with both numerical simulation and in-vivo experiments.Introduction
Quantitative measurement of T1 is highly-desirable in the clinic and could be a valuable biomarker for liver diseases, such as detection of liver cirrhosis and fibrosis1,2. Unfortunately, T1 mapping of the liver has not gained clinical acceptance to date due to various reasons. One of them is the influence of fat, which represents a major confounding factor for T1 mapping of the liver, particularly for fatty livers. In the past few years, a number of novel magnetization-prepared multiecho imaging approaches have been proposed to obtain water-only T1 mapping3,4, and they all hold great potential for clinical applications. However, several questions have raised along with this this trend, such as (1) whether concurrent estimation of R2* and the number of echoes is necessary and whether it would affect the quantification of water T1; and (b) whether the number of echoes would affect T1 estimation. This work aimed to investigate these two questions with both numerical simulation and in-vivo experiments. All the in-vivo experiments uses a recently developed imaging method called Golden-angle RAdial Sparse Parallel T1 Mapping with Dixon acquisition (GraspT1-Dixon), which enables rapid free-breathing fat/water-separated T1 mapping in the liver.Technique and Methods
Signal modelThe signal model for a pixel containing water and fat can be written as5:
$$s(t)=(We^{-R_{2}^{*}}+F\sum_{p=1}^{P}r_{p}e^{i2\pi{\Delta}f_{p}t}e^{-R_{2}^{*}})e^{i2\pi{\Psi}} (Eq.1)$$
where W and F are the water and fat signal, Ψ is the phase shift caused by static field inhomogeneities. $$${\Delta}f_p$$$ is the pth fat resonance peak. $$$r_p$$$ is the relative proportion of the pth fat peak, such that $$$\sum_{p=1}^{P}r_{p}=1$$$.
For inversion recovery (IR)-based T1 mapping, MR signal can be expressed as:
$$s(t)=A-Be^{\frac{-TI}{T_{1}^{*}}} (Eq.2)$$
Here, $$$A=I_{0}T_{1}^{*}/T_{1}$$$, $$$B=I_{0}(1+T_{1}^{*}/T_{1})$$$, $$$I_0$$$ is the proton density and $$$T_{1}^{*}$$$ is called apparent relaxation rate that is observed when a constant flip angle (FA) is applied repeatedly to the recovering spins. With the estimated three parameters, the true T1 can then be calculated as $$$T_{1}=T_{1}^{*}(\frac{B}{A}-1)$$$.
Simulation
Simulation using the Bloch equations was conducted to examine the effect of R2* decay on the accuracy of T1 under different fat fractions and signal-to-noise (SNR) levels.
In-Vivo Imaging
In-vivo imaging was performed in 15 volunteers using 2D GraspT1-Dixon, which enables single-shot breath-hold fat/water-separated T1 mapping. Breath-hold 2D imaging was used to avoid the influence of respiratory motion. Imaging was performed on a Siemens 3T Skyra scanner (Siemens Healthineers, Erlangen Germany) with IRB approval. After one IR pulse, golden-angle rotated six-echo radial spokes were continuously acquired. Relevant imaging parameters included: TE={1.4,3.0,4.6,6.2,7.8,9.4}ms, TR=10.7ms, FOV=360x360mm2, matrix size=256x256. 1500 spokes were acquired for each echo in 16s.
Image reconstruction was performed using the GRASP-Pro technique by grouping every 13 consecutive spokes as one image for each TI. Fat/water separation was performed for each TI and a water-specific T1 map was obtained using the three-parameter mode above. For comparison, fat/water separation was performed with and without concurrent R2* estimation, so that the resulting water T1 can be compared. In addition, fat/water separation was also performed using only three echoes without concurrent R2* estimation, and the resulting water T1 maps were compared with that from six echoes.
Results
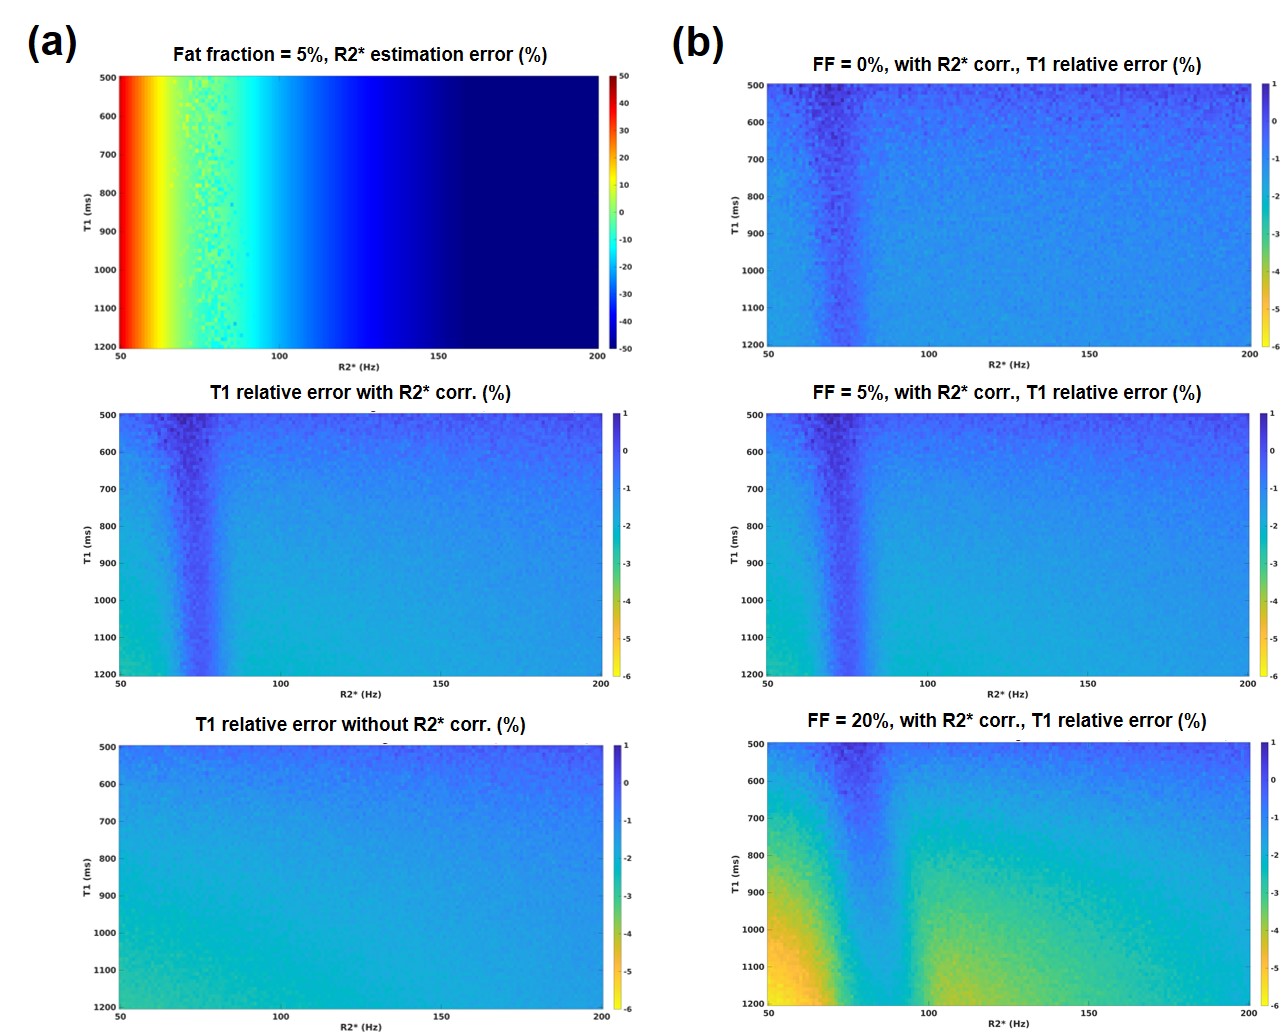
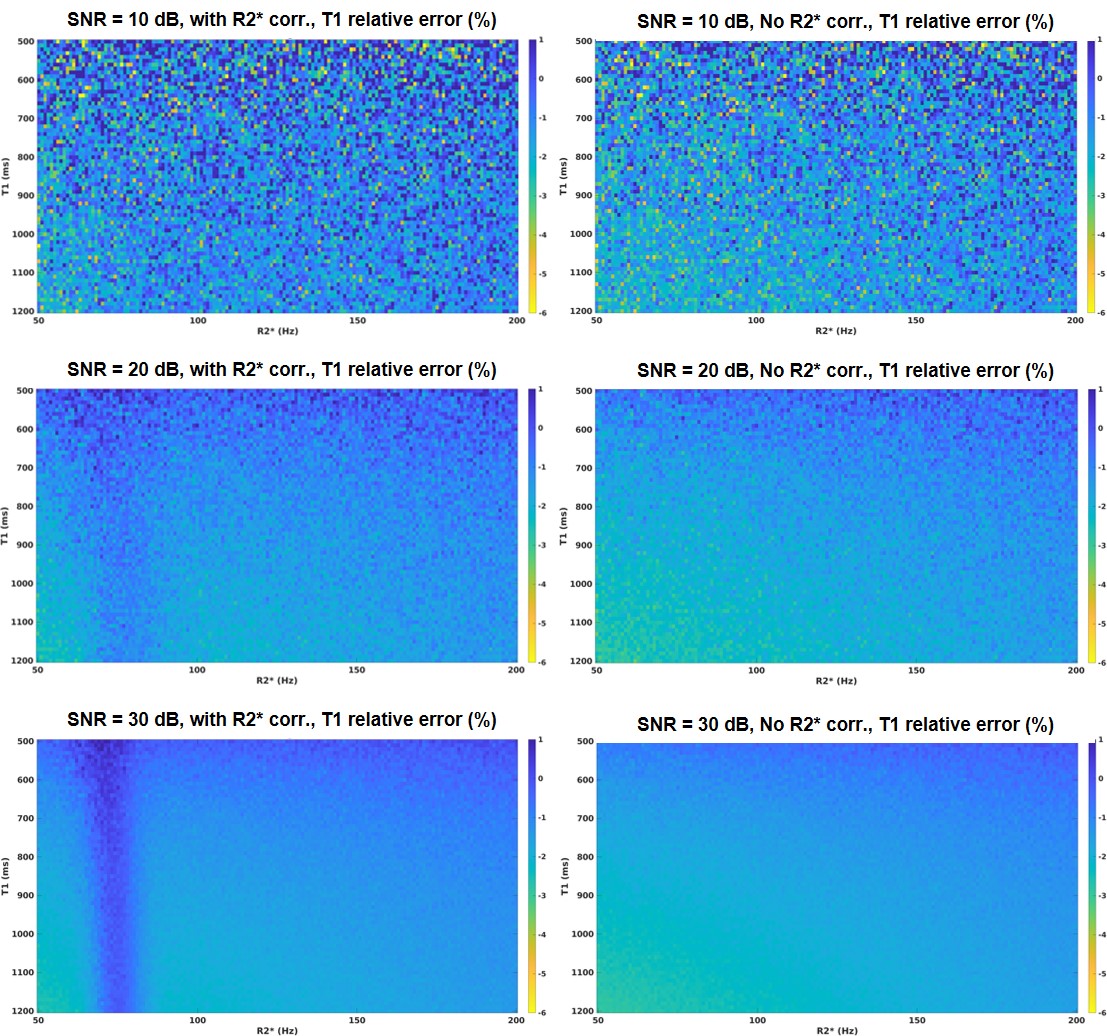
Fig.1(a) shows that based on the TEs, different R2* estimation accuracy were achieved. When the R2* is correctly estimated, the T1 estimation can benefit from R2* correction. Simulation was repeated at SNR=30dB for different fat concentrations, results are presented in Fig.1(b). As fat increases, T1 under-estimation at lower R2* gets worse. This is likely due to an inadequate R2* value been used in the fat/water separation, the residual fat signal may have lowered the water T1.Since the influence from R2* decay on T1 estimation is small, we repeated the simulation at different SNR, the results are presented in Fig.2. The experiments were done with 5% fat fraction. As can be seem, at a higher SNR level, more accurate T1 can be estimated. At SNR=10dB, R2* correction no longer makes a difference.
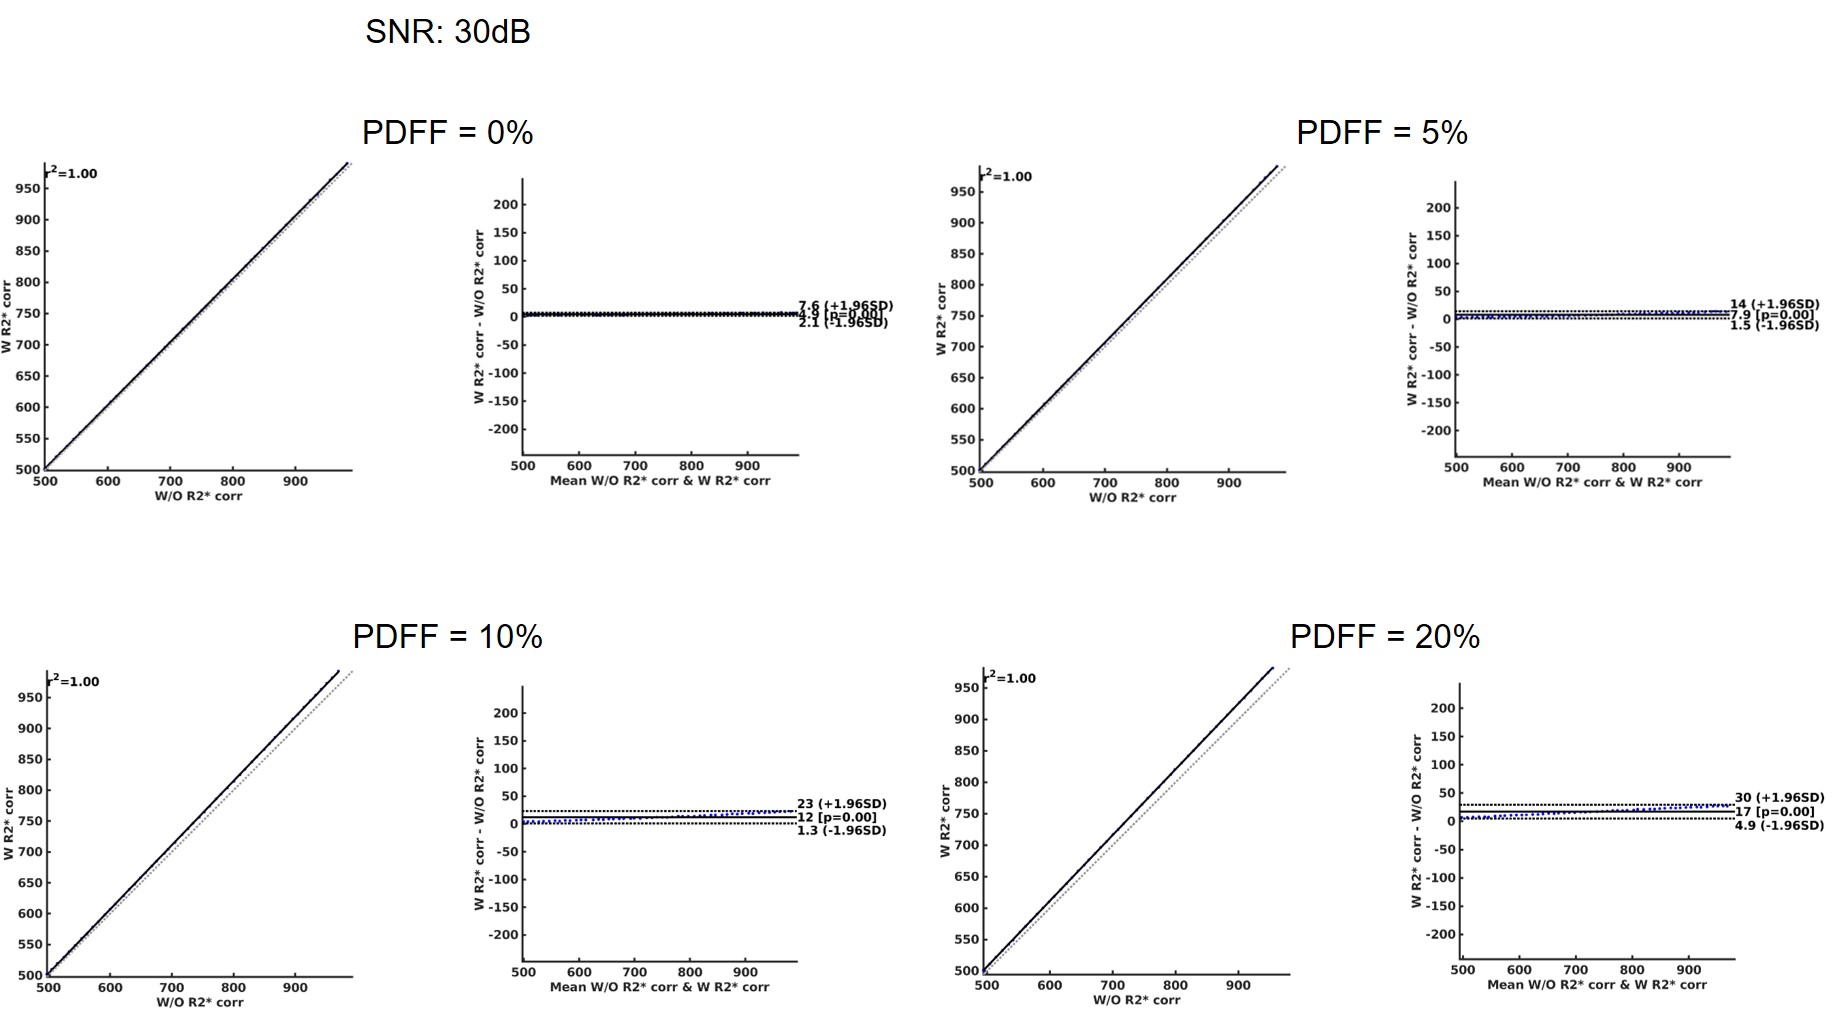
Bland-Altman analysis was done at the same SNR level with different fat fractions. Experiment was done with R2*=75Hz. Results are presented in Fig.3.
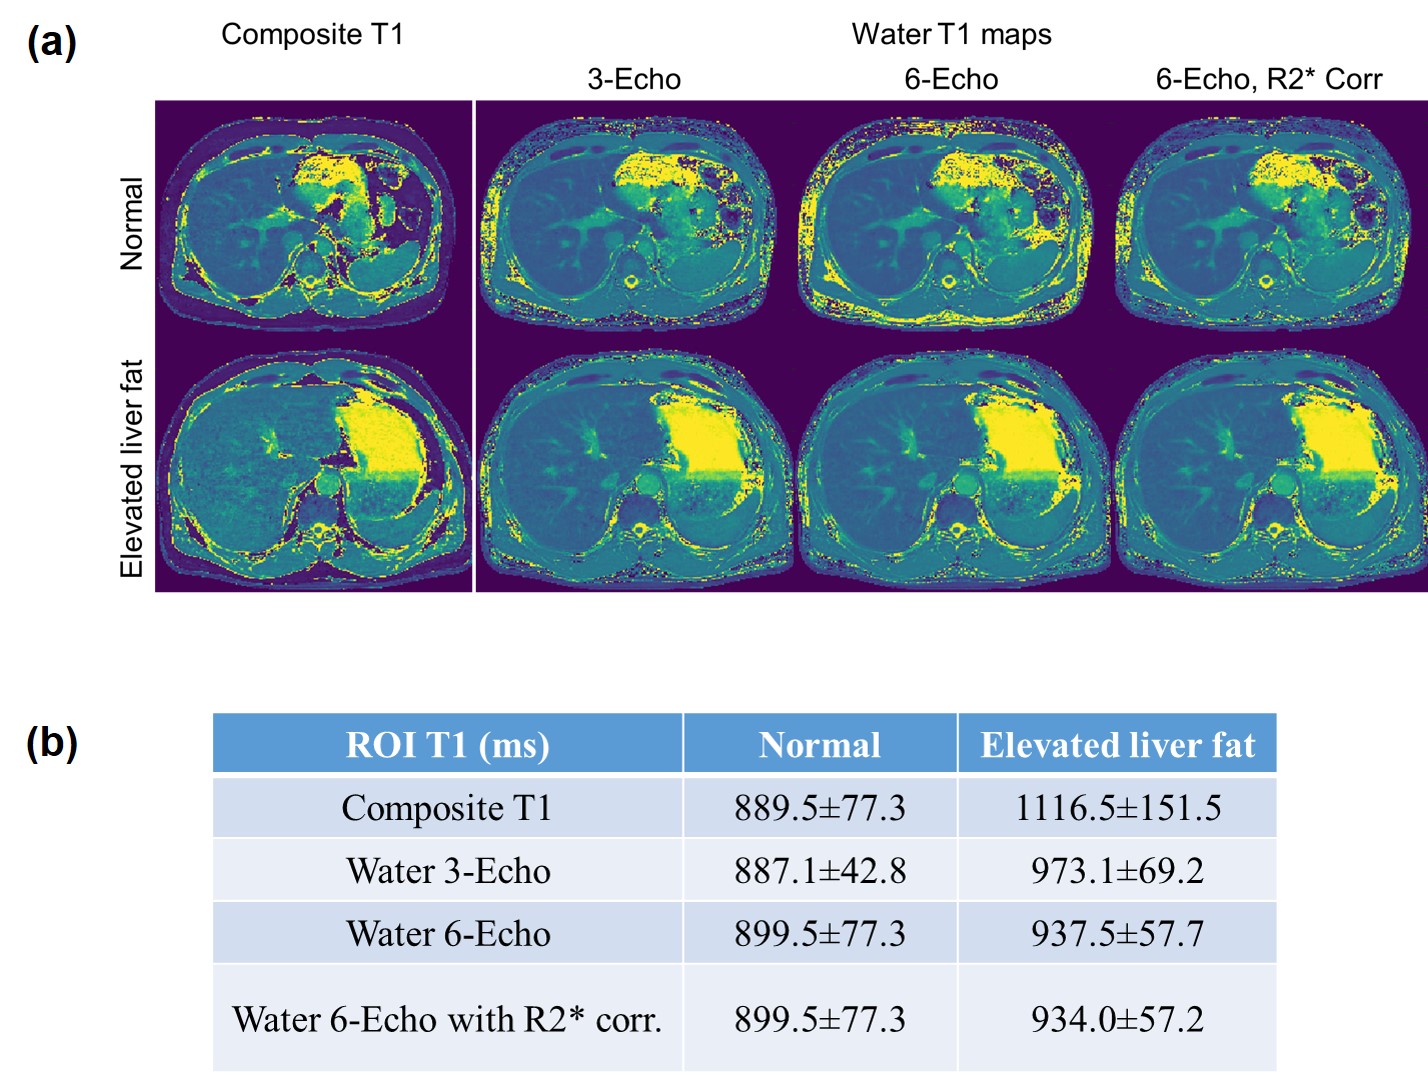
Fig.4 presents two examples of in-vivo results. In Fig.4(a), parameter maps from two of the participating subjects, one of which has elevated level of fat in the liver.The composite T1 maps and the water T1 maps for the subject with higher liver fat has a large difference. For both subjects, the water specific T1 maps from different experiments look similar. Results of ROI analysis are shown in Fig.4(b).
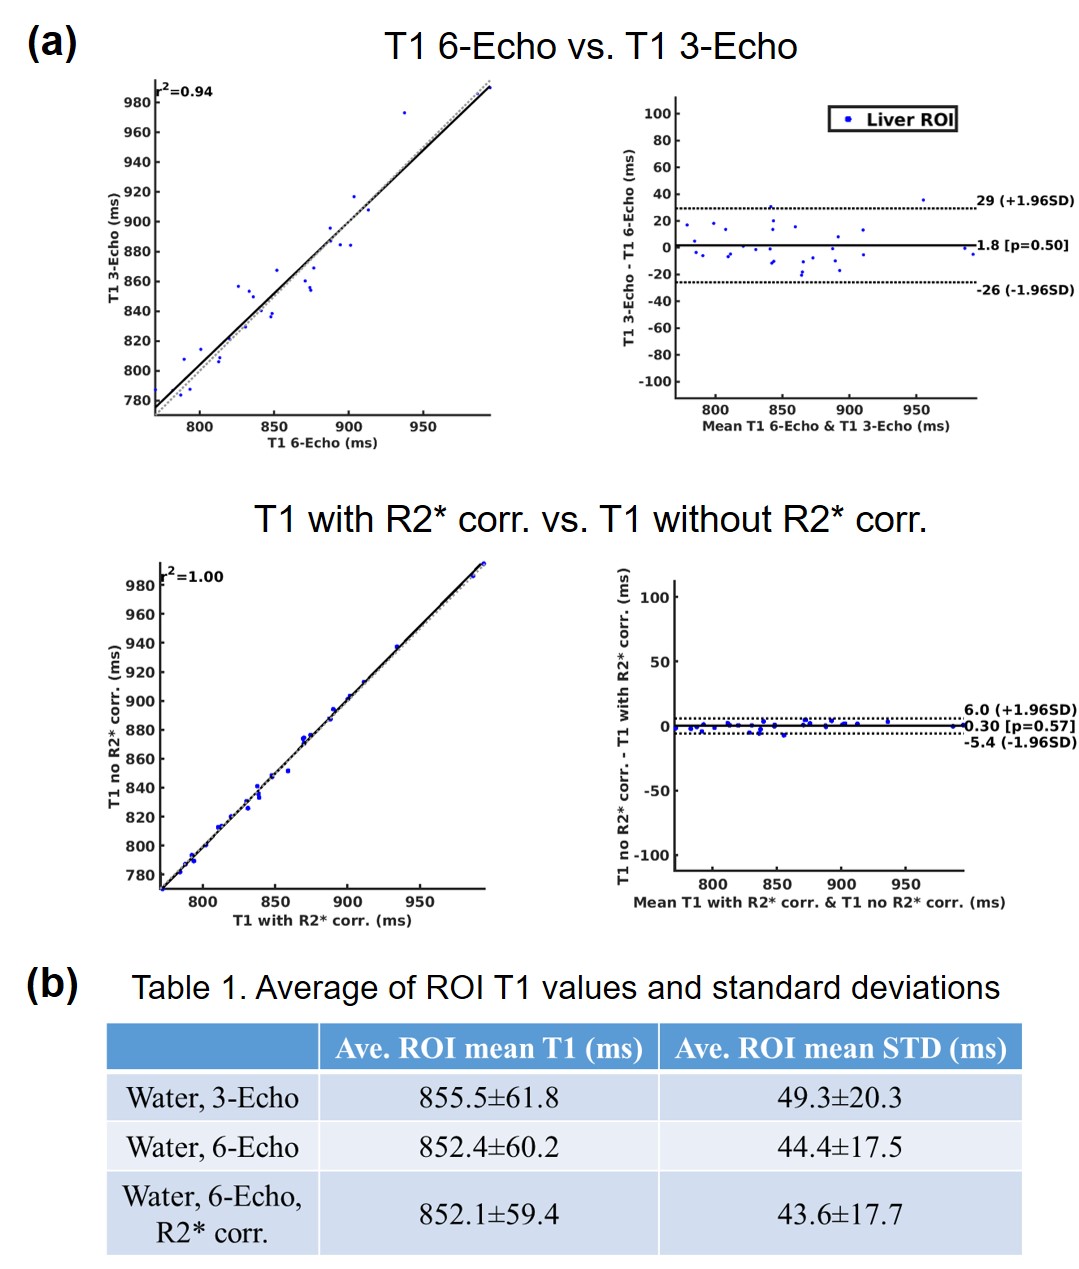
Fig.5 presents the in-vivo results for all 15 subjects. Fig.5(a) shows the Bland-Altman plot between T1 maps from 3-echo and 6-echo sequences, as well as the T1 maps with and without R2* corrections. Fig.5(b) shows the mean T1 values and the standard deviations across 15 subjects that were analyzed.
Conclusion
The numerical simulation performed in this study has indicated that R2* decay does pose an influence on estimation of water-specific T1. However, this influence is small and can be easily overwhelmed by noise in the images. For in-vivo imaging studies, we were not able to observe the influence of R2* decay on water T1 estimation maps. Six echoes can result in better visual image quality for T1 maps, but the resulting T1 values are not significantly different.Acknowledgements
This work was supported in part by NIH research grants: R01-EB009690, U01-EB029427, R01-EB030549, R21-EB032917 and GE Healthcare.References
1. Kim KA, Park MS, Kim IS, et al. Quantitative evaluation of liver cirrhosis using T1 relaxation time with 3 tesla MRI before and after oxygen inhalation. J Magn Reson Imaging. 2012;36(2):405-410. doi:10.1002/jmri.23620
2. Li Z, Sun J, Hu X, et al. Assessment of liver fibrosis by variable flip angle T1 mapping at 3.0T. J Magn Reson Imaging. 2016;43(3):698-703. doi:10.1002/jmri.25030
3. Li Z, Mathew M, Syed AB, Pauly JM, Vasanawala SS. Rapid fat-water separated T 1 mapping using a single-shot radial inversion-recovery spoiled gradient recalled pulse sequence. NMR Biomed. 2022;(July):1-17. doi:10.1002/nbm.4803
4. Feng L, Liu F, Soultanidis G, et al. Magnetization-prepared GRASP MRI for rapid 3D T1 mapping and fat/water-separated T1 mapping. Magn Reson Med. 2021;86(1):97-114. doi:10.1002/mrm.28679
5. Chebrolu VV, Hines CDG, Yu H, et al. Independent estimation of T2* for water and fat for improved accuracy of fat quantification. Magn Reson Med. 2010;63(4):849-857. doi:10.1002/mrm.22300
Figures