1097
Separation of type and grade in cervical tumors using MOLLI T1 mapping and non-mono-exponential models diffusion-weighted MR imaging1the First Affiliated Hospital of Zhengzhou University, Zhengzhou, China, 2Advanced Technical Support, Philips Healthcare, Beijing, China
Synopsis
Keywords: Quantitative Imaging, Microstructure
This study conducted an initial investigation of the feasibility of MOLLI-based T1 mapping and DWI by using mono-exponential, bi-exponential, and DKI models for the noninvasive preoperative evaluation of cervical cancer. Our findings indicated that both T1 mapping and non-mono-exponential model DWI can be used to discriminate cervical cancer from normal cervical tissue and adenocarcinoma from SCC. Our results also achieved a significant information gain for identifying SCC grade by combining native T1 and MKmean. Moreover, the maximum or minimum values of diffusion parameters within the whole lesion had advantages over the mean values in the prediction of SCC grade.Introduction
Diffusion-weighted imaging (DWI) is a well-known functional MRI technique that reflects the random diffusion of water molecules in vivo [1]. Recently, non-mono-exponential models, such as intravoxel incoherent motion (IVIM) and diffusion-kurtosis imaging (DKI), have been used to assess cervical cancer [2, 3]. T1 mapping is another noninvasive MRI technique for quantitative analysis of the intrinsic properties of biological tissues; in this technique, the longitudinal relaxation time (T1 value) in each image voxel is measured [4]. The present study aimed to comprehensively investigate the potential of T1 mapping and non-mono-exponential DWI in the characterization of cervical cancer, specifically in identifying the pathological type, grade.Methods
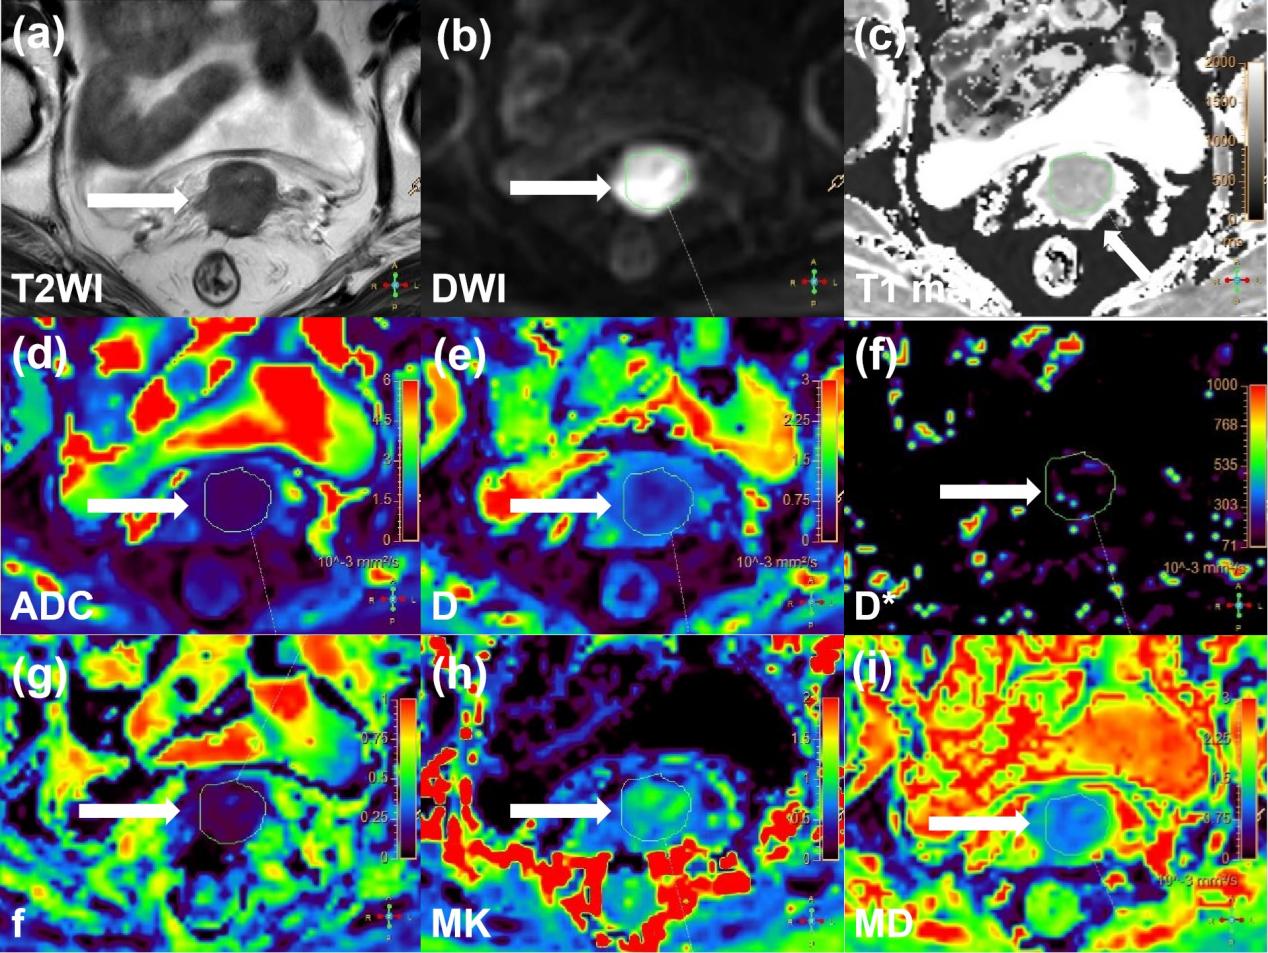
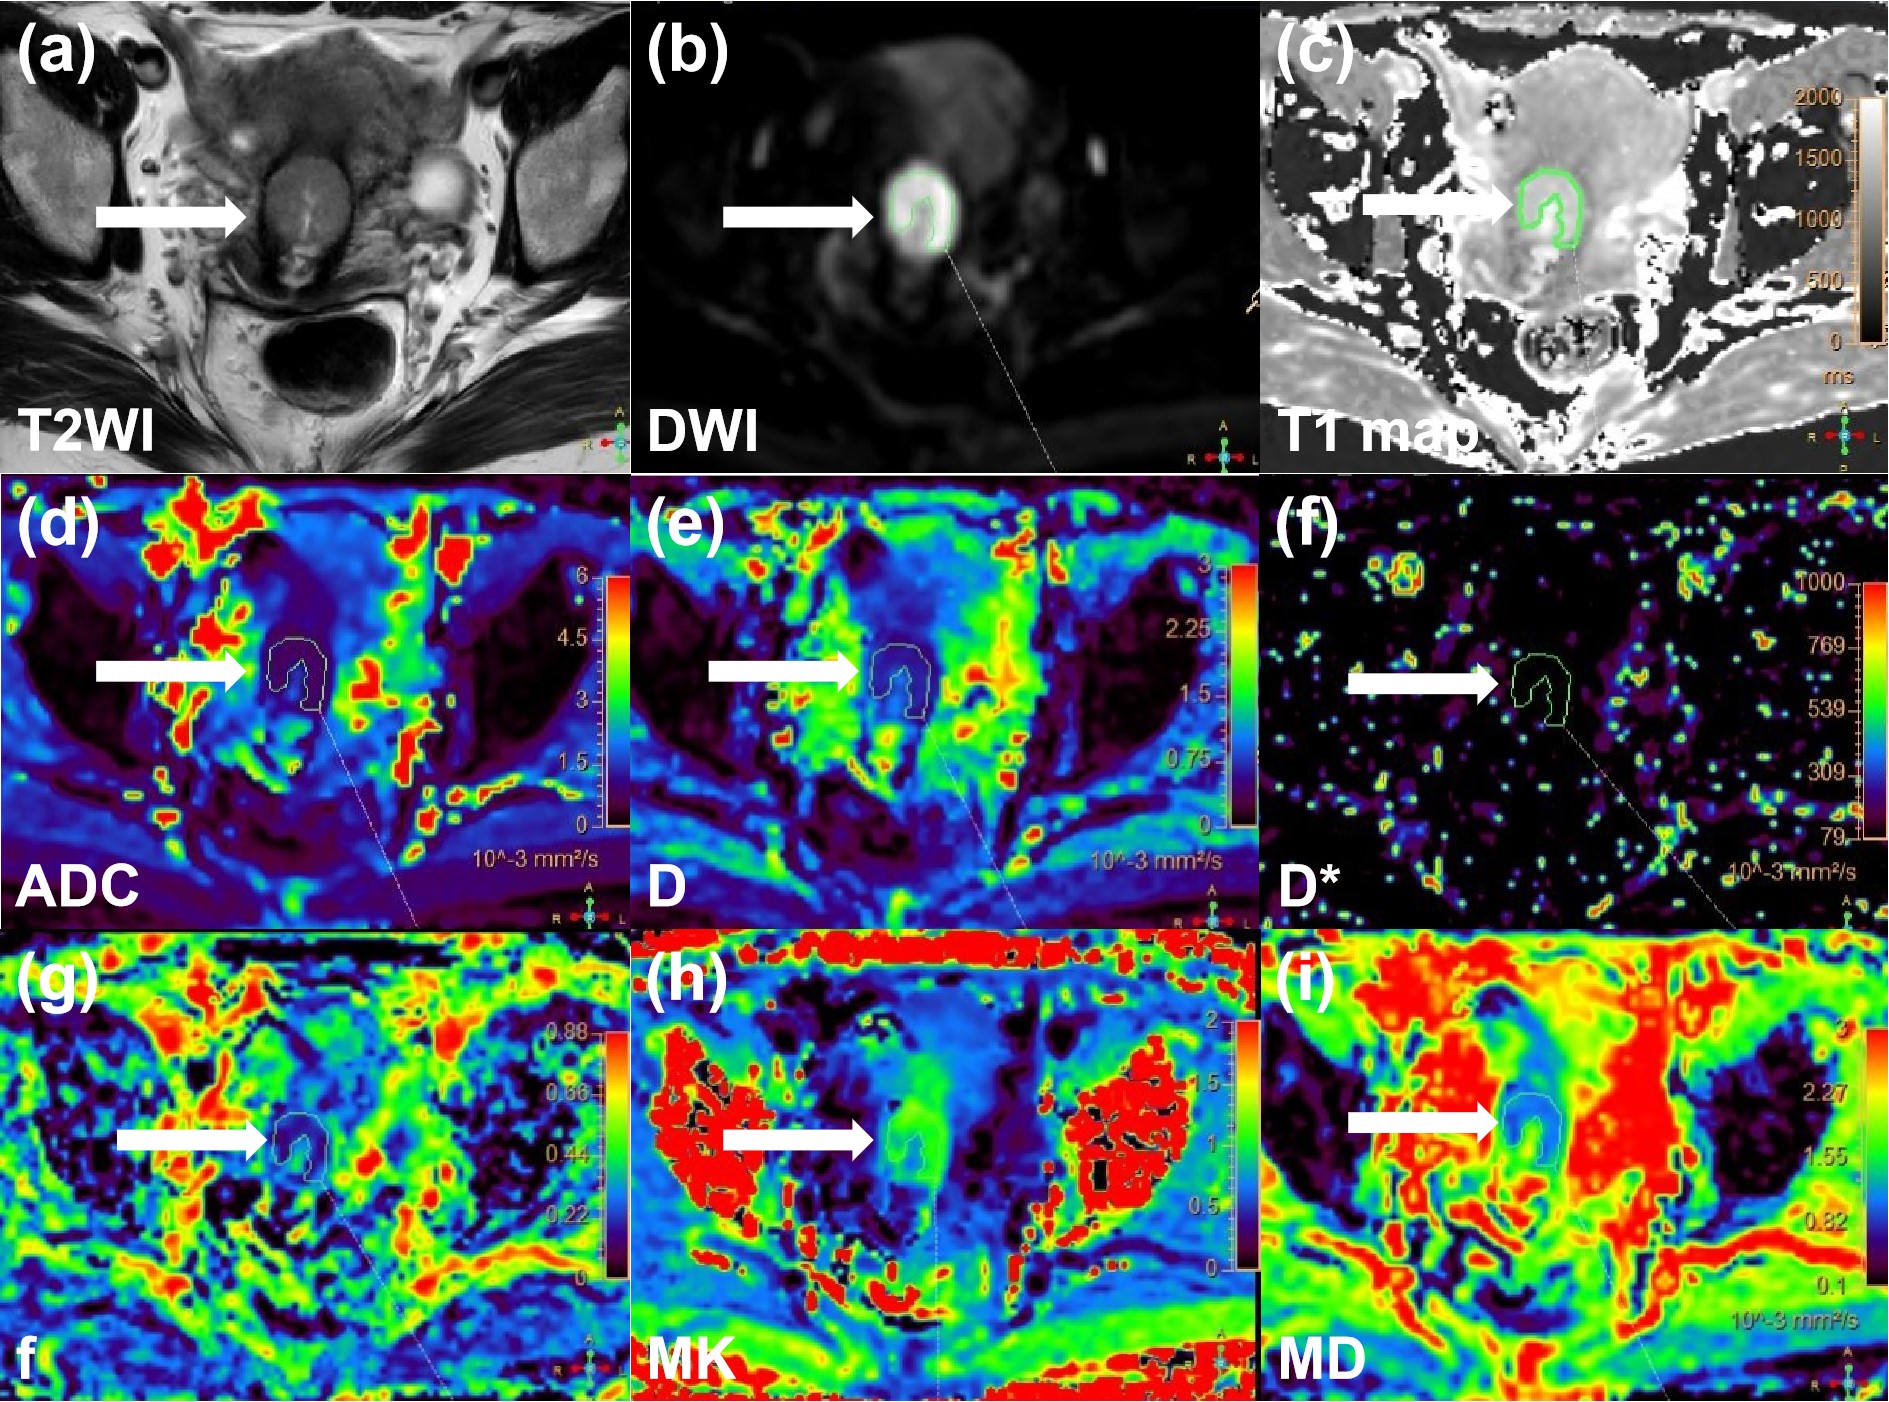
Eighty patients with cervical cancer and 43 patients with normal cervix underwent MRI, including DWI and T1 mapping on a 3T system (Ingenia CX, Philips Healthcare, Best, the Netherlands). Native T1 maps were acquired using the modified Look-Locker inversion recovery (MOLLI) sequence. DWI was obtained in a single-shot echo-planar imaging sequence with diffusion gradient b factors of 0, 10, 20, 50, 100, 200, 400, 800, 1,200, 1,600, and 2,000 s/mm2. Diffusion gradients were applied simultaneously along with three orthogonal directions. DWI images were transferred to a workstation (IntelliSpace Portal V10, Philips Healthcare, the Netherlands) and ADC maps from mono-exponential DWI, D, D*, and f maps from IVIM, and MD and MK maps from DKI data were generated. The polygonal regions of interest (ROIs) were drawn along the inside of the tumour margin on the DWI original maps (b = 1200 s/mm2). The software copies all ROIs to the ADC, D, D*, f, MD, MK, and native T1 map to calculate the average and minimum or maximum values. In the control group, three to four consecutive slices with the largest cervical area were selected. ROIs included all cervical stroma and excluded the mucosa. The parameters were recorded as follows: mean native T1 (native T1), mean ADC (ADCmean), minimum ADC (ADCmin), mean D (Dmean), minimum D (Dmin), mean D* (D*), mean f (f), mean MD (MDmean), minimum MD (MDmin), mean MK (MKmean), and maximum MK (MKmax). Parameter differences were assessed between different tumor types and grades. The diagnostic performances of these parameters were calculated using receiver operating characteristic (ROC) curve analyses.Results
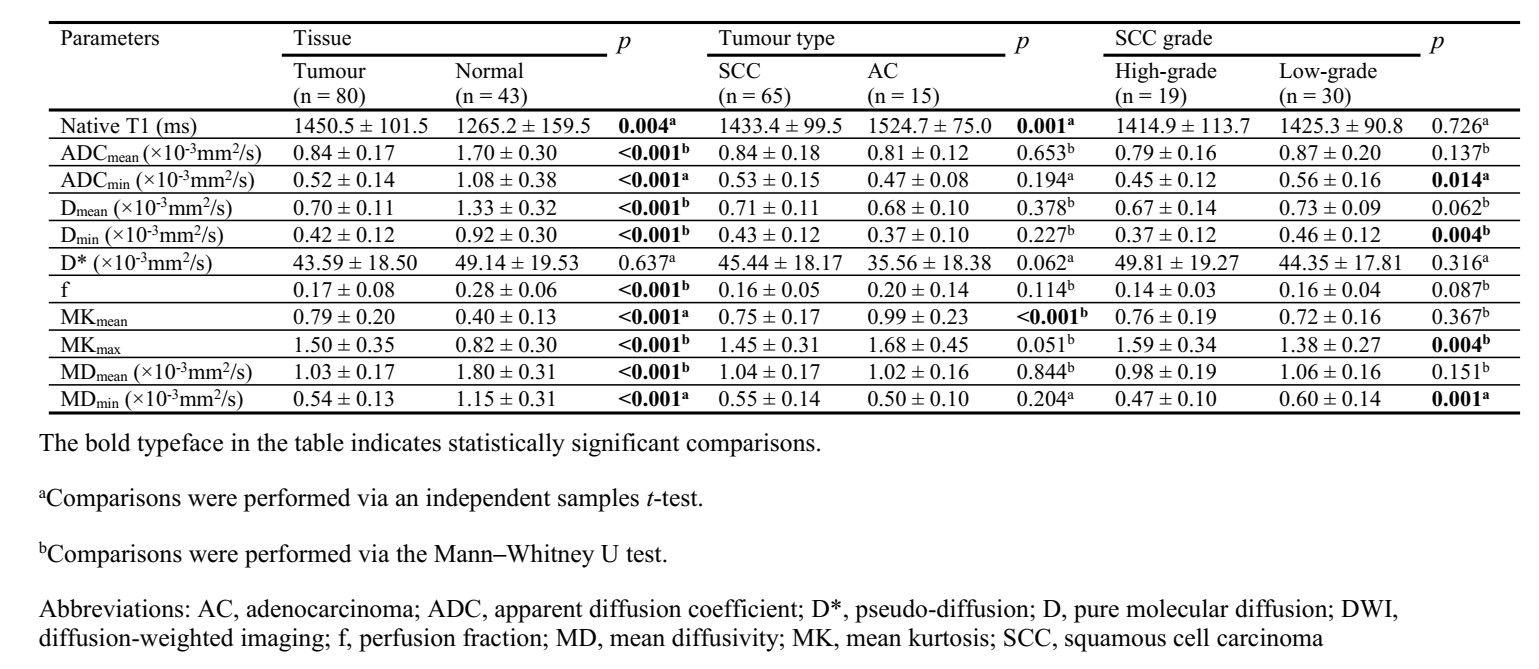
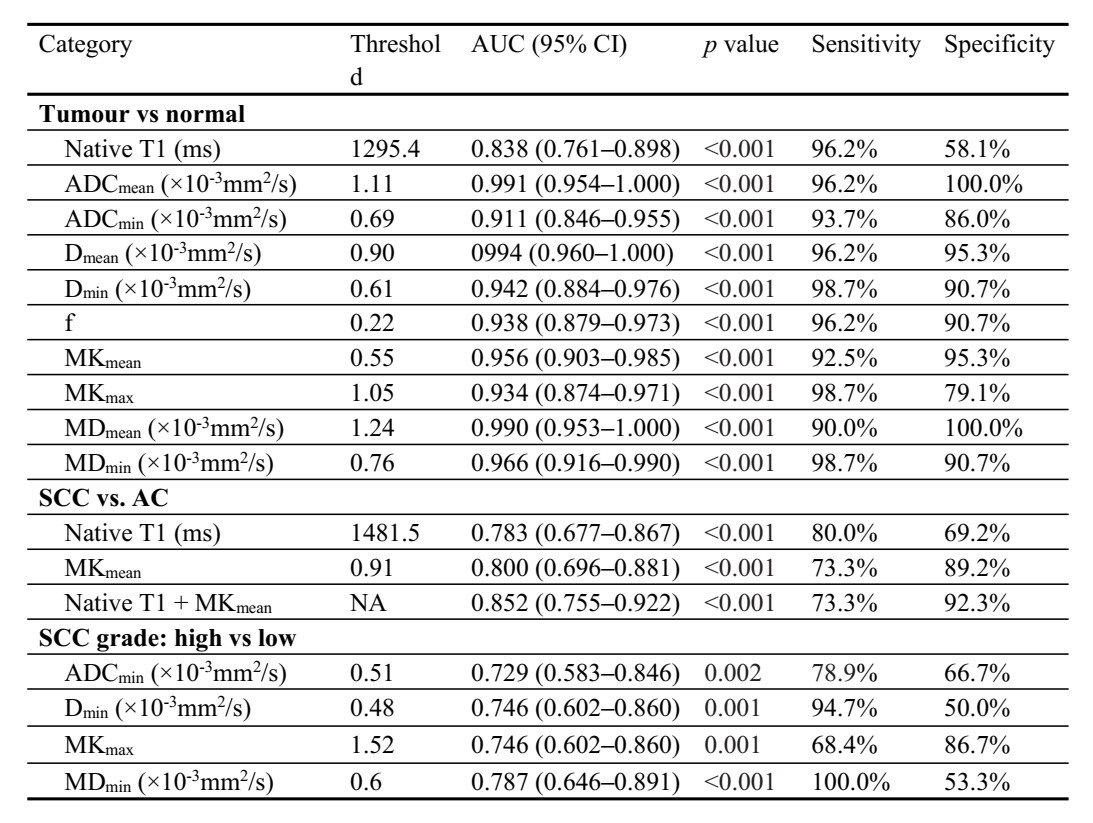
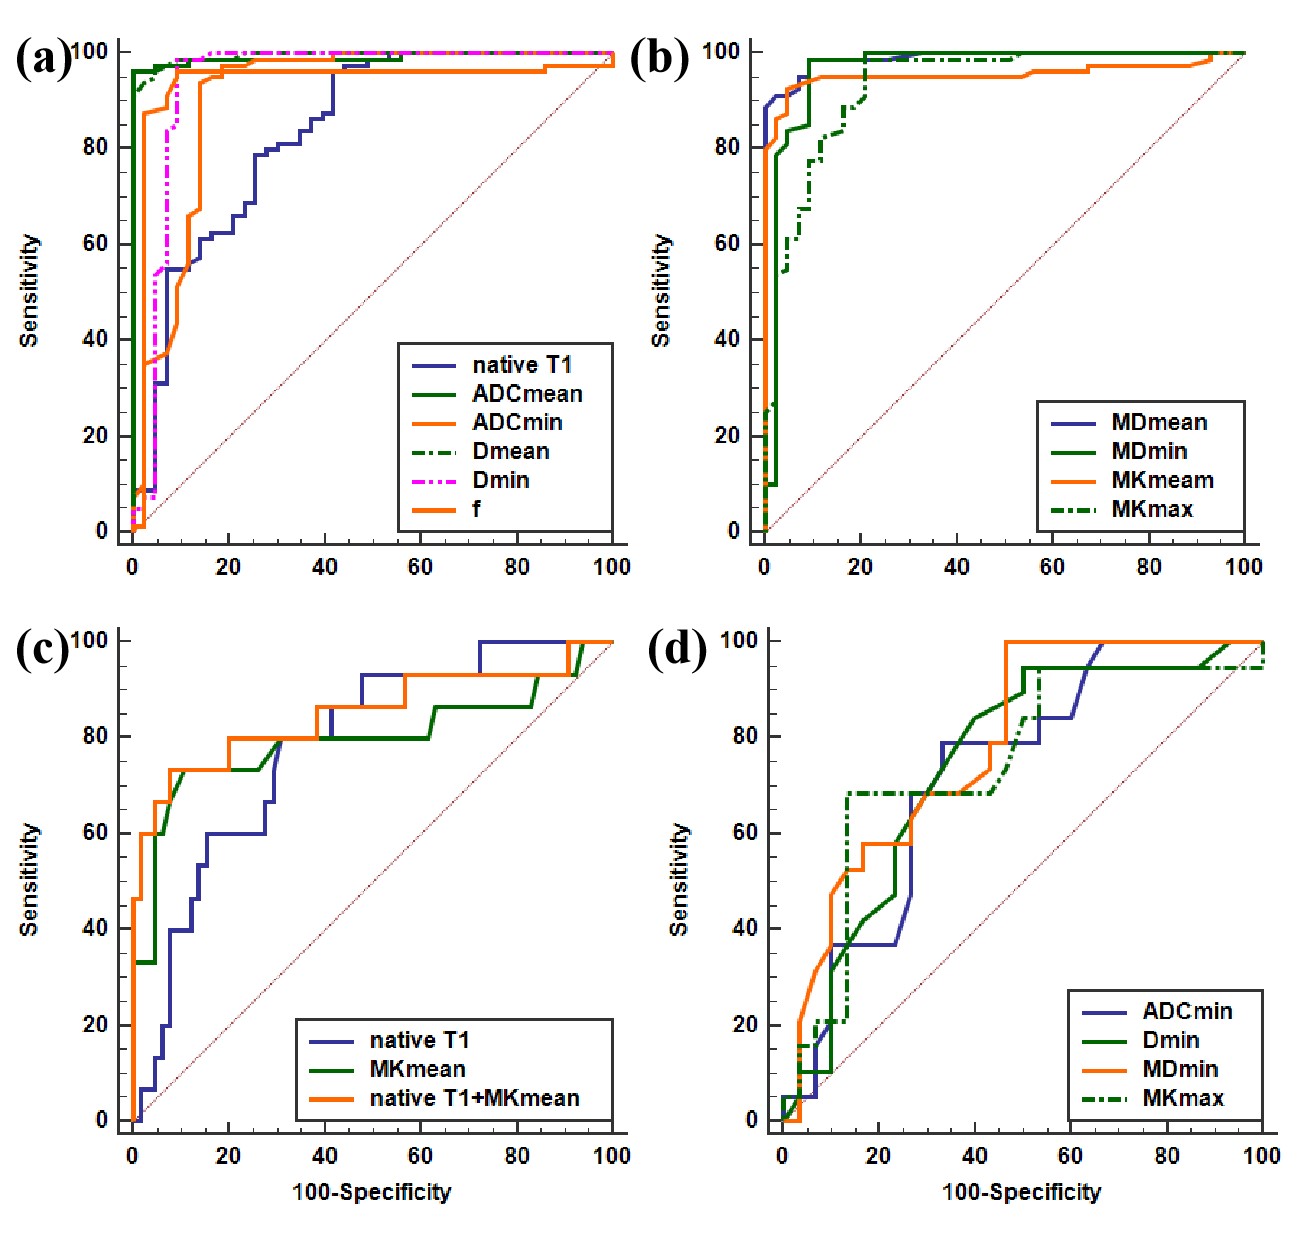
Native T1 and DWI-derived parameters were significantly different between cervical cancer and normal cervix (all p < 0.05), except D* (p = 0.637). Native T1 and MKmean varied significantly between squamous cell carcinoma (SCC) and adenocarcinoma (both p < 0.05) (Figure 2, 3). ADCmin, Dmin, and MDmin were significantly lower while MKmax was significantly higher in the high-grade SCC group than in the low-grade SCC group (all p < 0.05) (Table 1). The areas under the receiver operating characteristic curve (AUCs) for native T1 and DWI-derived parameters to distinguish cervical cancer and normal cervix ranged from 0.838 to 0.994, with Dmean showing the best discriminative value. The AUCs for Native T1 and MKmean to distinguish SCC and adenocarcinoma were 0.783 and 0.800, respectively, with no significant difference (p = 0.832). Combining MKmean and native T1 improved the AUC to 0.852, which was significantly higher than that for MKmean (p = 0.032). The AUCs for ADCmin, Dmin, MDmin, and MKmax to predict high-grade SCC were 0.787, 0.746, 0.746, and 0.729, respectively, and there were no significant differences in AUCs among the different parameters (all p > 0.05) (Table 2, Figure 3).Discussion
The findings of this study indicated that MOLLI-based T1 mapping and multi-model DWI can be used to distinguish cervical cancer from the normal cervix and SCC from adenocarcinoma. Different from SCC, adenocarcinoma originates from endocervical cells with abundant glandular structures and strong secretion function, which may lead to increased water content and macromolecular concentrations in tumour tissue and thus increased native T1. In addition, Our analyses revealed that non-mono-exponential model DWI had advantages over mono-exponential model in the identification of histological subtype, and ADCmin, Dmin, MDmin, and MKmax had advantages over ADCmean, Dmean, MDmean, and MKmean in the prediction of SCC grade. The measurement of mean values of diffusion parameters may be subject to underestimation of tumor cellularity, especially when the tumour contains more areas of micronecrosis, whereas the minimum values of ADC , D, and MD correspond to the lowest tumor diffusion region, which may be the most actively proliferating area [5]. Similarly, the maximum value of MK indicates the maximum heterogeneity of tumors, which is also an important feature of high-grade tumors.Conclusion
The current findings indicate that both MOLLI-based T1 mapping and non-mono-exponential model DWI can be used to discriminate cervical cancer from normal cervical tissue and cervical adenocarcinoma from SCC. Moreover, the maximum or minimum values of diffusion parameters within the whole lesion had advantages over the mean values in the prediction of SCC grade.Acknowledgements
No acknowledgementReferences
[1] Liu Y, Ye Z, Sun H, et al. Clinical application of diffusion-weighted magnetic resonance imaging in uterine cervical cancer. Int J Gynecol Cancer 2015;25:1073.
[2] Song J, Lu Y, Wang X, et al. A comparative study of four diffusion-weighted imaging models in the diagnosis of cervical cancer. Acta Radiol 2022;63:536.
[3] Perucho JAU, Chang HCC, Vardhanabhuti V, et al. B-Value optimization in the estimation of intravoxel incoherent motion parameters in patients with cervical cancer. Korean J Radiol 2020;21:218-27.
[4] Taylor AJ, Salerno M, Dharmakumar R, Jerosch-Herold M. T1 mapping: basic techniques and clinical applications. JACC Cardiovasc Imaging 2016;9:67.
[5] Liu Y, Zhang Y, Cheng R, et al. Radiomics analysis of apparent diffusion coefficient in cervical cancer: A preliminary study on histological grade evaluation. J Magn Reson Imaging 2019;49:280-90.
Figures