1096
New semi-quantitative contrasts can approximate R1 and R2 in clinical setting1The Hebrew University, Jerusalem, Israel
Synopsis
Keywords: Quantitative Imaging, Signal Representations
Weighted MRI images are widely used in both clinical and open-source datasets, while quantitative mapping is not always feasible. The ratio of T1 and T2 weighted images was previously suggested as a semi-quantitative measurement. We propose two additional weighted ratios T1w/PDw and ln(T2w/PDw), as semi-quantitative proxies for R1 and R2, which we tested on phantom and human data. We found that the new ratios accurately represent the quantitative parameters in both datasets.
Introduction
Quantitative MRI (qMRI) allows to study the brain's microstructure. It has been recently proposed that with qMRI and relevant biophysical modeling, histological information about the human brain can be obtained in vivo1. Nevertheless, in clinical settings, qMRI is rarely used. Clinical assessment using MRI is typically based only on weighted images, that are not suitable for microstructural analysis of brain tissue’s biophysical properties. Similarly, many large open-source dataset of neurological disorders (e.g., PPMI, ADNI, UK-Biobank) have a large database of weighted images. Therefore, there is a great benefit in linking the widely available clinical MRI weighted data to known qMRI parameters.In recent years, the ratio of T1 and T2 weighted images (T1w/T2w) has been suggested as a semi-quantitative indicator of tissue integrity and myelination2-3 and was linked to the pathology of Parkinson's disease4. In this study, we propose using two additional weighted images ratios based on proton-density weighted image (PDw). We show that T1w/PDw and ln(T2w/PDw) can optimally represent the qMRI parameters R1 and R2 in the clinical setting. This was validated both on a controlled lipid phantom system and on a human dataset.
Methods
Phantoms: Lipid phantom qMRI and weighted data was obtained from Shtangel et al5. In short, 4 types of lipid mixtures were produced (phosphatidylcholine – PC; phosphatidylcholine+cholesterol – PC:chol; phosphatidylserine - ps; sphingomyelin – spg), at different concentrations. The samples were placed in the MRI and scanned at various sequences.Human subjects: qMRI and weighted data of 37 healthy individuals age 41$$$\pm$$$19.6 was obtained from Filo et al6.
qMRI: The SPGR and multi-SE scans parameters and R1 and R2 mapping are as described in Filo et al6,7.
Weighted images: We used the same data from the qMRI analysis:
T1w - SPGR (TR=19 ms, TE=3.34 ms, $$$\alpha$$$=30°)
T2w – fast-SE (TR=4.21 s, TE=120 ms)
PDw – fast-SE (TR=4.21 s, TE=12 ms)
All weighted images underwent bias field correction by ANTs8.
All data were acquired using 3T Siemens MAGNETOM Skyra scanner.
Signal modeling and Synthetic data: Synthetic weighted images were produced by plugging the quantitative maps (R1 and R2) in the relevant signal equations.
The spoiled gradient echo (Eq. 1) for T1w and the spin-echo (Eq. 2) for T2w:
$$SPGR=M0\cdot\exp(-\frac{TE_{T1}}{T2^*})\cdot\frac{\sin(\alpha)(1-\exp(-\frac{TR}{T1}))}{1-\cos(\alpha)\exp(-\frac{TR}{T1})}\quad\quad(1)$$
$$SE=M0\cdot\exp(-\frac{TE_{T2}}{T2})\quad\quad(2)$$
Where $$$\alpha$$$ is the flip angle, TR is repetition time, and TE is the echo time.
For short echoes, we can assume $$$\exp(-\frac{TE_{T1}}{T2^*})\sim1$$$.
The PDw contrast is dominated by M0 ($$$M0=PD\cdot Gains$$$). When we divide Eq. 1 by the PDw contributions, we get a pure T1w signal. Hence, we assumed that $$$\frac{T1w}{PDw}$$$, will provide a better approximation of the R1 contrast:
$$\frac{T1w}{PDw}=\frac{\sin(\alpha)(1-\exp(-\frac{TR}{T1}))}{1-\cos(\alpha)\exp(-\frac{TR}{T1})}\quad\quad(3)$$
The same heuristics also applies for Eq. 2: $$\frac{T2w}{PDw}=\exp(-\frac{TE_{T2}}{T2})$$
Appling $$$ln$$$ operation on $$$\frac{T2w}{PDw}$$$ provides a linear function of R2: $$\ln(\frac{T2w}{PDw})=-TE_{T2}\cdot R2\quad\quad(4)$$
For the synthetic T1w images, we use Eq. 1 and assume $$$\exp(-\frac{TE_{T1}}{T2^*})\sim1,\alpha=30$$$°,TR=18. For synthetic T2w images, we use Eq. 2 with TRT2=120 ms. We assume that after coil biases are removed, synthetic PDw contrast can be best represented by Eq. 2 given a short TEPD=12 ms.
Results
To validate that the ratio of weighted images can approximate the quantitative parameters, we first used synthetic images of T1w/PDw and ln(T2w/PDw). We found a 1:1 correlation with the R1 and R2 maps, in phantom and human data (R2=1, Fig 1D Fig 2D).Next, we tested the real weighted images. In phantoms, we calculated the correlation of R1 with either T1w, T1w/T2w, and T1w/PDws. We found the strongest correlation to be with T1w/PDw (R2=0.901,p<10-7; Fig. 1A-C).
Similarly, we calculated the correlation of R2 with either T2w, T1w/T2w and ln(T2w/PDw), and found the strongest correlation to be with ln(T2w/PDw) (R2=0.956, p<10-7; Fig. 2A-C).
Next, we replicated this analysis on human subjects (n=37). We found a similar quality of approximation of R1 using both T1w/T2w and T1w/PDw (R2=0.63$$$\pm$$$0.048 and R2=0.62$$$\pm$$$0.072, respectively, Fig 4A). For R2, the best approximation was achieved with the new contrast ln(T2w/PDw) (R2=0.83$$$\pm$$$0.143; Fig. 4B). Fig 3 shows the voxel-wise histograms of a representative subject.
We found that in phantoms, the semi-quantitative approximations are better than in vivo data, and that R2 is better explained by semi-quantitative contrasts than R1. We attribute the discrepancies between phantom and human data to imperfections in registration and bias correction in vivo. We attribute the higher agreement with R2 to the fact that both T2w and PDw images come from the same FSE sequence and therefore allow a better cancelation of such imperfections using the ratio operation.
Conclusions
Our study suggests new semi-quantitative contrasts, T1w/PDw and ln(T2w/PDw), as practical proxies to the quantitative maps of R1 and R2 in clinical data. Furthermore, we showed these new contrasts represent the quantitative measurements better than the weighted images T1w and T2w, and can complement to the previously introduced T1w/T2w contrast.The approach we present here may therefore be applied to a variety of clinical datasets, such as PPMI, ADNI and UK Biobank, to explore the connections between microstructural changes in the brain and different pathologies, such as Parkinson’s and Alzheimer’s diseases. Furthermore, since weighted images are widely used in clinical diagnosis, our approach may become a practical tool to assess different microstructural contributions in clinical setting.
Acknowledgements
No acknowledgement found.References
- Weiskopf, Nikolaus, et al. "Advances in MRI-based computational neuroanatomy: from morphometry to in-vivo histology." Current opinion in neurology 28.4 (2015): 313-322
- Glasser, Matthew F., and David C. Van Essen. "Mapping human cortical areas in vivo based on myelin content as revealed by T1-and T2-weighted MRI." Journal of neuroscience 31.32 (2011): 11597-11616.
- Baum, Graham L., et al. "Graded Variation In T1w/T2w Ratio During Adolescence: Measurement, Caveats, and Implications for Development of Cortical Myelin." Journal of Neuroscience 42.29 (2022): 5681-5694.
- Drori, Elior, Shai Berman, and Aviv A. Mezer. "Mapping microstructural gradients of the human striatum in normal aging and Parkinson’s disease." Science advances 8.28 (2022): eabm1971.
- Shtangel, Oshrat, and Aviv A. Mezer. "A phantom system for assessing the effects of membrane lipids on water proton relaxation." NMR in Biomedicine 33.4 (2020): e4209.
- Filo, Shir, et al. "Disentangling molecular alterations from water-content changes in the aging human brain using quantitative MRI." Nature communications 10.1 (2019): 1-16.
- Dowell, N. G. and Wood, T. C. T2: Transverse Relaxation Time. in Quantitative MRI of the Brain: Principles of Physical Measurement (eds. Cercignani, M., Dowell, N. G., and Tofts, P. S.) 83-96 ( CRC Press, Boca Raton, 2021).
- Tustison, Nicholas J., et al. "Large-scale evaluation of ANTs and FreeSurfer cortical thickness measurements." Neuroimage 99 (2014): 166-179.
Figures
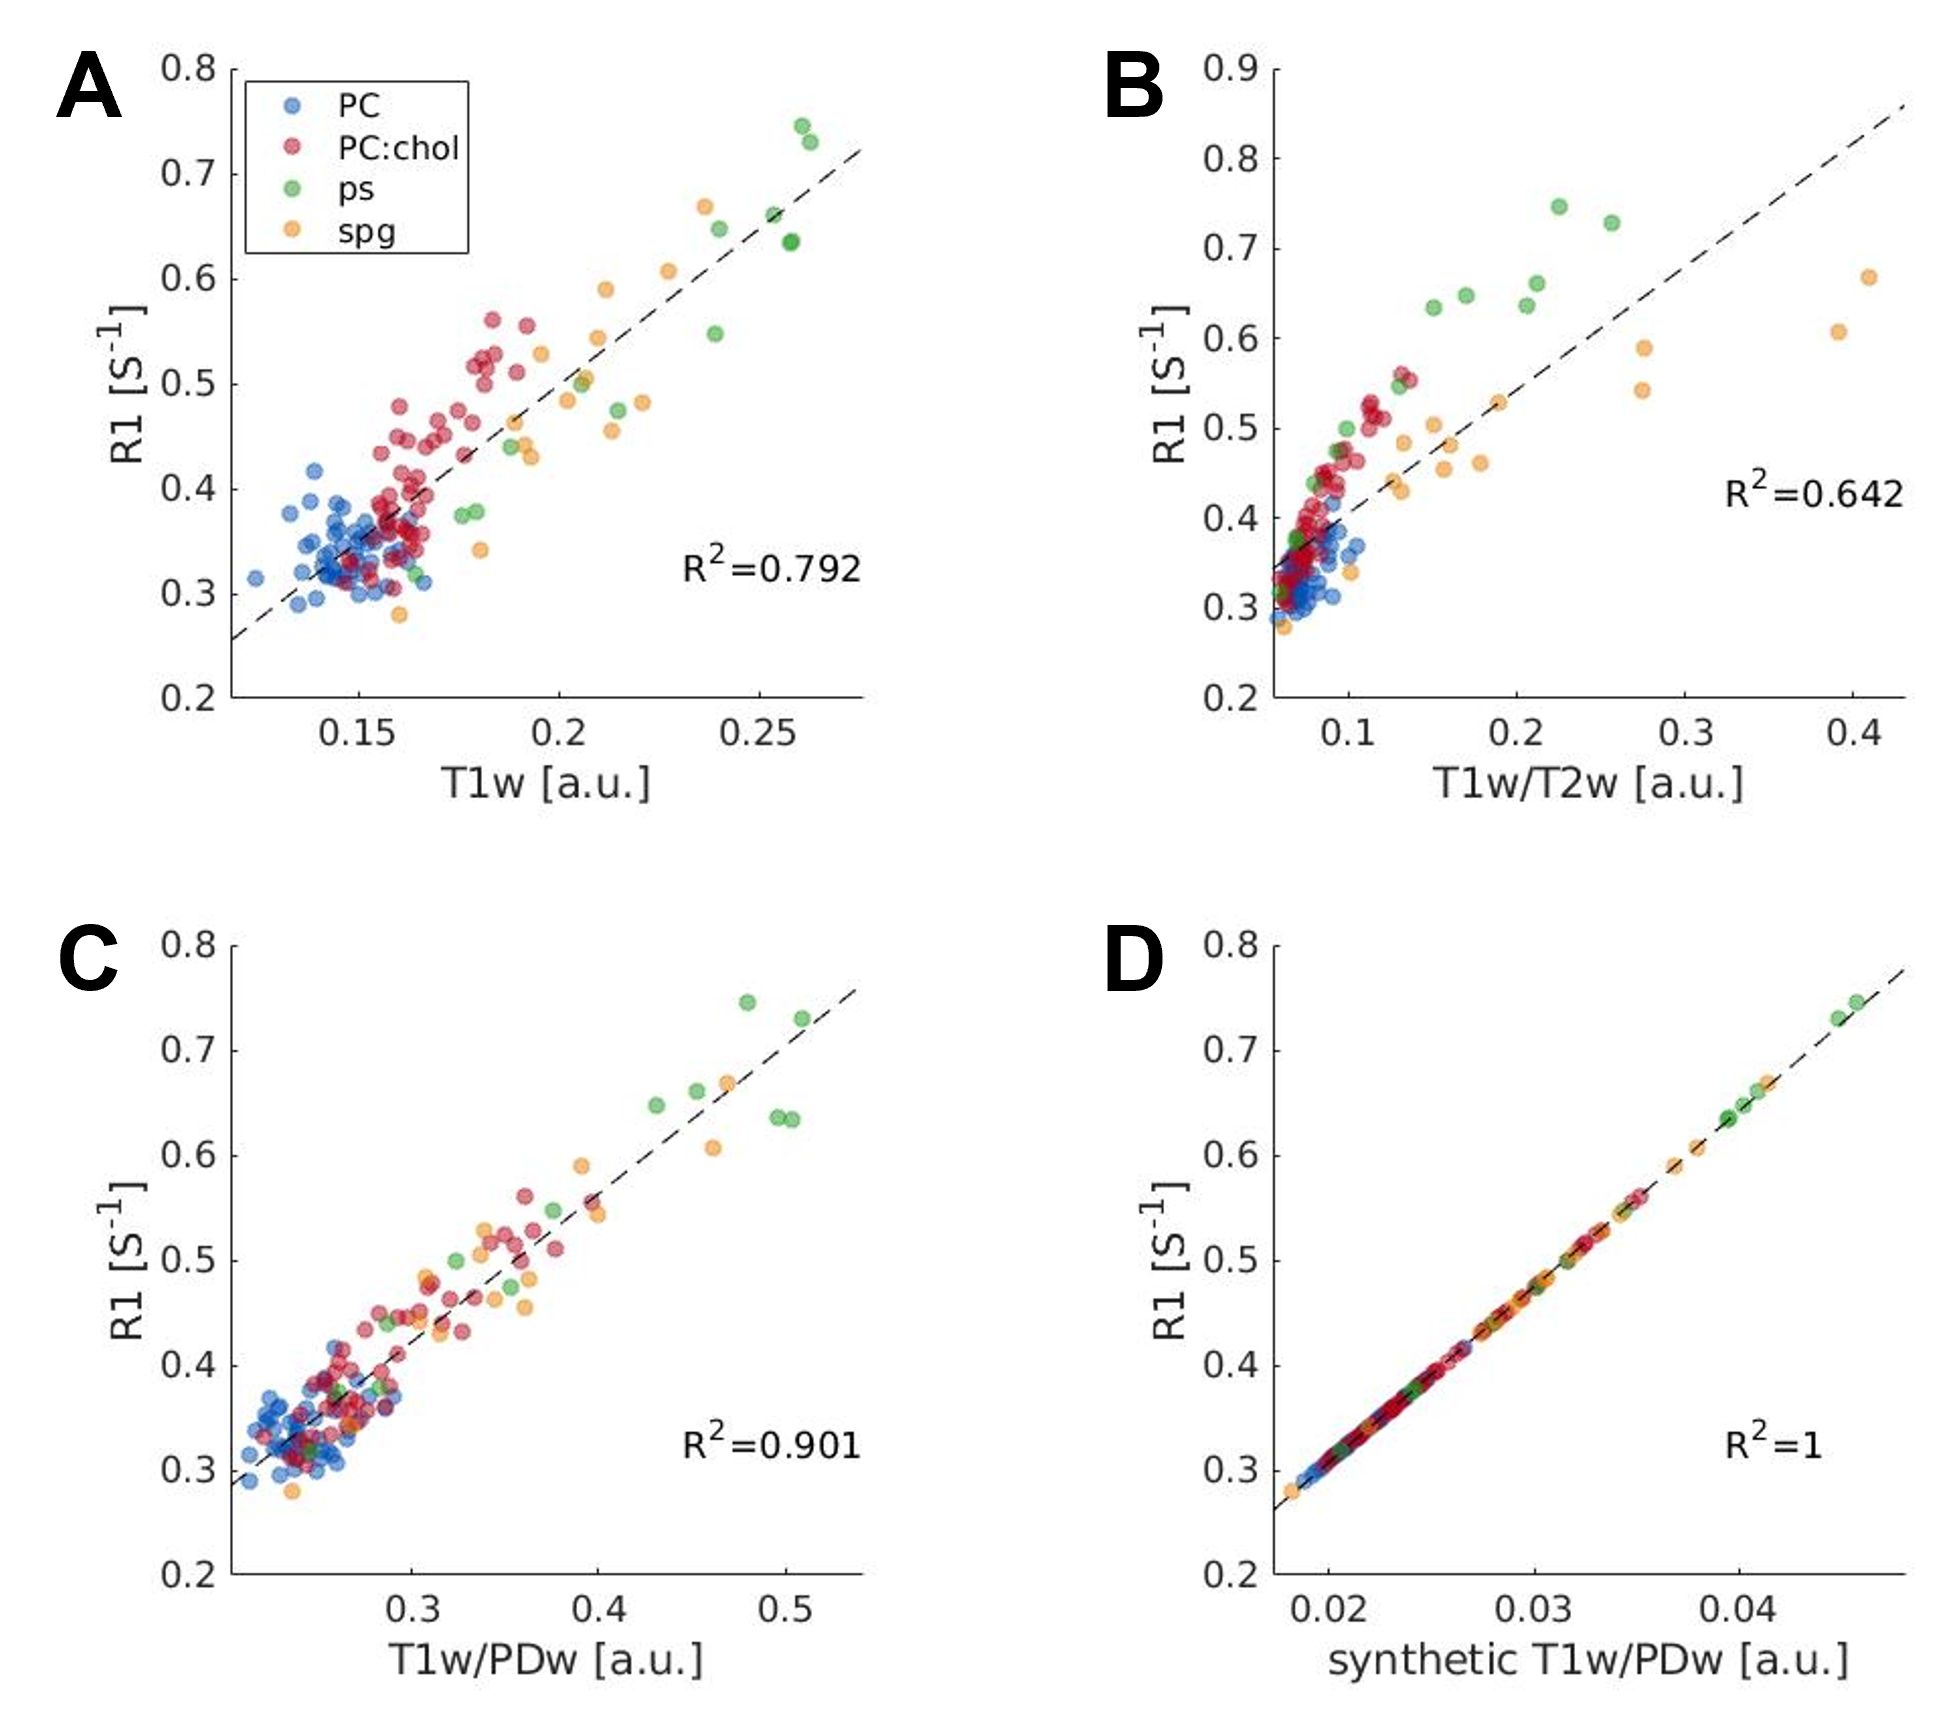
Fig. 1 – T1w/PDw best approximates quantitative R1 in phantoms
Correlations between R1 map and different weighted images: A T1w; B T1w/T2w; C T1w/PDw; and D synthetic T1w/PDw. The synthetic contrast yields 1:1 correlation. Our suggested T1w/PDw contrast yields the highest correlation with R1, out of the real images. Data points are phantom samples’ medians, with replications for each lipid type. Colors represent each lipid type. Black dashed line is the regression line. Correlation coefficients are presented on each panel (R2).
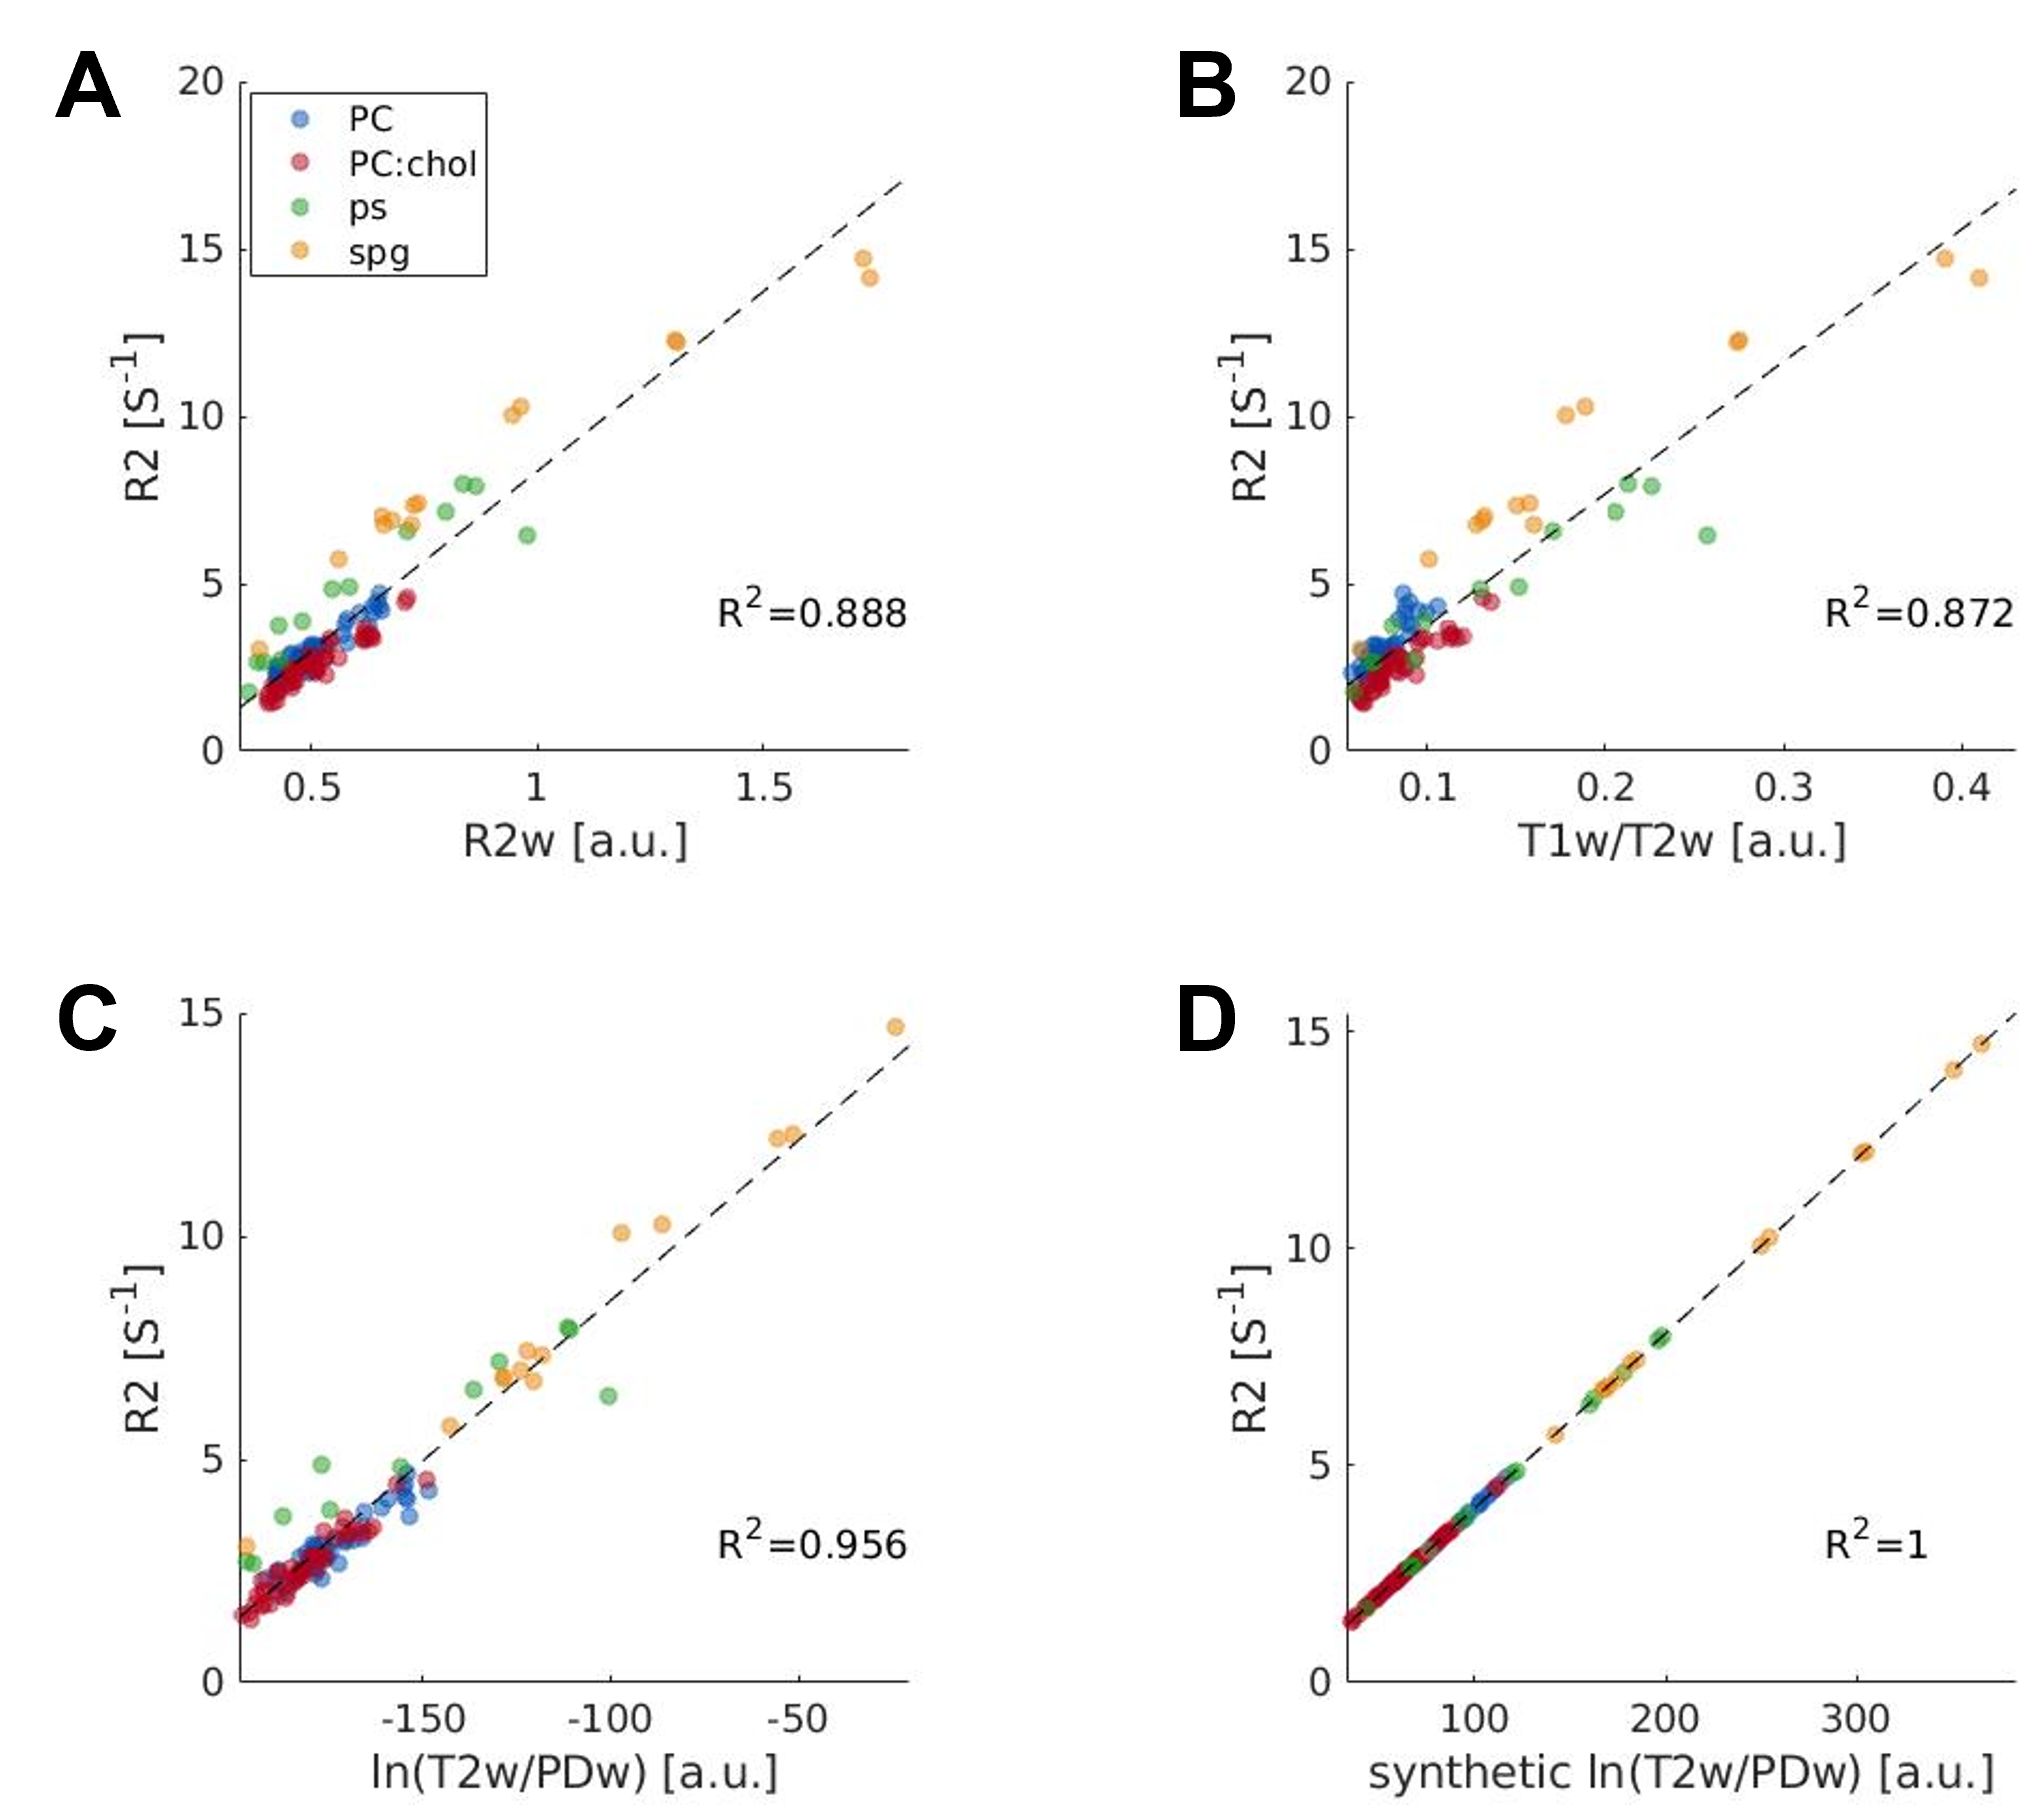
Fig. 2 – ln(T2w/PDw) best approximates R2 in phantoms
Correlations between R2 map and different weighted images: A R2w; B T1w/T2w; C ln(T2w/PDw); and D synthetic ln(T2w/PDw). The synthetic contrast yields 1:1 correlation. Our suggested ln(T2w/PDw) contrast yields the highest correlation with R2, out of the real images. Data points are phantom samples’ medians, with replications for each lipid type. Colors represent each lipid type. Black dashed line is the regression line. Correlation coefficients are presented on each panel (R2).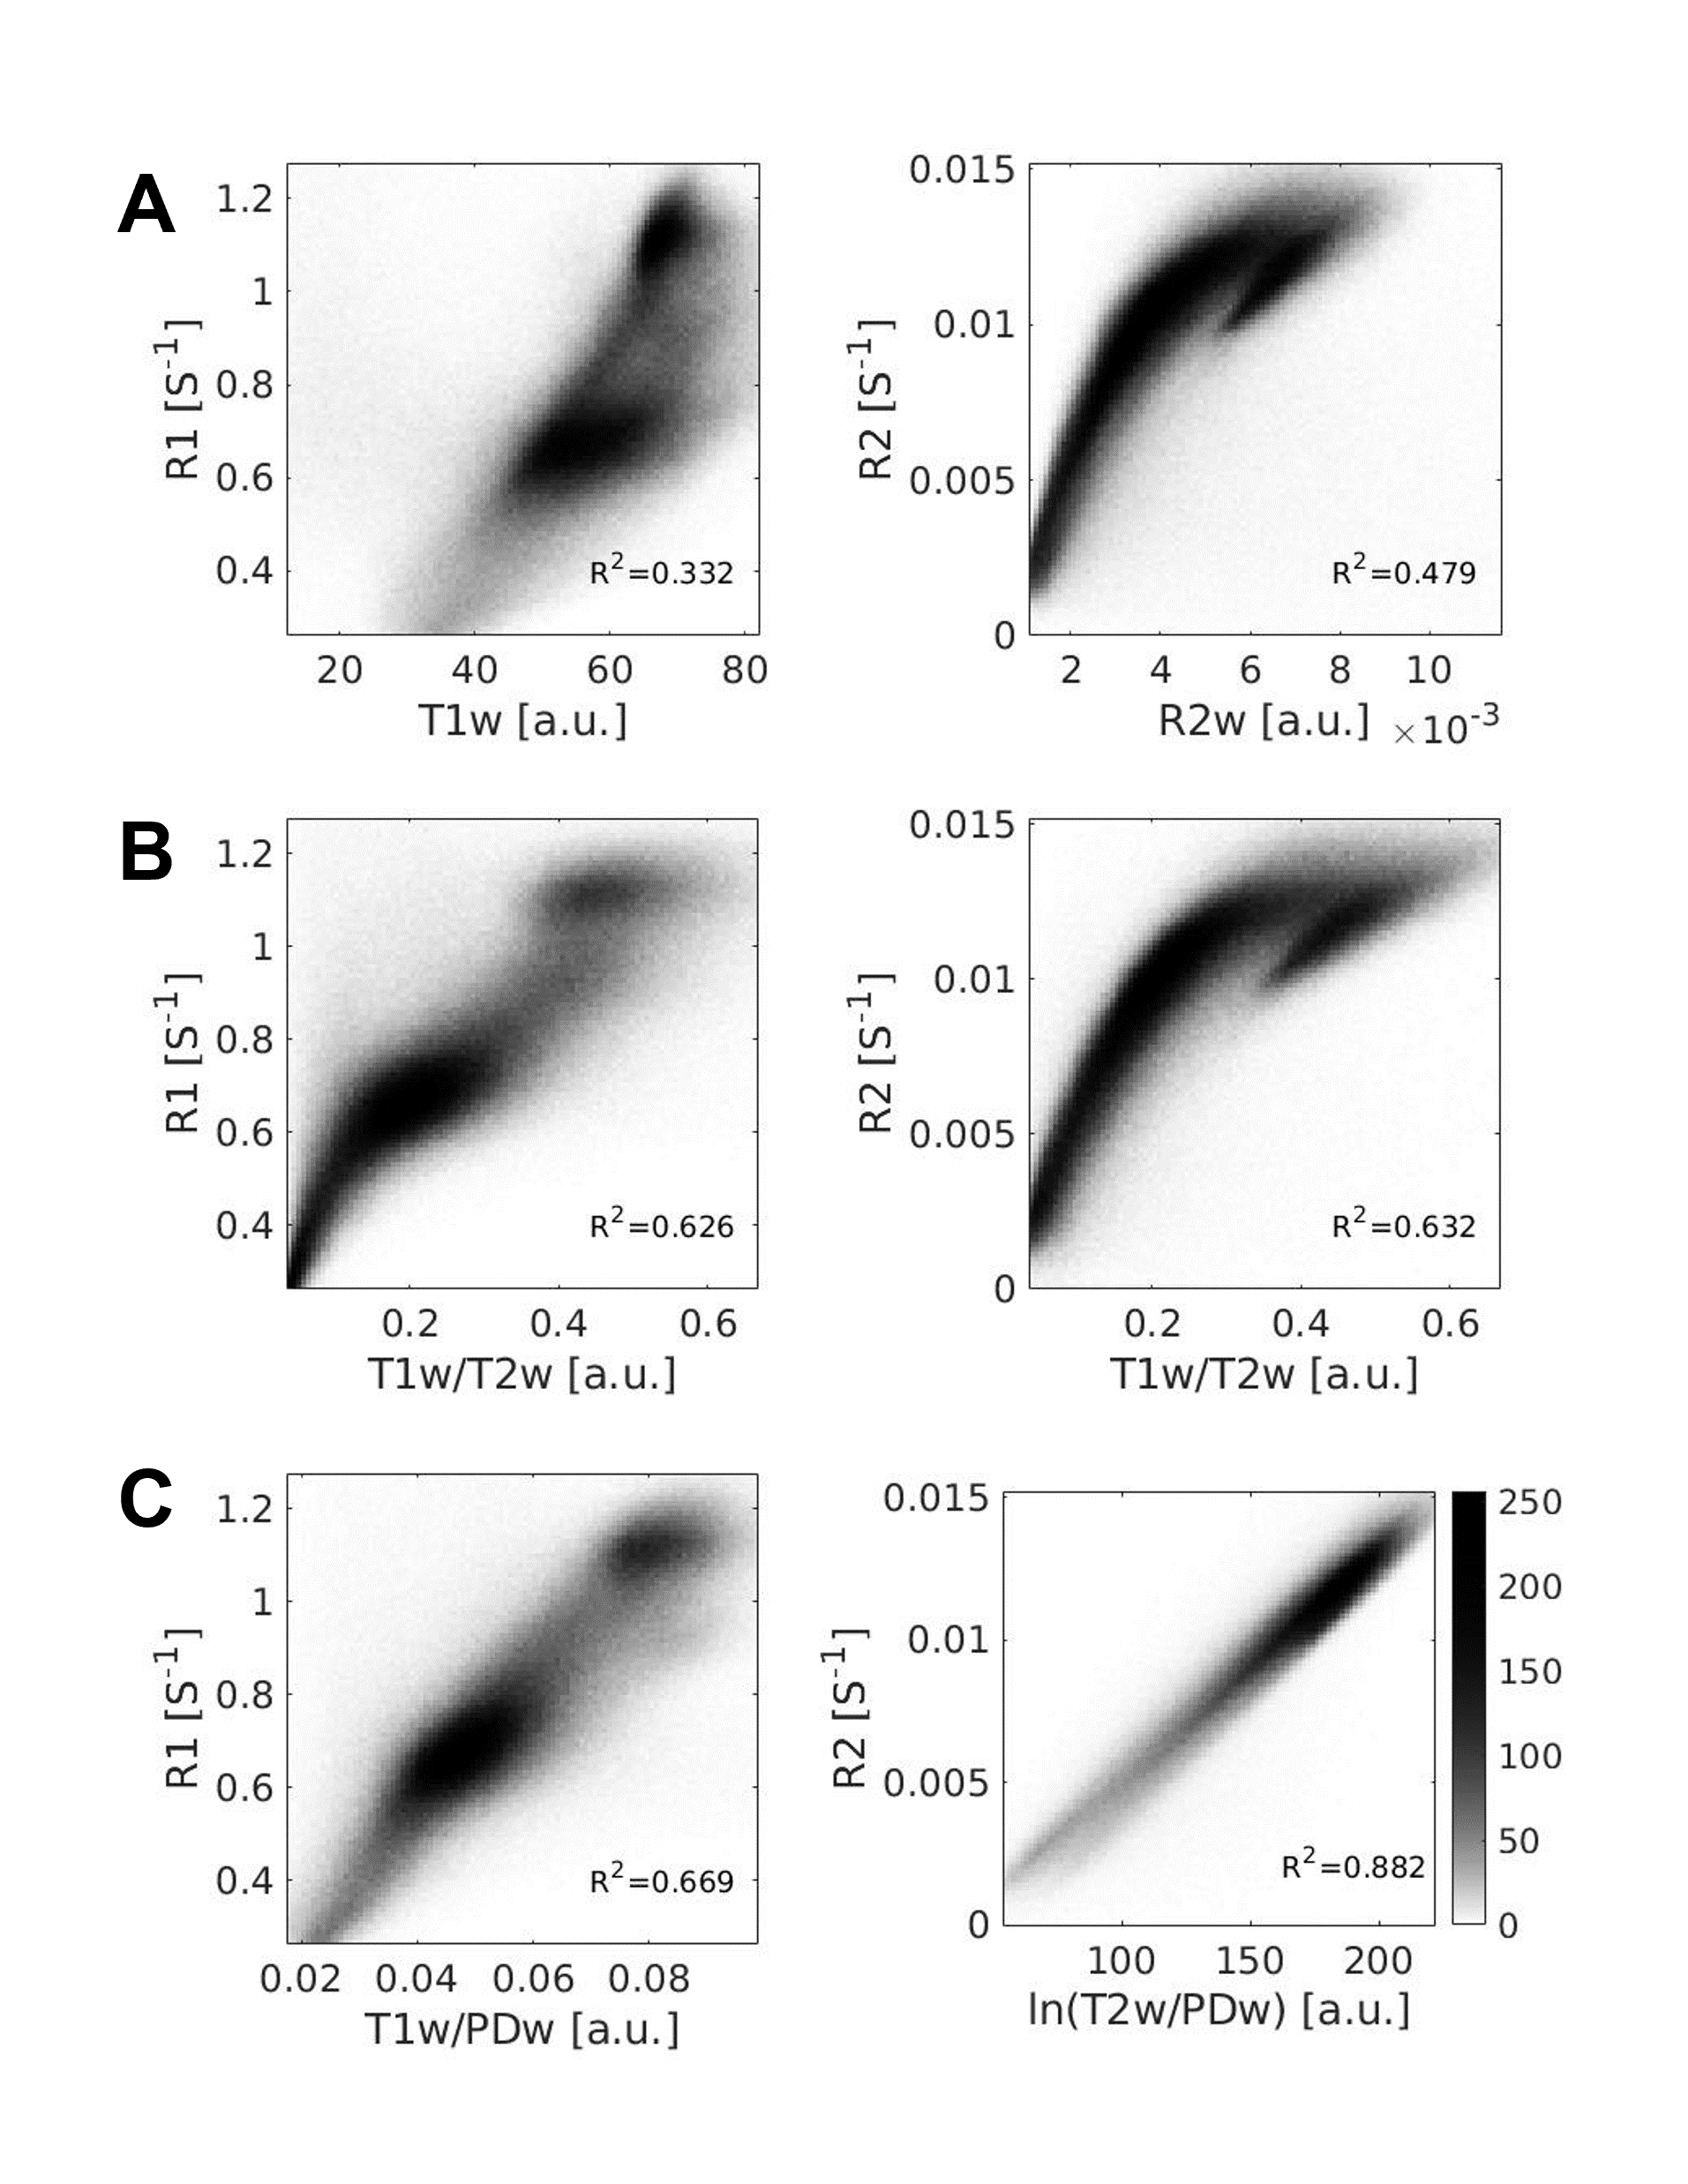
Fig. 3 – in vivo whole-brain correlations in humans
Voxel-wise 2D-histograms of the quantitative maps R1 and R2 of a single subject with either A T1w and R2w, respectively; B T1w/T2w ratio; and C our new semi-quantitative measurements T1w/PDw and ln(T2w/PDw). R2 represents the linear correlations. These new contrasts yield the best correlations with the quantitative maps.
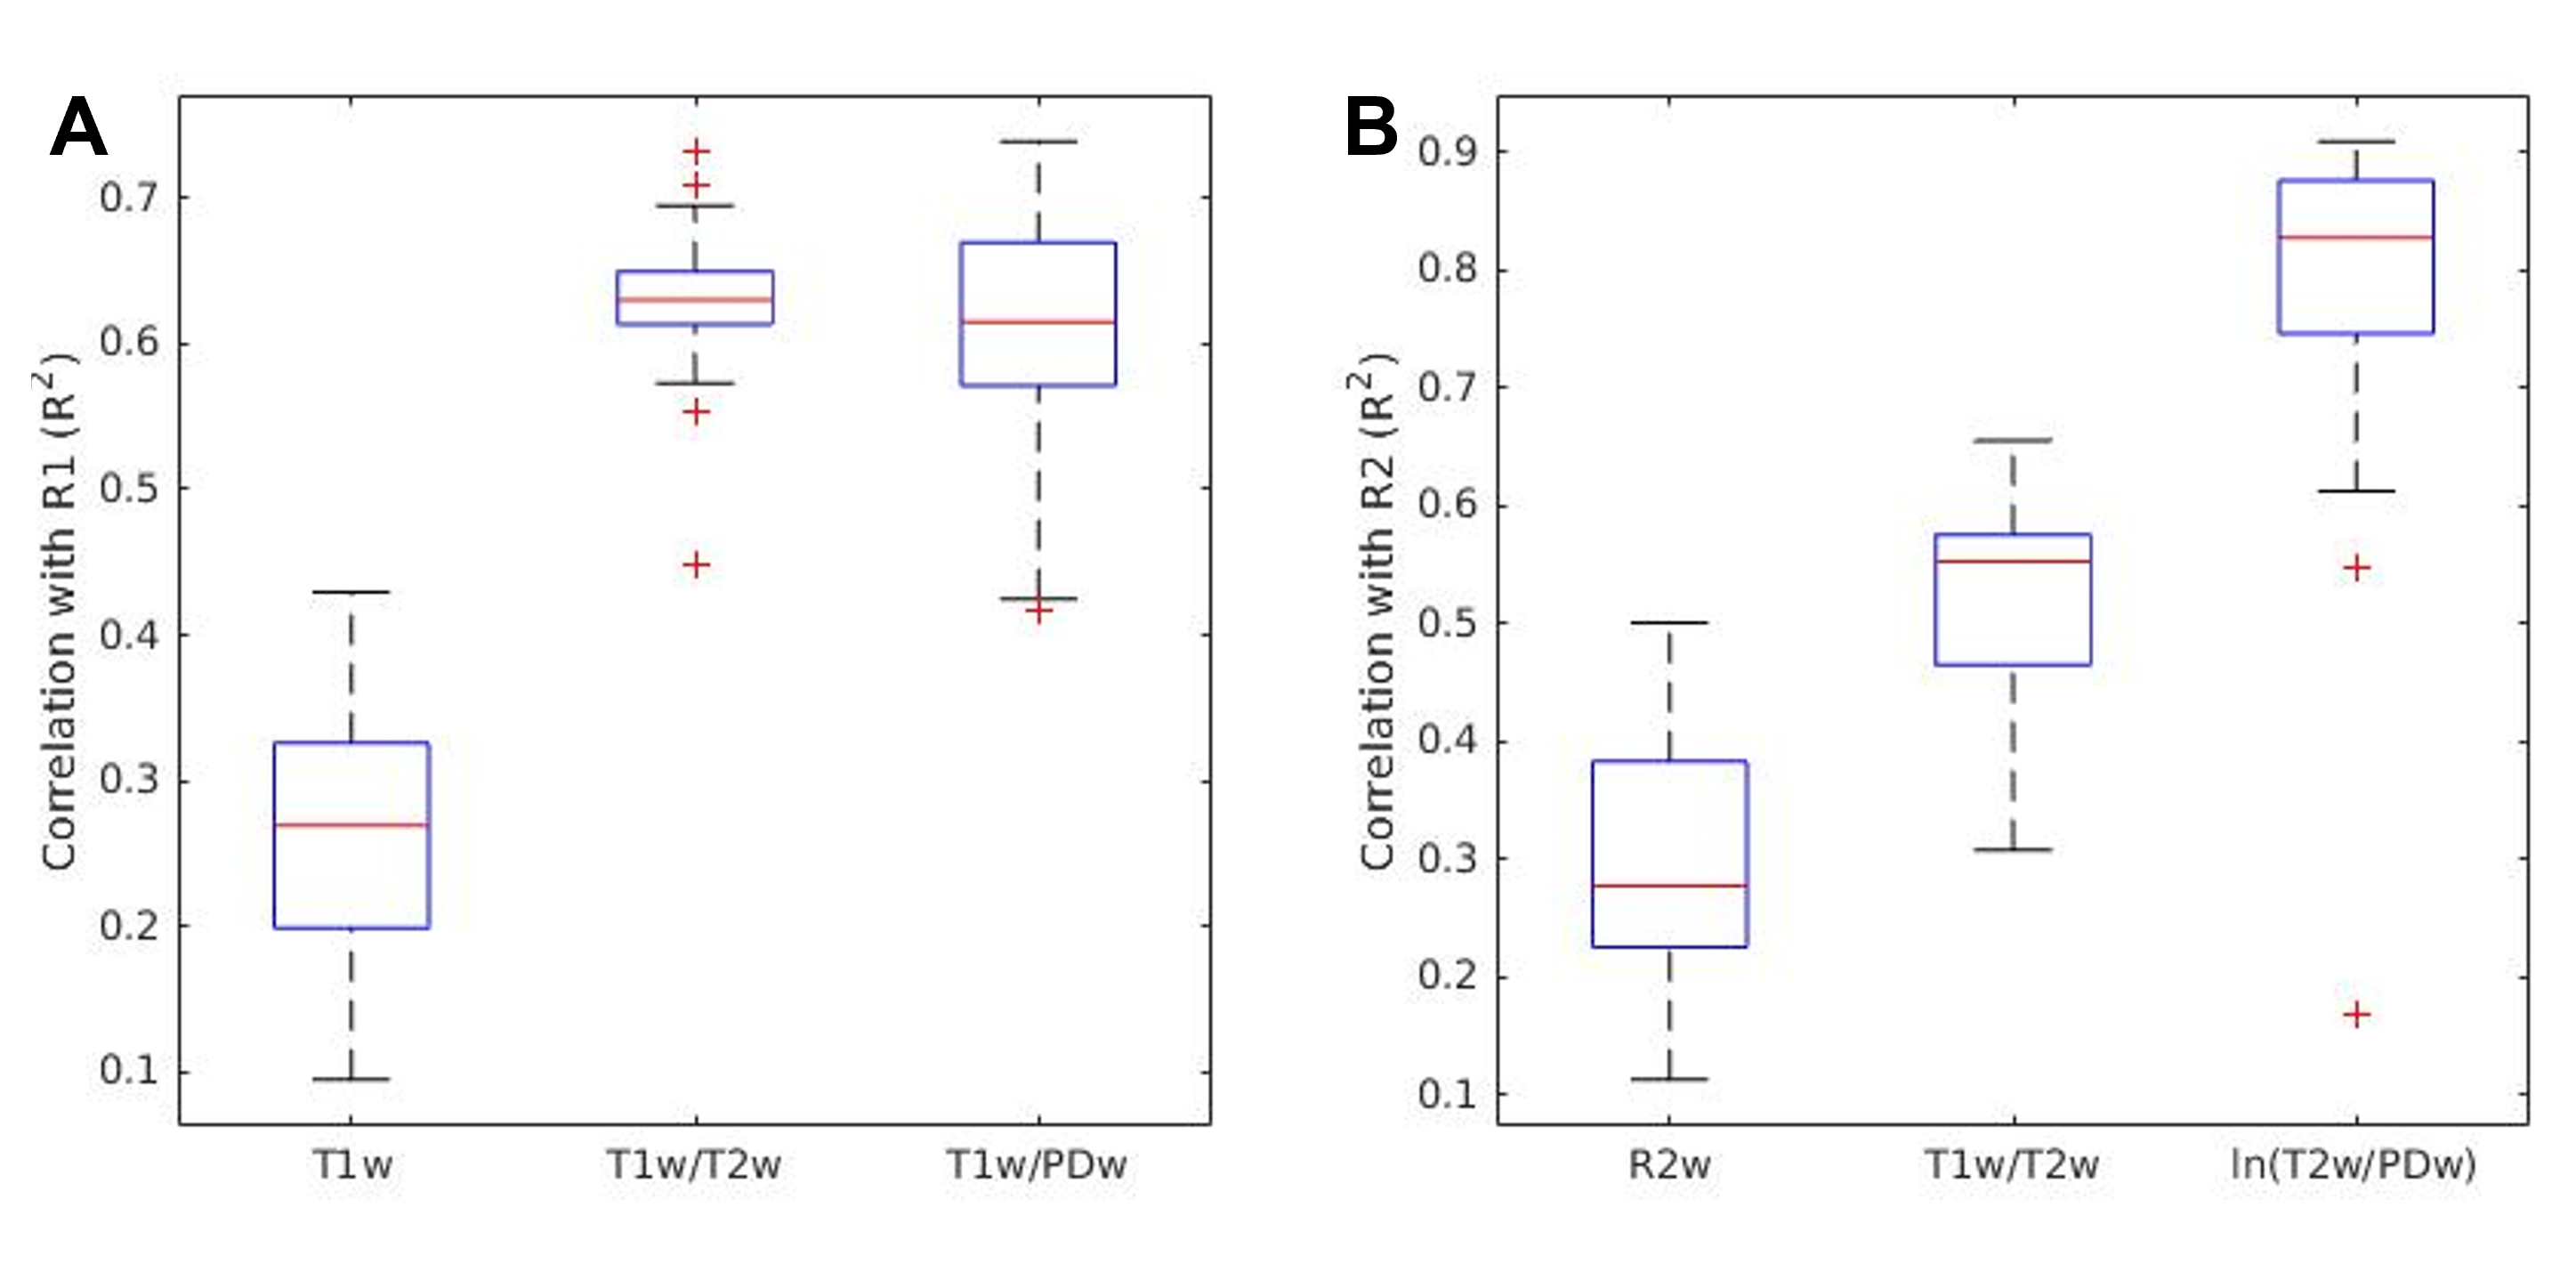
Fig. 4 – In vivo whole-brain correlations in humans across subjects
Correlations between quantitative maps and different contrasts across subjects. A R1 group correlations. Both T1w/T2w and T1w/PDw correlate significantly better with R1 compared to T1w (student’s t-test, p<10-7 for both). Differences between these groups are statistically insignificant. B R2 group correlations. Our new contrast ln(T2w/PDw) correlates best with R2 (student’s t-test, p<10-7). The 25th, 50th and 75th percentiles and extreme data points are shown for each box, n=37.