1095
Is linear subspace constraint reconstruction suitable for multi-compartment T2 imaging? Evaluation and guidelines.1Centre de Résonance Magnétique et Systèmes Biologiques, UMR5536, CNRS, University of Bordeaux, Bordeaux, France, 2Wellcome Center for Human Neuroimaging, UCL Queen Square Institute of Neurology, University Coleege of London, London, United Kingdom, 3Groupe d’Imagerie Neurofonctionnelle, Institut des Maladies Neurodégénératives UMR 5293, CNRS, CEA, University of Bordeaux, Bordeaux, France, 4Department of Neurosurgery, Azienda Provinciale per i Servizi Sanitari, Santa Chiara Hospital, Trento, Italy
Synopsis
Keywords: Quantitative Imaging, Image Reconstruction, myelin water fraction
Multi-compartment T2 imaging suffers from long acquisition time. Undersampling the k-space combined with advanced iterative reconstructions could be beneficial to reach a reasonable scan duration. This work investigates the suitability of linear subspace-based reconstruction for myelin water fraction and intra-extracellular T2 mapping. Our findings suggest that subspace-based reconstruction for intra-extra cellular T2 and myelin water fraction mapping can be reliably used in combination with spatial regularization enforcing sparsity. The temporal basis can be built from extended phase graph simulations and should include at least 12 components, especially for myelin water fraction mapping.Introduction
Multi-compartment (mc-)T2 imaging enables the distinction of multiple compartments of the microstructure of the tissue1–3. Myelin water fraction (MWF) and intra-extracellular T2 (IE-T2) maps can be obtained from multi-echo spin echo (MESE) acquisitions at the cost of a very long acquisition time4. Undersampling of the k-space combined with advanced reconstruction approaches can significantly accelerate the acquisition5. Subspace-constraint linear reconstruction is a powerful technique for multiple time point acquisitions6–9; it consists in approximating the temporal signal curves using a linear combination of basis functions, which can be extracted from the singular value decomposition (SVD) of a set of representative signals. Two recent studies suggest that this approach could be applied to mc-T2 mapping, but in-depth analysis is missing10–12. This study aims to verify the suitability of this technique for mc-T2 mapping while providing guidelines to ensuring reliable results.Methods
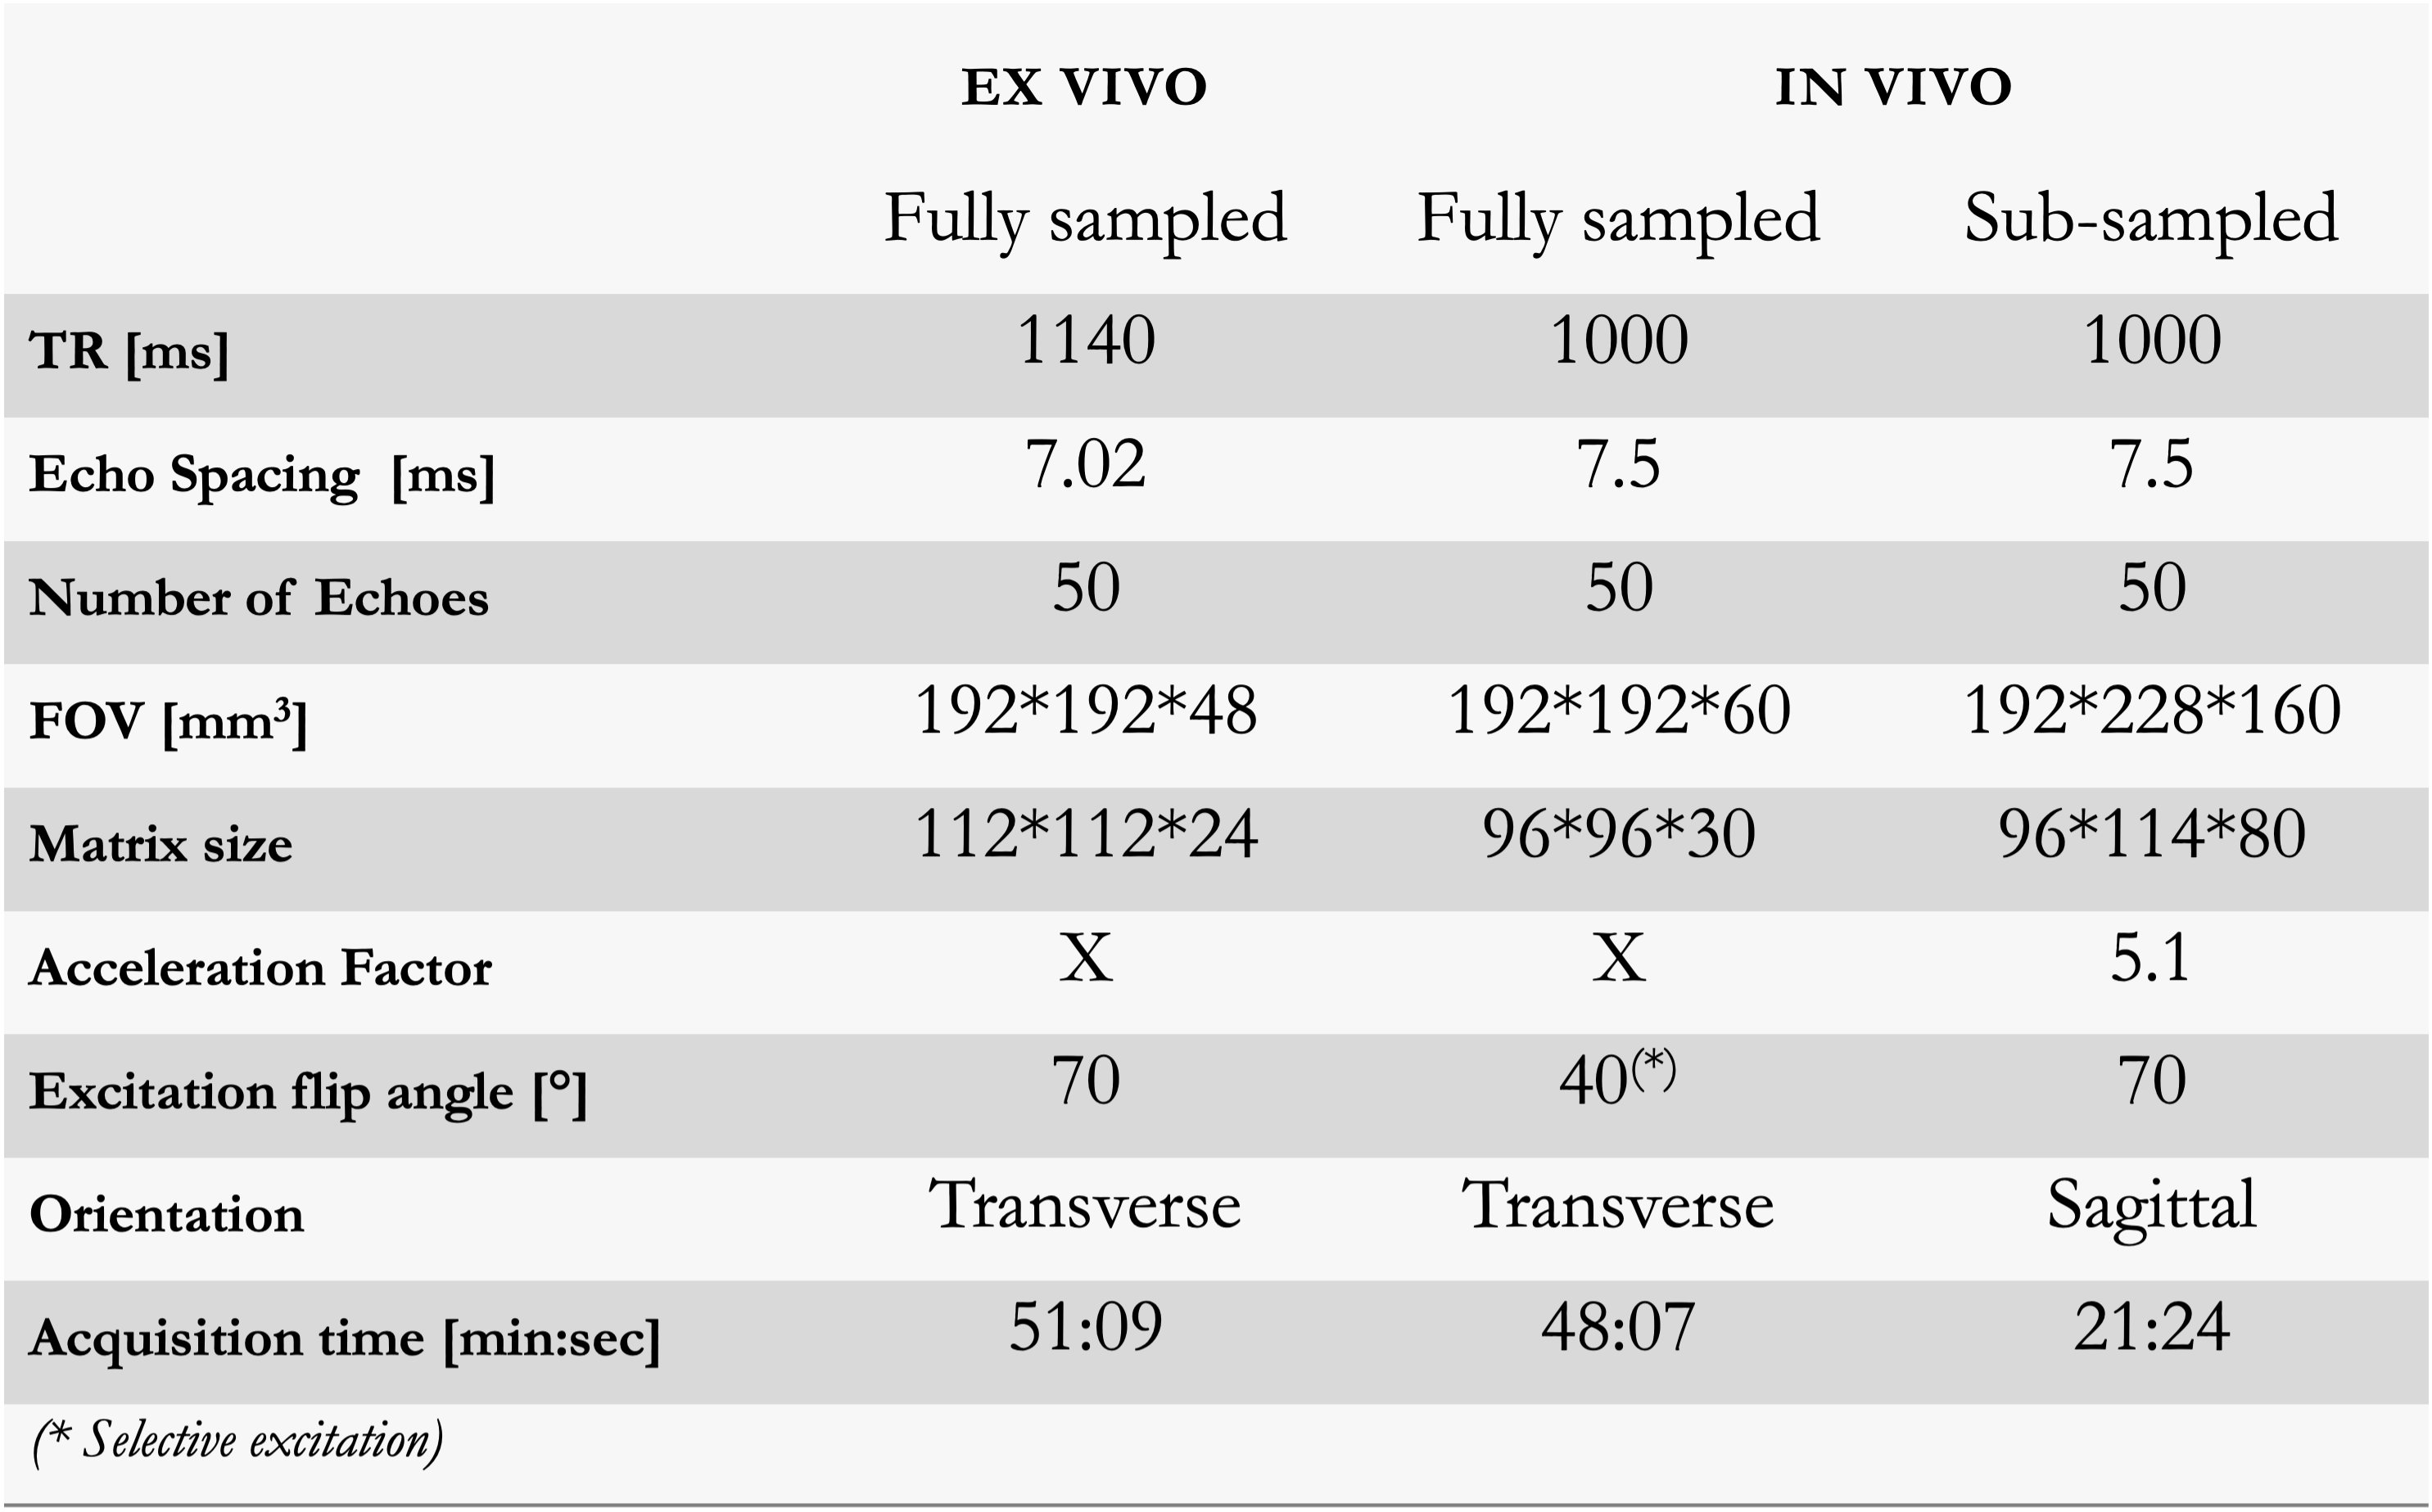
MRI acquisitionsEx-vivo and in-vivo acquisitions of human brains were performed on a 3T PRISMA Siemens scanner with an in-house 3D MESE sequence. Key parameters are summarized in Table 1. Fully sampled acquisitions were reconstructed with the inverse 3D Fourier Transform and denoted here as the References.
Experiment 1: Evaluate the impact of the subspace constraints
To isolate the effect of subspace constraints and minimize the number of processing steps, additional data were directly computed from the ex-vivo reference image (Ref) as follows: $$$ \widehat{x}= ϕ\widehat{c} \space with \space \widehat{c}=\min_c {\frac{1}{2}\|\phi c-\it{Ref}\|_2^2} $$$ with $$$ \phi$$$ the linear basis functions and $$$ \widehat{c} $$$ the estimated temporal coefficient images.Three sets, S1, S2, and S3, from which temporal basis functions $$$ \phi $$$ are extracted after SVD were tested:
- EPG simulations13 of MESE signals with 200 single T2 varying either linearly (S1) or logarithmically (S2) from 5 to 200 ms and 80 B1+ ranging from 0.7 to 1.
- Signals of 10000 voxels included in the brain of the Reference (S3).
Experiment 2: Evaluate the impact of the acceleration factor
Retrospective undersampling with a variable density Poisson mask (acceleration factor of 3.8, 5.6, and 7.5) was applied to the ex-vivo reference k-space to evaluate subspace-based reconstruction in accelerated conditions and reconstructed as: $$$\hat{x}=\phi\hat{c} \space with \space \hat{c}=\min_c\frac{1}{2}\|UF\phi c-y\|_2^2 + λ\|W\phi\|_1$$$, (W=Wavelet Transform, U=Undersampling, $$$\lambda$$$regularization factor, $$$\phi$$$ built from S2). This was compared to the iterative reconstruction without subspace constraints: $$$ \hat{x}=\min_x\frac{1}{2}\|UFx-y\|_2^2 + \lambda\|Wx\|_1$$$.
Experiment 3: In-vivo validation
The accelerated whole brain in-vivo acquisition was reconstructed as: $$$\widehat{x}=\min_x\frac{1}{2}\|UFSx-y\|_2^2+ λ\|Wx\|_1 $$$ (S=Sensitivity coil profile), and with the additional subspace constraints built from S2 : $$$\hat{x}=\phi\hat{c} \space with \space \hat{c}=\min_c\frac{1}{2}\|UFS\phi c-y\|_2^2 + λ\|W\phi\|_1$$$ The size of $$$\phi$$$ was varied from 6 to 48.
Every reconstruction was performed with the BART toolbox14.
Post-processing
IE-T2 maps (60<T2<150ms) and MWF maps were reconstructed with the DECAES toolbox15 accounting for stimulated echoes.
In-vivo acquisitions were coregistered with SPM12(https://www.fil.ion.ucl.ac.uk/spm/). Voxel-wise normalized differences of MWF and IE-T2 with their corresponding references were computed. The median across voxels of the absolute normalized difference was computed across brain voxels in one transverse slice and denoted $$$\epsilon$$$.
Results
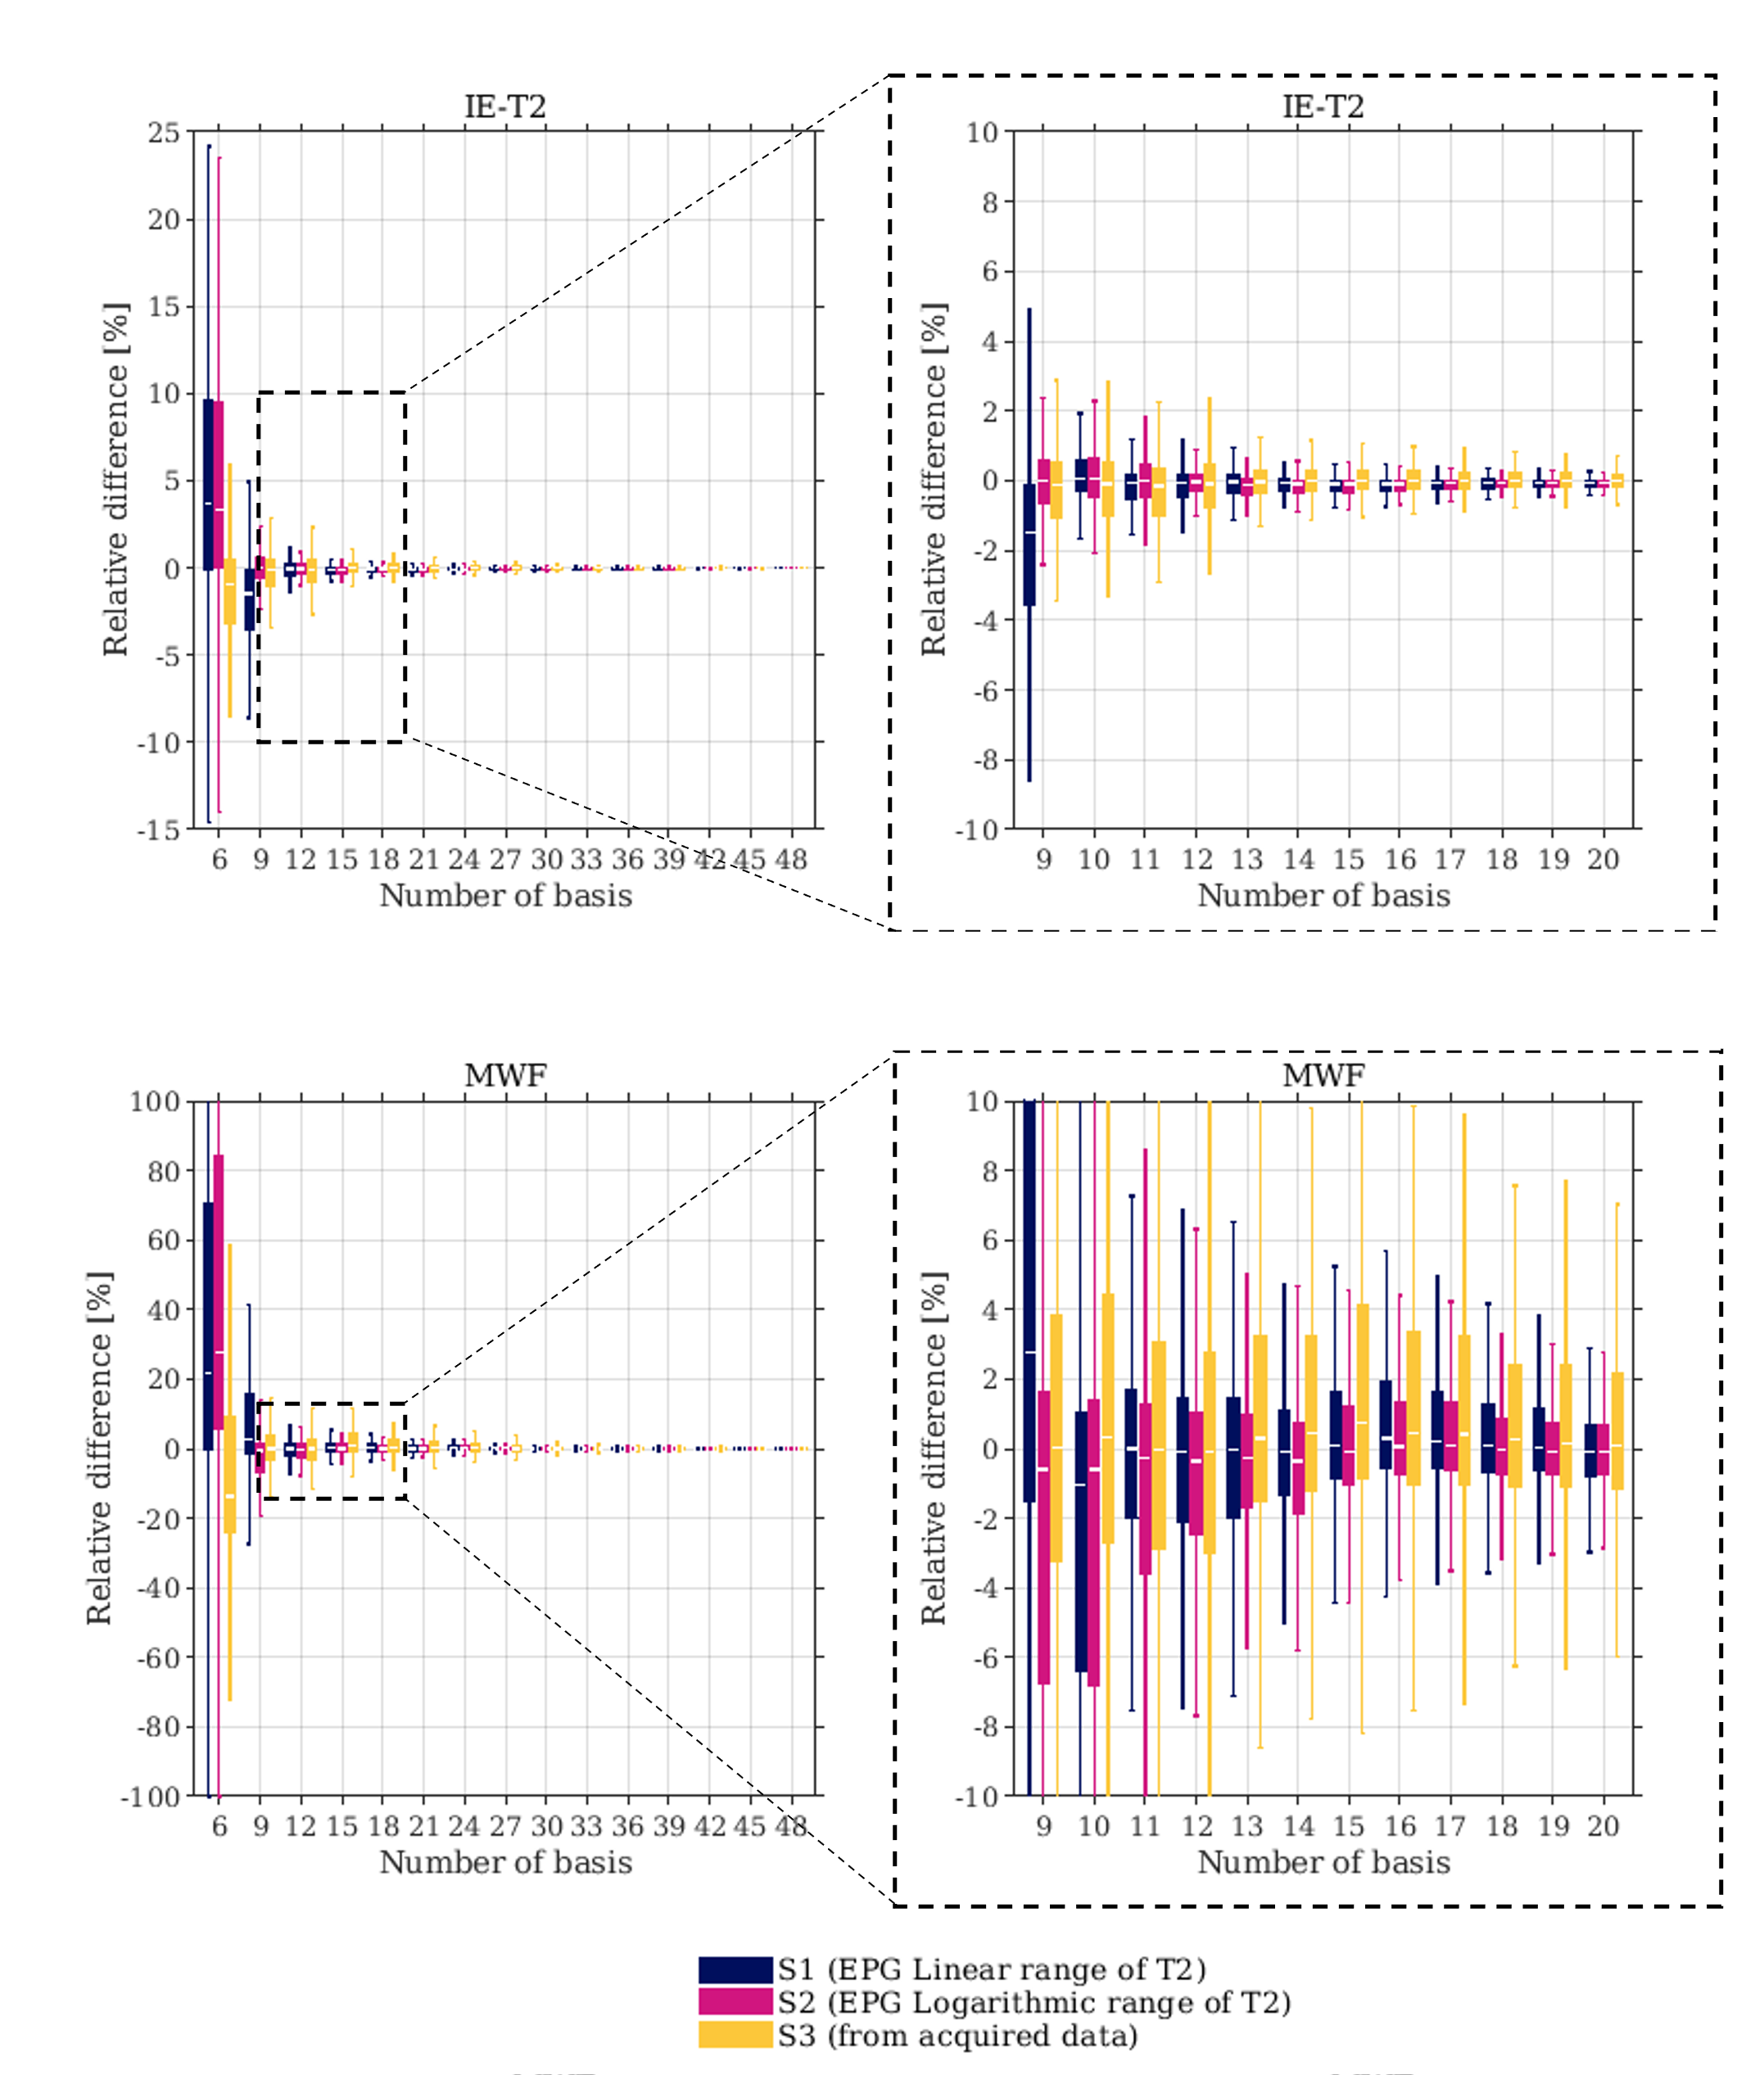
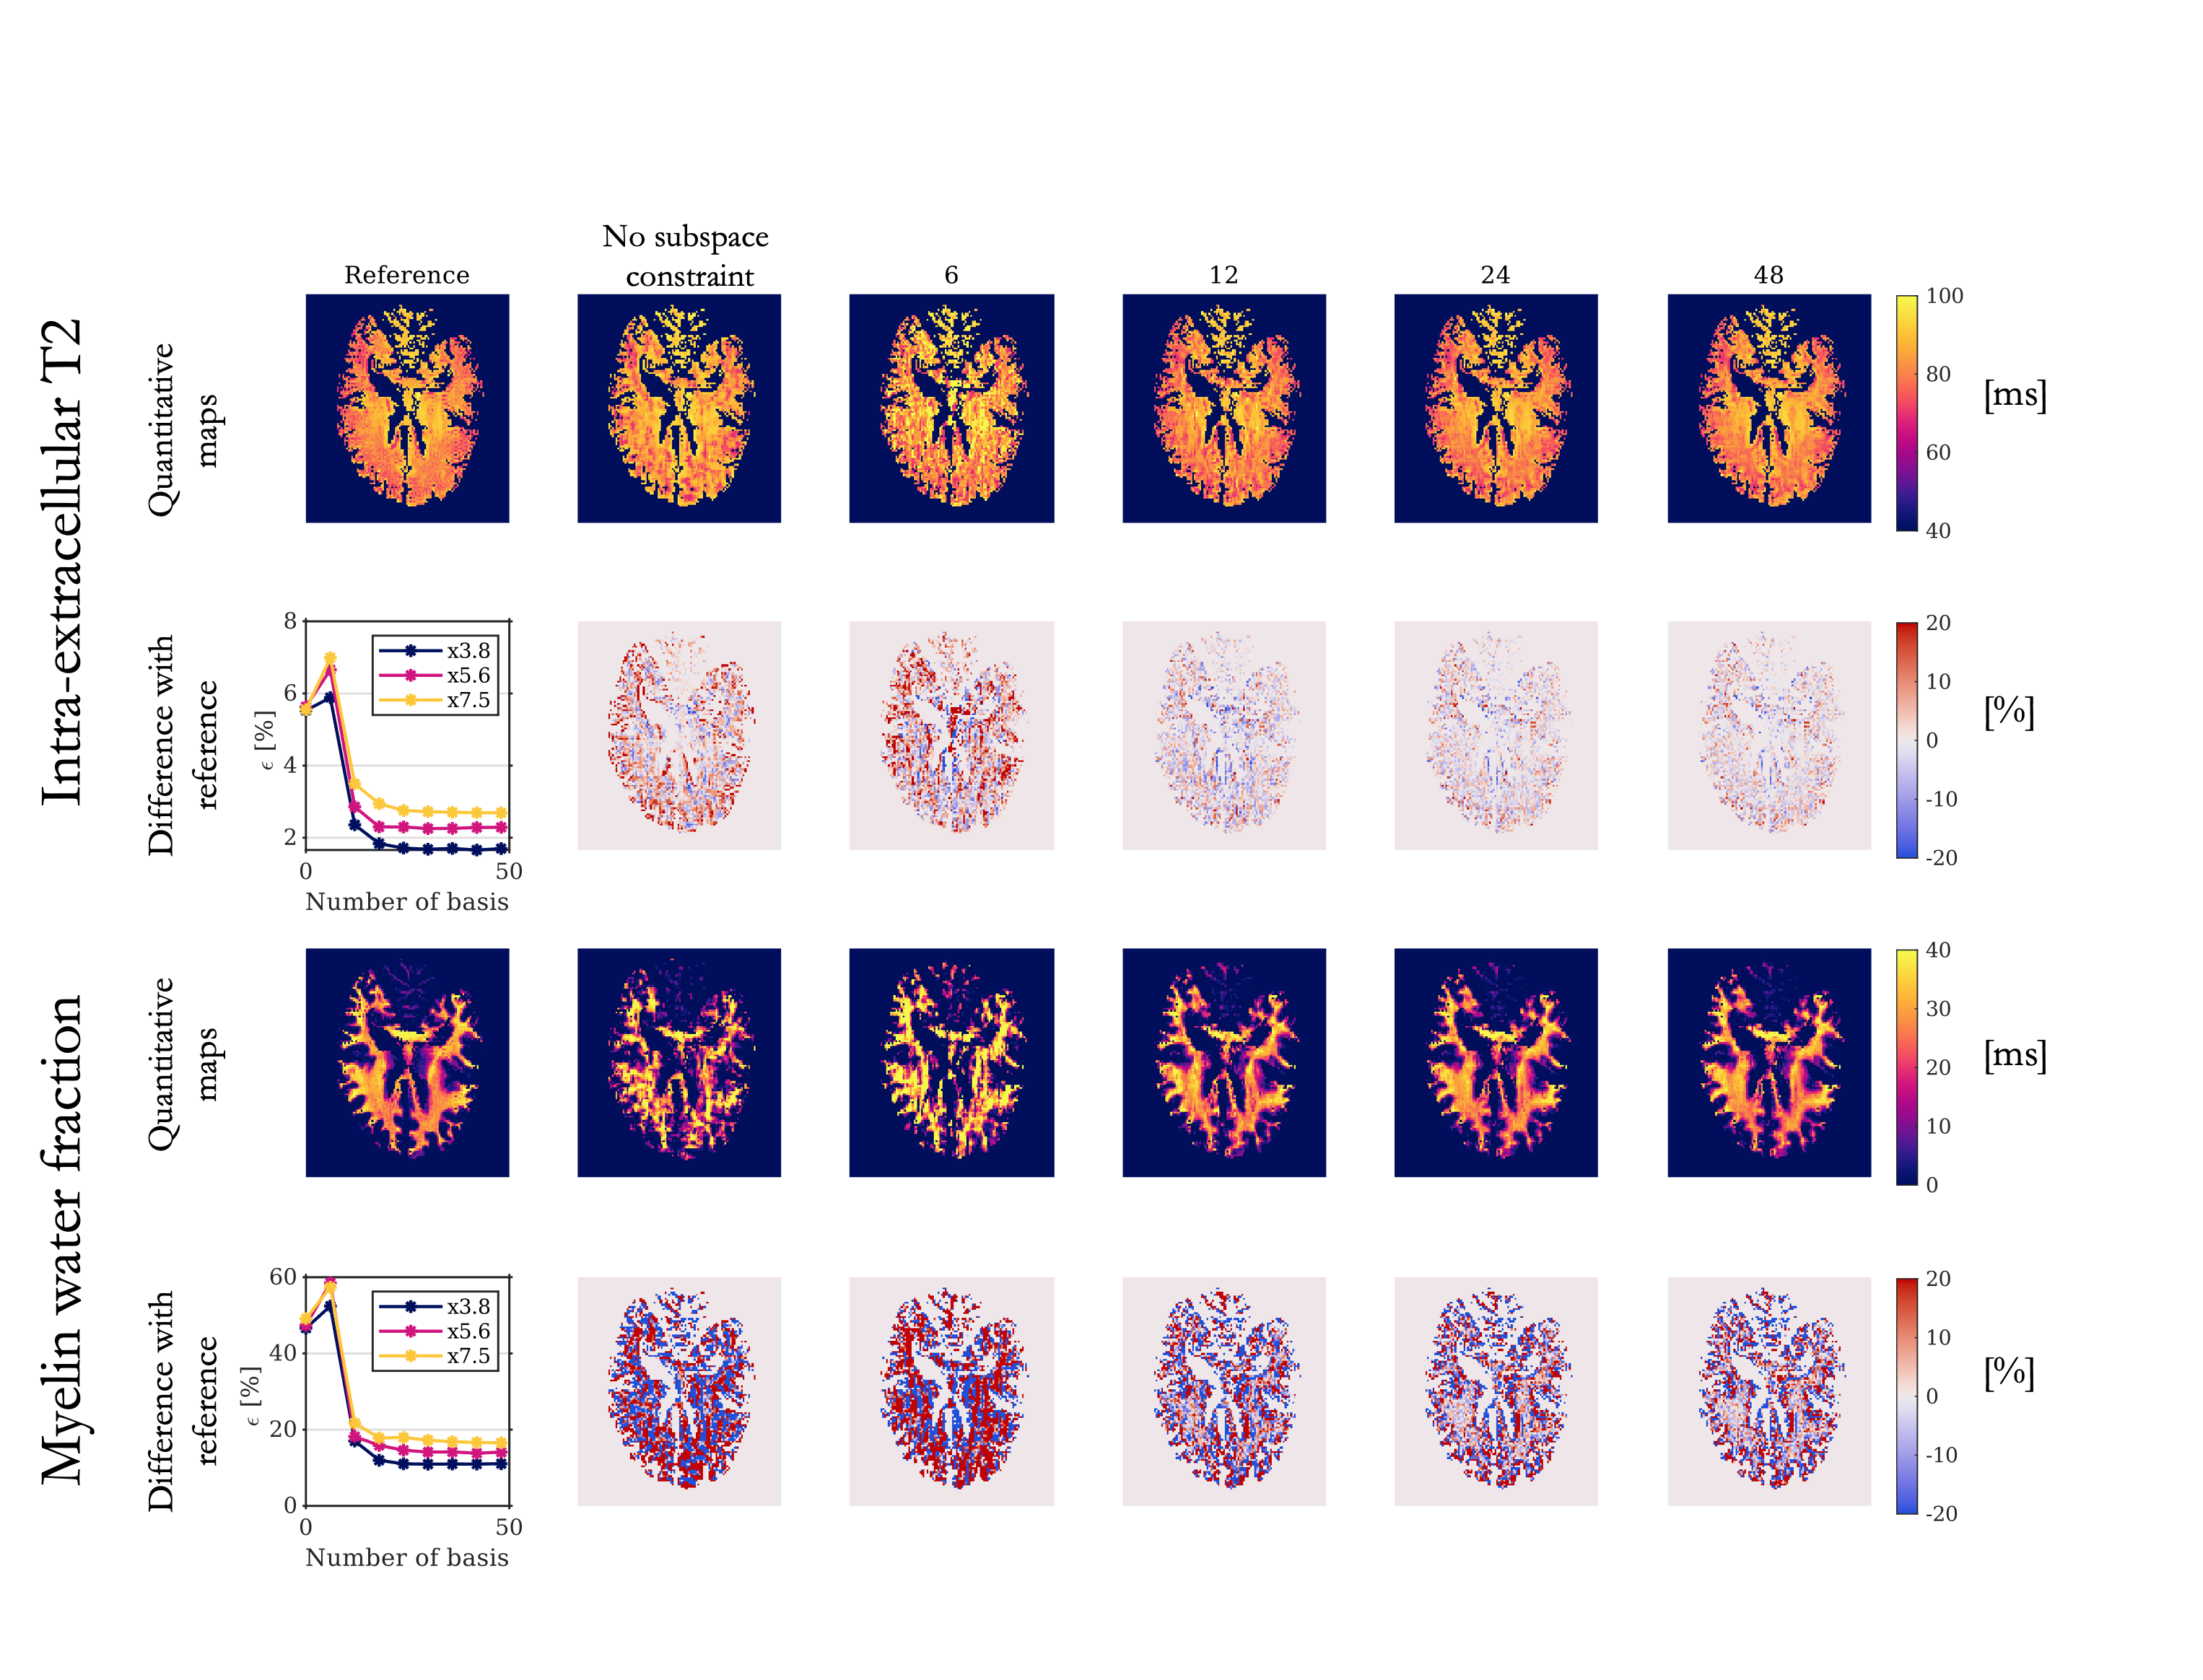
Experiment 1: The number of basis required to obtain quantitative maps equivalent to the original reference was higher for MWF than IE-T2 maps (Fig.1). To reach $$$\epsilon$$$ <1%, a minimum of 10, 9, or 7 basis of S1, S2, and S3 respectively were required for IE-T2 whereas at least 17, 16 or 25 basis of S1, S2 and S3 respectively were required for MWF. IE-T2 and MWF maps reconstructed with 6 basis showed a visible bias (Fig.2).Experiment 2: Subspace-based reconstruction with only 6 basis did not outperform the reconstruction without subspace constraints; however, 12 basis improved the resulting quantitative maps (Fig.3). Regardless of the acceleration factor, $$$\epsilon$$$ drops significantly from 6 to 12 basis (inset plots, Fig3). A plateau was reached at 18 components regardless of the acceleration factor.
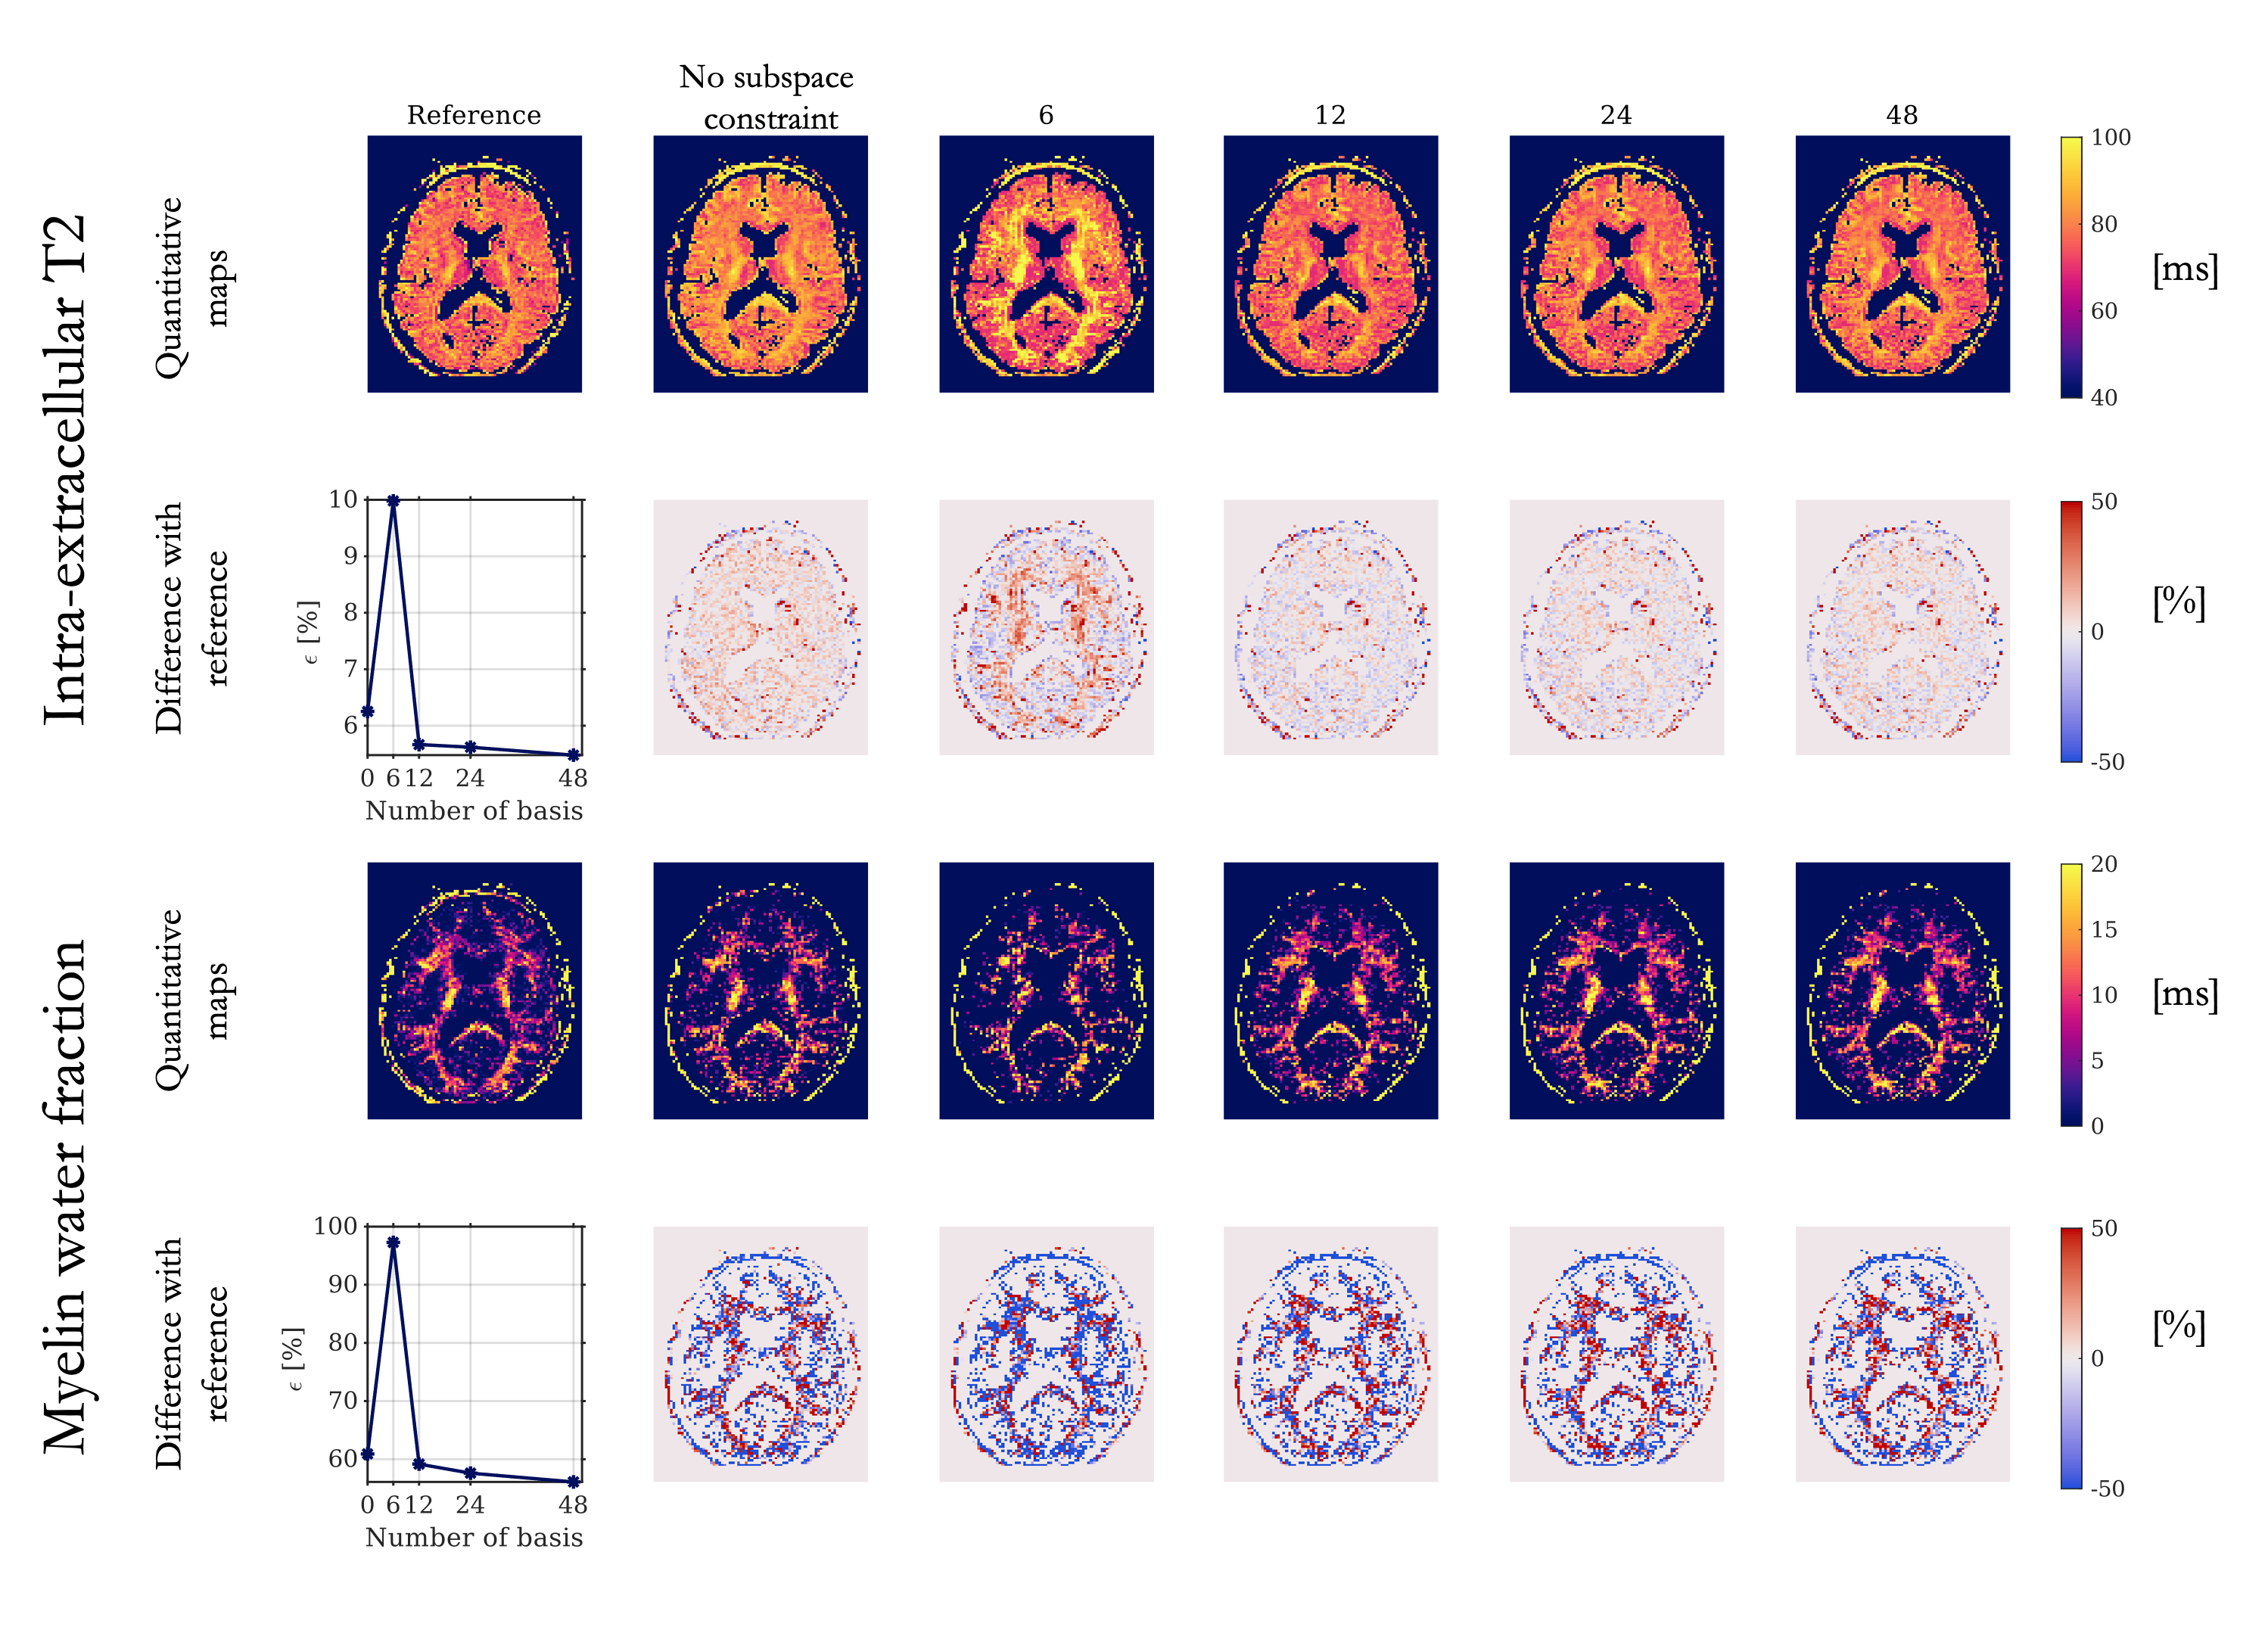
Experiment 3: A global bias was visible in the IE-T2 maps obtained from the iterative reconstruction without subspace constraints (Fig.4). Although adding subspace constraints with only 6 basis introduced an even greater bias in the IE-T2 map and did not improve the MWF map, 12 basis provided higher quality maps ($$$\epsilon$$$<6% for IE-T2 and $$$\epsilon$$$<60% for MWF).
Discussion
Extensive analyses have been performed on the fully sampled ex-vivo dataset to isolate the impact of a subspace-based reconstruction. The temporal basis created from EPG simulations provided slightly better results than the temporal basis extracted from the acquired dataset. Even in those ideal conditions, at least 12 basis of this dataset were required to obtain reliable MWF maps, regardless of the acceleration factor.In real conditions, iterative subspace-based reconstruction improved the quality of the quantitative maps; however, it was crucial not to include less than 12 basis. Finally, data reconstructed without the additional spatial regularization applied to the basis coefficients enforcing sparsity were not exploitable (data not shown).
Conclusion
Linear subspace-based reconstruction is suitable for mc-T2 mapping and enables whole brain MWF and IE-T2 mapping in reasonable scan time. Our findings suggest that EPG simulations might be more suitable than acquired signals to build the temporal basis, and a higher number of basis than previously reported would be preferable (12>6).Acknowledgements
This work was supported by the French National Research Agency (ANR-19-CE19-0014) and by the Inserm Cancer PCSI funding N°20CP093-00.References
1. Laule, C. et al. Characterization of brain tumours with spin–spin relaxation: pilot case study reveals unique T2 distribution profiles of glioblastoma, oligodendroglioma and meningioma. J. Neurol. 264, 2205–2214 (2017).
2. MacKay, A. L. & Laule, C. Magnetic Resonance of Myelin Water: An in vivo Marker for Myelin. Brain Plast. 2, 71–91.
3. Liu, F. et al. Articular Cartilage of the Human Knee Joint: In Vivo Multicomponent T2 Analysis at 3.0 T. Radiology 277, 477–488 (2015).
4. Mackay, A. et al. In vivo visualization of myelin water in brain by magnetic resonance. Magn. Reson. Med. 31, 673–677 (1994).
5. Wang, X., Tan, Z., Scholand, N., Roeloffs, V. & Uecker, M. Physics-based reconstruction methods for magnetic resonance imaging. Philos. Trans. R. Soc. Math. Phys. Eng. Sci. 379, 20200196 (2021).
6. Huang, C., Graff, C. G., Clarkson, E. W., Bilgin, A. & Altbach, M. I. T2 mapping from highly undersampled data by reconstruction of principal component coefficient maps using compressed sensing. Magn. Reson. Med. 67, 1355–1366 (2012).
7. Roeloffs, V., Uecker, M. & Frahm, J. Joint T1 and T2 Mapping With Tiny Dictionaries and Subspace-Constrained Reconstruction. IEEE Trans. Med. Imaging 39, 1008–1014 (2020).
8. Wang, X., Tan, Z., Scholand, N., Roeloffs, V. & Uecker, M. Physics-based reconstruction methods for magnetic resonance imaging. Philos. Trans. R. Soc. Math. Phys. Eng. Sci. 379, 20200196 (2021).
9. Tamir, J. I. et al. T2 shuffling: Sharp, multicontrast, volumetric fast spin-echo imaging. Magn. Reson. Med. 77, 180–195 (2017).
10. Corbin, N., Trotier, A. J., Miraux, S. & Ribot, E. J. Whole brain 3D radial T2 mapping with retrospective motion correction capabilities. in ISMRM Annual Meeting 2022 vol. 1262 (2022).
11. Dvorak, A. V. et al. The CALIPR framework comprehensively improves acquisition, reconstruction & analysis of multi-component relaxation imaging. in ISMRM Annual Meeting 2022 vol. 2851 (2022).
12. Dvorak, A. V., Gilbert, G., MacKay, A. L. & Kolind, S. H. Multi-Component Quantitative T2 Shuffling: Accelerating Myelin Water Imaging by 20-30x. in ISMRM Annual Meeting 2020 vol. 3449 (2020).
13. Malik, S. J., Teixeira, R. P. A. G. & Hajnal, J. V. Extended phase graph formalism for systems with magnetization transfer and exchange. Magn. Reson. Med. 80, 767–779 (2018).
14. Uecker, M. et al. mrirecon/bart: version 0.7.00. (2021) doi:10.5281/zenodo.4570601.
15. Doucette, J., Kames, C. & Rauscher, A. DECAES – DEcomposition and Component Analysis of Exponential Signals. Z. Für Med. Phys. (2020) doi:10.1016/j.zemedi.2020.04.001.
Figures