1092
An empirical approach to determine water T1 from multiparametric MR images of the liver1Institute for Clinical Diabetelogy, German Diabetes Center (DDZ) Leibniz Center for Diabetes Research, Düsseldorf, Germany, 2Medical Image and Data Analysis (MIDAS.lab), University Hospital of Tübingen, Diagnostics and Interventional Radiology, Tübingen, Germany
Synopsis
Keywords: Quantitative Imaging, Liver, Machine Learning, Segmentation
This work focuses on an empirical approach to determine water T1 from multiparametric MR images, including T1, PDFF and T2* maps. To this end, a multiple linear regression model was fit to describe the deviation in MOLLI T1 based on PDFF and T2* values, which were measured in phantoms built at increasing lipids and iron content. This method was validated on a cohort of healthy volunteers and diabetes subjects (n=45). Further investigations were conducted to elucidate the relationship between MOLLI T1 values, before and after correction for hepatic lipid and iron content, and liver stiffness measured by MR elastography.
Introduction
The incidence of advanced forms of non-alcoholic fatty liver (NAFLD) disease, including non-alcoholic steatohepatitis (NASH), cirrhosis and fibrosis is increasing worldwide [1]. Advanced magnetic resonance imaging (MRI) protocols, including the acquisition of longitudinal (T1), transversal (T2*) relaxation time and proton density fat fraction (PDFF) maps, are candidates to non-invasively assess the progressive forms of fatty liver diseases, inflammation and fibrosis [2]. Liver T1 measured by a MOdified Lock-Locker Inversion recovery (MOLLI) sequence was positively associated with biopsy-proven liver fibrosis and inflammation and the T1 relaxation time of water is suggested to underlie this relationship with fibrosis [3]. However, tissue T1 as determined by MOLLI does not solely reflect water T1, it is also influenced by iron and fat content. A high hepatic iron content leads to an underestimation of T1 measured by MOLLI [4] while a high lipid content leads to an increased T1. Here we examined the feasibility of an empirical approach for iron and lipid content correction when measuring liver T1 using a MOLLI sequence. Such correction was applied in T1 measurements in vivo and outcomes were related to liver stiffness as determined by elastography. For validation, 1H-magnetic resonance spectroscopy (MRS) was used to assess the water T1 directly (without bias by lipids). To facilitate the processing of multiparametric MR images in large cohort studies in the future, an automatic pipeline exploiting a pre-trained 3D-convolutional neural network (CNN) [5] was developed and tested to segment the liver and quantify water T1.Methods
Agar-based phantoms were created, using a broad range of lipid content (0-20%) and iron oxide concentrations (0-25 μg Fe/mL) to produce T1 values within the physiological range of the liver. All MRI and 1H-MRS measurements were performed on a 3 T clinical MR scanner (Achieva dStream, Philips Healthcare, Best, the Netherlands). A multi-echo 3D-gradient recalled echo (3D-GRE) protocol (mDixon Quant®, Philips Healthcare, Best, Netherlands) was acquired on the set of phantoms, with TR/ TE=7.00/1.24 ms, TE interval=0.90 ms, six-echo acquisition, flip angle=3° and 4 mm slice thickness. PDFF maps were reconstructed by using a 7-peak fat modelling and T2* correction. A MOLLI sequence [6] was used for the acquisition of T1 maps (TR/TE=2.45/1.15 ms, flip angle=35°, 6 mm slice thickness). A multiple linear regression model was fit to the phantom measurements to predict the deviation in R1 (R1=1/T1) based on PDFF and T2*. In vivo application was performed on a cohort of individuals with type 1 (n=16), type 2 diabetes (n=20) and healthy volunteers (n=9). A single voxel IR-STEAM spectroscopy protocol was used to quantify the water T1 of the liver (TR/TE = 4000/15 ms, TI=50-3500 ms). The abdominal MRI protocol included multi- and dual-echo 3D-GRE image acquisitions (TR=5.60 ms, TE1/2=1.76/3.80 ms, flip angle=35°, 2 mm slice thickness). Liver stiffness was determined by applying 2D-GRE magnetic resonance elastography (MRE), acquired within the same imaging session (TR/TE=50/20 ms, flip angle=30°, 10 mm slice thickness) and a series of wave and stiffness maps of liver were produced by using the MREview software package (Philips, Best, Netherlands). A pre-trained CNN was tested to accurately segment and quantify the signal from co-registered T1 maps as compared to manual segmentation (Fig. 1). Finally, correlation analysis was performed to determine the relationship of liver stiffness and MOLLI T1 either with or without correction.Results
A multiple linear regression model described very well the R1 deviation across the phantoms (R2=0.931), indicating a significant interaction effect of both iron and lipid content as well as an interaction effect between them. The corrected T1 values showed a better agreement with the water T1 derived from 1H-MRS (ICC=0.60 [0.37, 0.76]) as compared with the uncorrected T1 values (ICC=0.18 [−0.09, 0.44]) (Fig. 2). Segmentation of liver through a trained 3D-CNN yielded accurate whole-liver segmentation (Dice score=0.90±0.06). The quantification of T1 values was in agreement with those calculated from the manual segmentation of liver volume, with ICC indexes equal to 1.0 [1.0, 1.0] (Fig. 3). By assessing the relationship of T1 with liver stiffness, we found a strong positive correlation of the uncorrected liver T1 values with liver stiffness (r=0.43, P=0.01) (Fig. 4). By contrast, we observed a marked reduction in the correlation after correction for iron and lipid content (r=0.05, P=0.77) with a difference in the correlation coefficient of -0.38 [-0.71, -0.03] between the uncorrected and the corrected T1 values.Discussion
Imaging-based correction factors derived from phantom measures enabled the estimation of water T1 in vivo without bias from fat and iron. The association of MOLLI T1 values with liver stiffness was mainly driven by volunteers with high hepatic lipid content and was lost upon correction. Therefore, this association seems to be largely due to fat signal influencing T1. This is in agreement with another studiy showing a reduction of this relationship after the liver T1 was statistically corrected for steatosis [7]. The possibility to report water T1 next to the uncorrected tissue T1 may still be a promising biomarker, being a specific tissue characteristic, to improve the diagnosis liver diseases.Conclusion
Estimation of water T1 from MOLLI requires correction for both hepatic lipid and iron content and holds the potential to further characterize the progression of NAFLD to NASH.Acknowledgements
We thank Andrea Nagel, Franziska Paumen and Stefan Wierichs and Daniela Seeger for valuable technical assistance. The authors would like to thank Julian Mevenkamp for the fruitful scientific discussions.References
[1] European Association for the Study of the Liver (EASL); European Association for the Study of Diabetes (EASD); European Association for the Study of Obesity (EASO). EASL-EASD-EASO Clinical Practice Guidelines for the management of non-alcoholic fatty liver disease. J Hepatol. 2016 Jun;64(6):1388-402. doi: 10.1016/j.jhep.2015.11.004. Epub 2016 Apr 7. PMID: 27062661.
[2] Schaapman JJ, Tushuizen ME, Coenraad MJ, Lamb HJ. Multiparametric MRI in Patients With Nonalcoholic Fatty Liver Disease. J Magn Reson Imaging. 2021 Jun;53(6):1623-1631. doi: 10.1002/jmri.27292. Epub 2020 Aug 21. PMID: 32822095; PMCID: PMC8247423.
[3] Banerjee R, Pavlides M, Tunnicliffe EM, Piechnik SK, Sarania N, Philips R, Collier JD, Booth JC, Schneider JE, Wang LM, Delaney DW, Fleming KA, Robson MD, Barnes E, Neubauer S. Multiparametric magnetic resonance for the non-invasive diagnosis of liver disease. J Hepatol. 2014 Jan;60(1):69-77. doi: 10.1016/j.jhep.2013.09.002. Epub 2013 Sep 12. PMID: 24036007; PMCID: PMC3865797.
[4] Tunnicliffe EM, Banerjee R, Pavlides M, Neubauer S, Robson MD. A model for hepatic fibrosis: the competing effects of cell loss and iron on shortened modified Look-Locker inversion recovery T1 (shMOLLI-T1 ) in the liver. J Magn Reson Imaging. 2017 Feb;45(2):450-462. doi: 10.1002/jmri.25392. Epub 2016 Jul 23. PMID: 27448630.2.
[5] Küstner T, Hepp T, Fischer M, Schwartz M, Fritsche A, Häring HU, Nikolaou K, Bamberg F, Yang B, Schick F, Gatidis S, Machann J. Fully Automated and Standardized Segmentation of Adipose Tissue Compartments via Deep Learning in 3D Whole-Body MRI of Epidemiologic Cohort Studies. Radiol Artif Intell. 2020 Oct 28;2(6):e200010. doi: 10.1148/ryai.2020200010. PMID: 33937847; PMCID: PMC8082356.
[6] Kellman P, Hansen MS. T1-mapping in the heart: accuracy and precision. J Cardiovasc Magn Reson. 2014 Jan 4;16(1):2. doi: 10.1186/1532-429X-16-2. PMID: 24387626; PMCID: PMC3927683.
[7] Dennis A, Kelly MD, Fernandes C, Mouchti S, Fallowfield JA, Hirschfield G, Pavlides M, Harrison S, Chakravarthy MV, Banerjee R, Sanyal A. Correlations Between MRI Biomarkers PDFF and cT1 With Histopathological Features of Non-Alcoholic Steatohepatitis. Front Endocrinol (Lausanne). 2021 Jan 27;11:575843. doi: 10.3389/fendo.2020.575843. PMID: 33584535; PMCID: PMC7877451
Figures
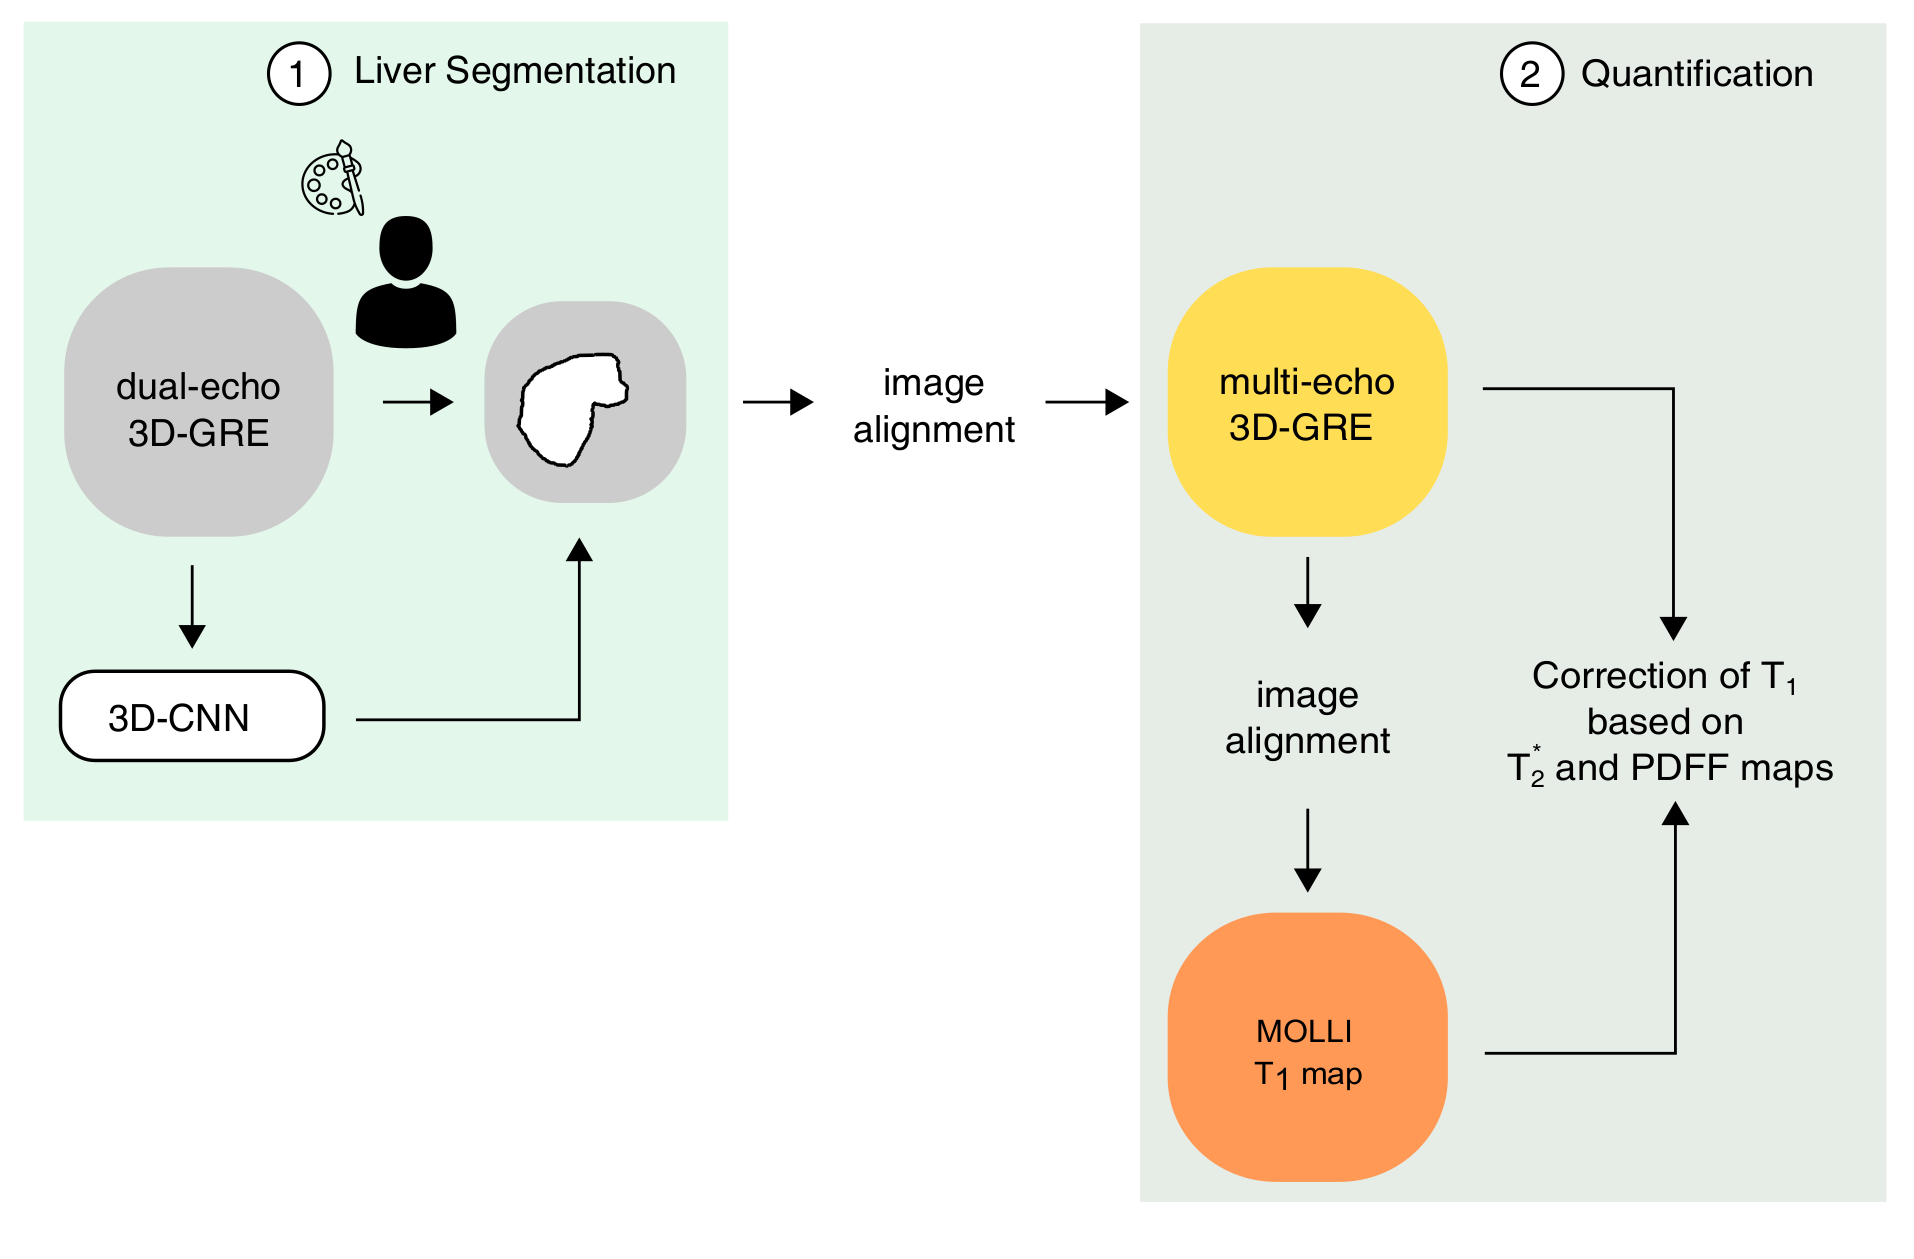
Fig. 1 Image processing pipeline for the quantification of liver T1
Schematic representation of the image processing pipeline used for (1) liver volume segmentation and (2) for the quantification of liver T1. In the first step, the liver masks are automatically segmented by a pre-trained 3D-convolutional neural network (3D-CNN) or by manual segmentation of liver. For the quantification, the steps include image alignment of multi-echo 3D-GRE images and MOLLI T1 maps following correction of T1 using PDFF and maps as reference for the presence of hepatic lipids and iron deposition.
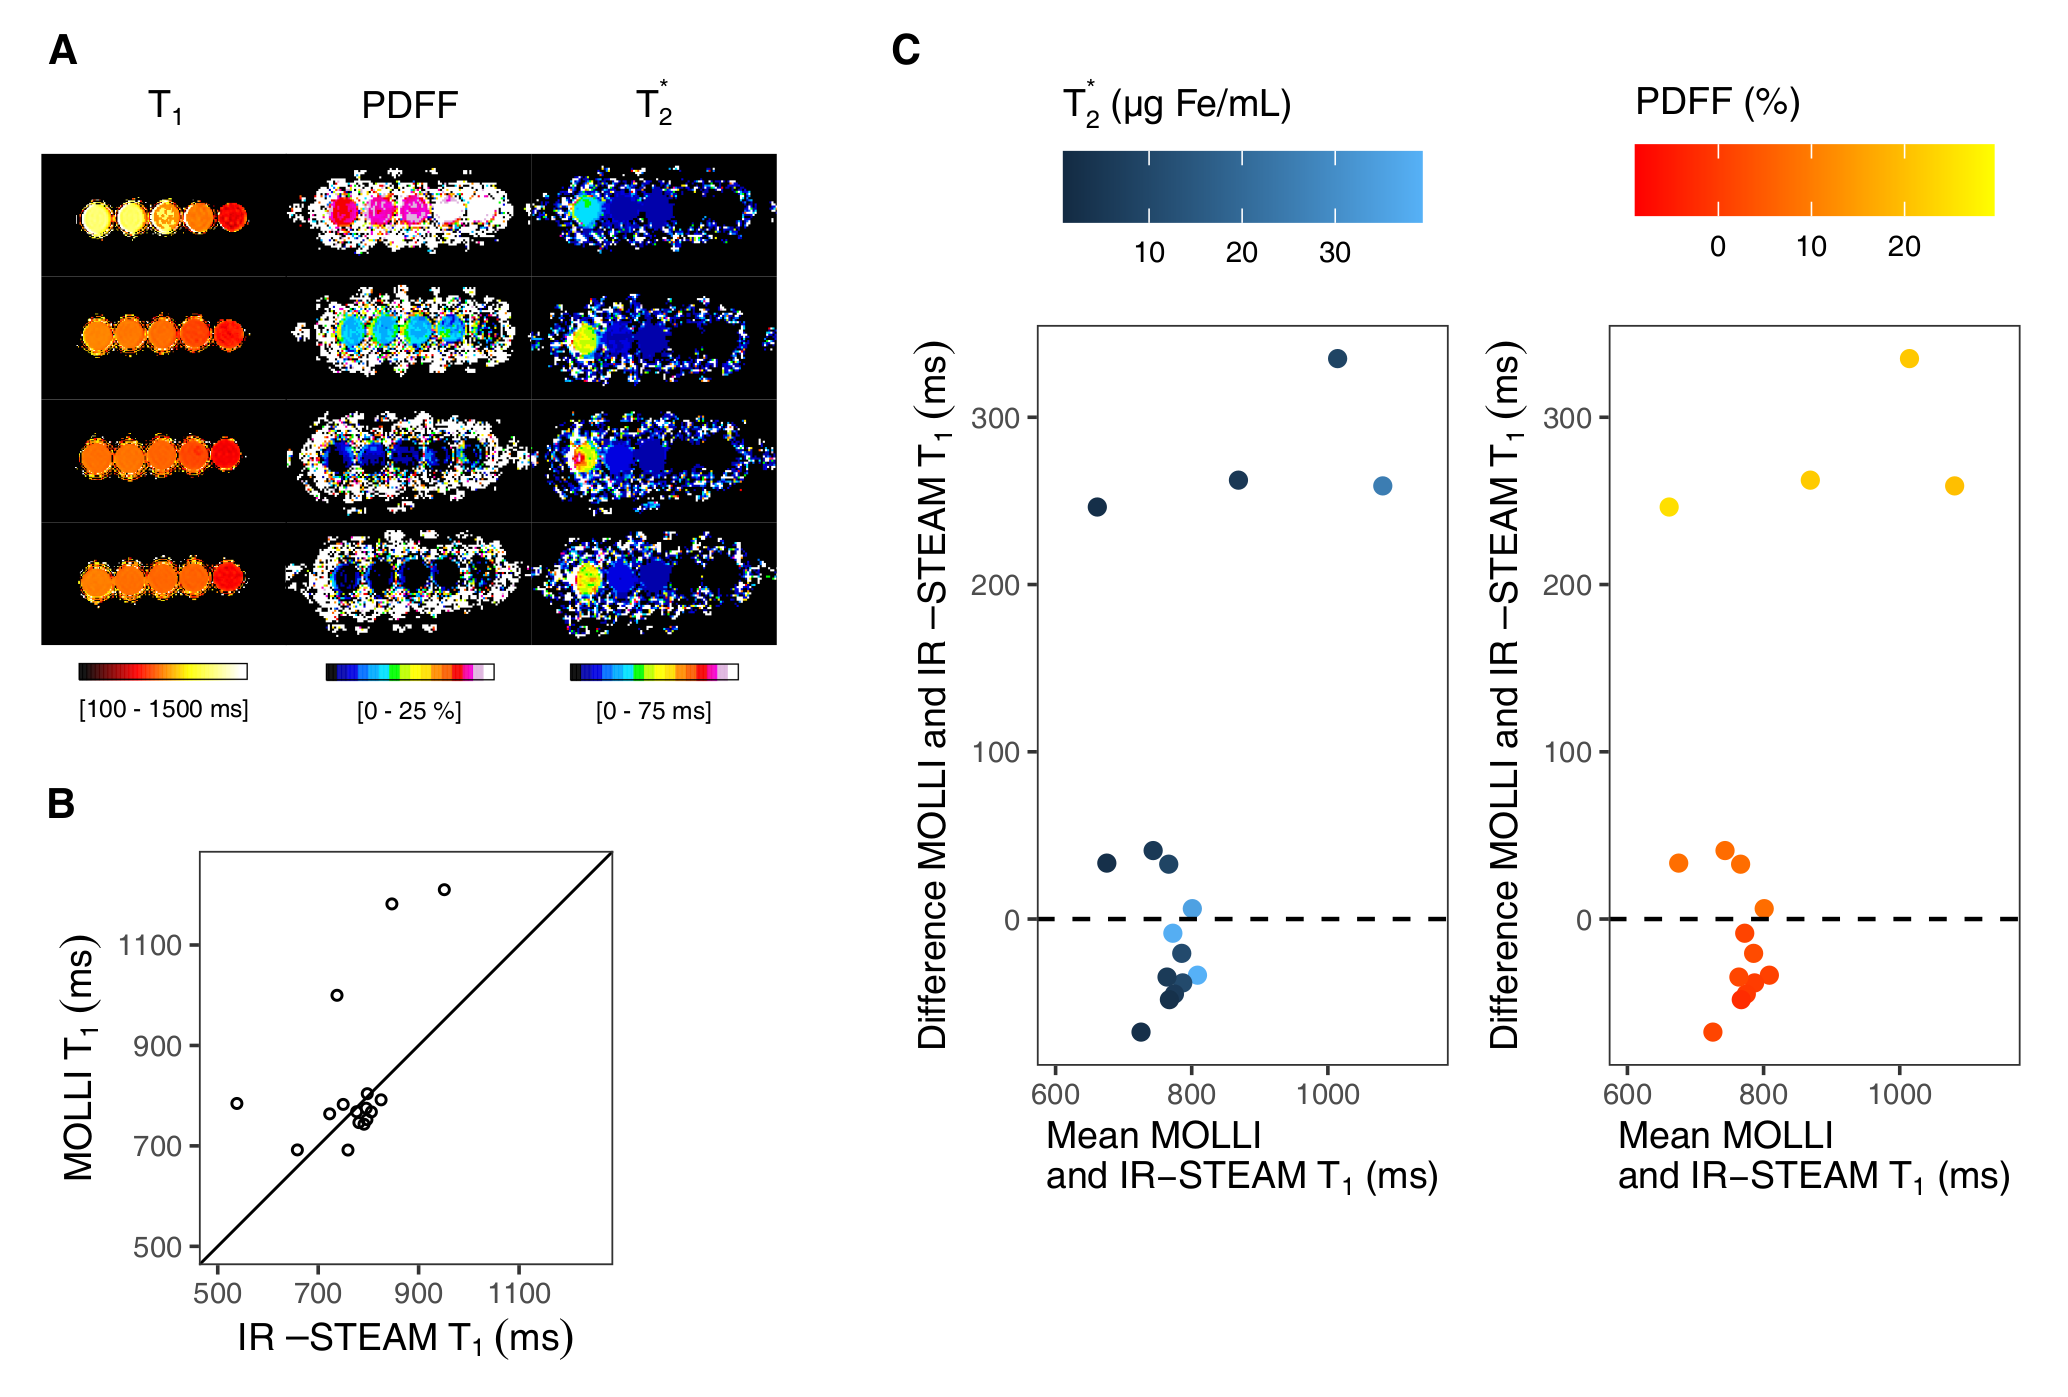
Fig. 2: Effect of iron and fat on MOLLI T1 on phantoms
(A) Multiparametric MR images for each set of phantoms at increasing iron oxide(III) concentration (0-75 μg Fe/mL) and peanut oil percentage (0-20 %) together with the MOLLI T1 (ms) and the PDFF (%) and T2* (ms). (B) In the graph the MOLLI T1 values are plotted against the IR-STEAM T1 values. (C) The Bland-Altman plots shows the differences between IR-STEAM and MOLLI T1 values aganist the mean. The plots show the respective gradients of T2* and PDFF measured at different iron (left, blues dots) and lipid content (right, red dots).
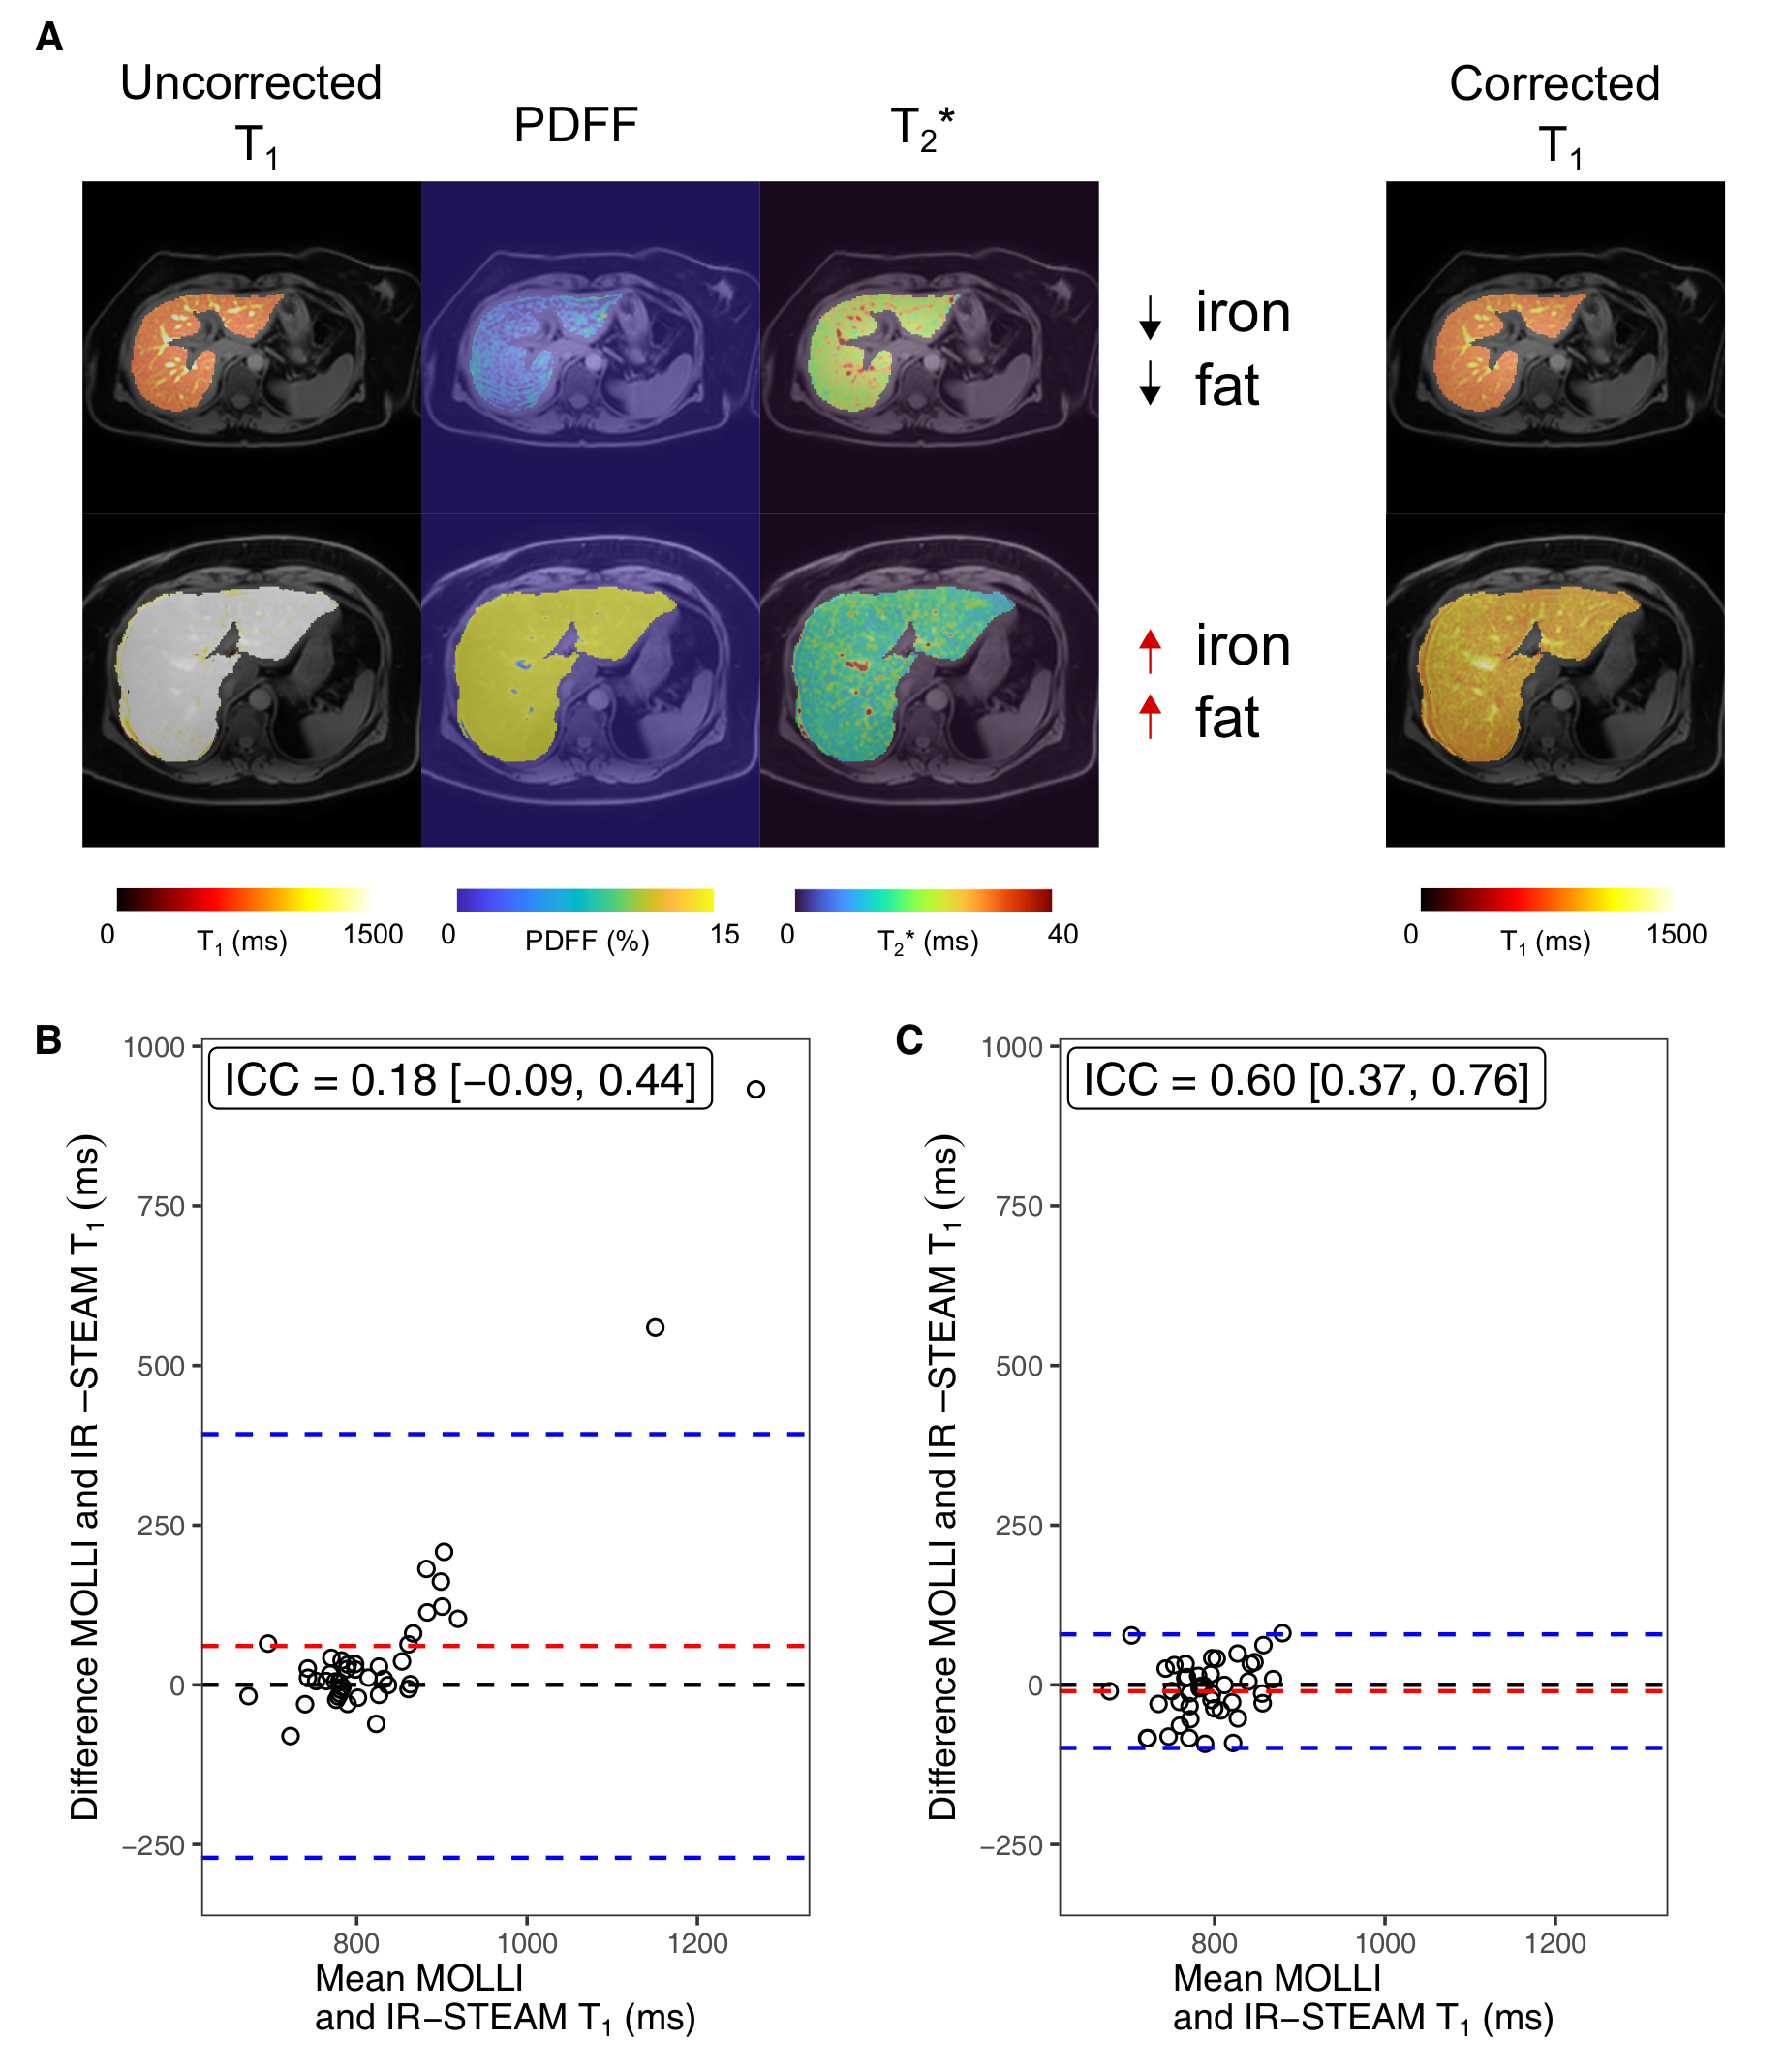
Fig. 3: Determination of water T1 in vivo measurements
(A) Multiparametric MR images including uncorrected and corrected T1 (ms), PDFF (%) and T2* (ms) maps with low or high iron and hepatic lipid content. The Bland-Altman plots display the differences between the IR-STEAM and (B) the uncorrected and (C) the corrected MOLLI T1 values agaist the mean values. The mean (red lines) and the limits of agreement (blue lines) are shown along with the intraclass correlation coefficient (ICC) for the uncorrected (ICC=0.18 [−0.09, 0.44]) and the corrected T1 values (ICC=0.60 [0.37, 0.76]).
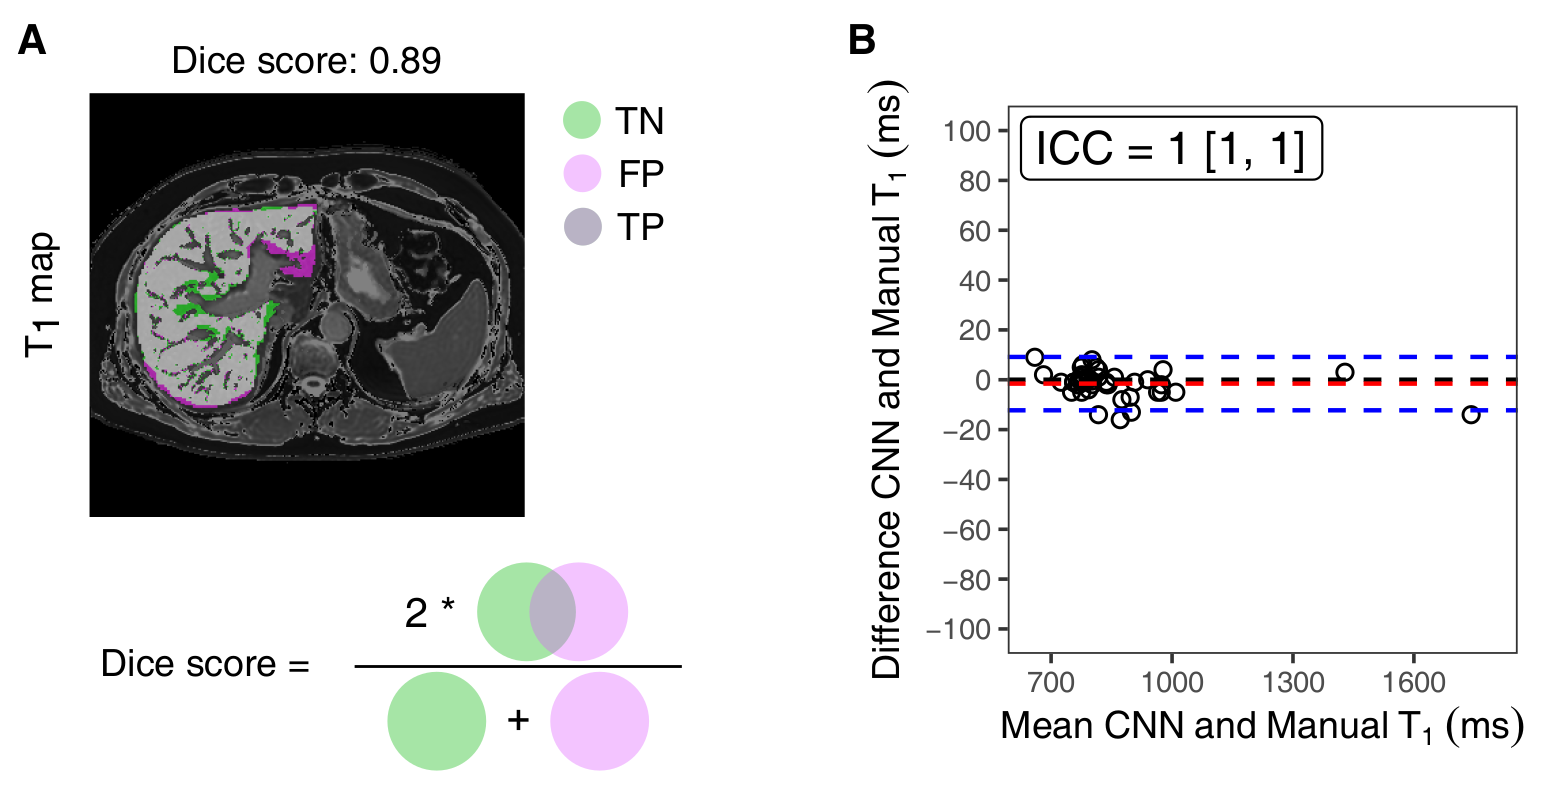
Fig. 4: Segmentation and quantification of liver T1
(A) Representative liver mask produced by the CNN model with 0.89 of Dice score. The true positive (TP, light grey), true negative (TN, light green) and false negative (FN, light purple) pixels are displayed throughout the liver parenchyma. (B) The Bland-Altman plot shows the difference between the liver T1 (ms) obtained either from manual delineation of liver contours or using a 3D-CNN against the mean values. The respective intraclass correlation coefficient between the two methods are displayed (ICC=1.0 [1.0, 1.0]).
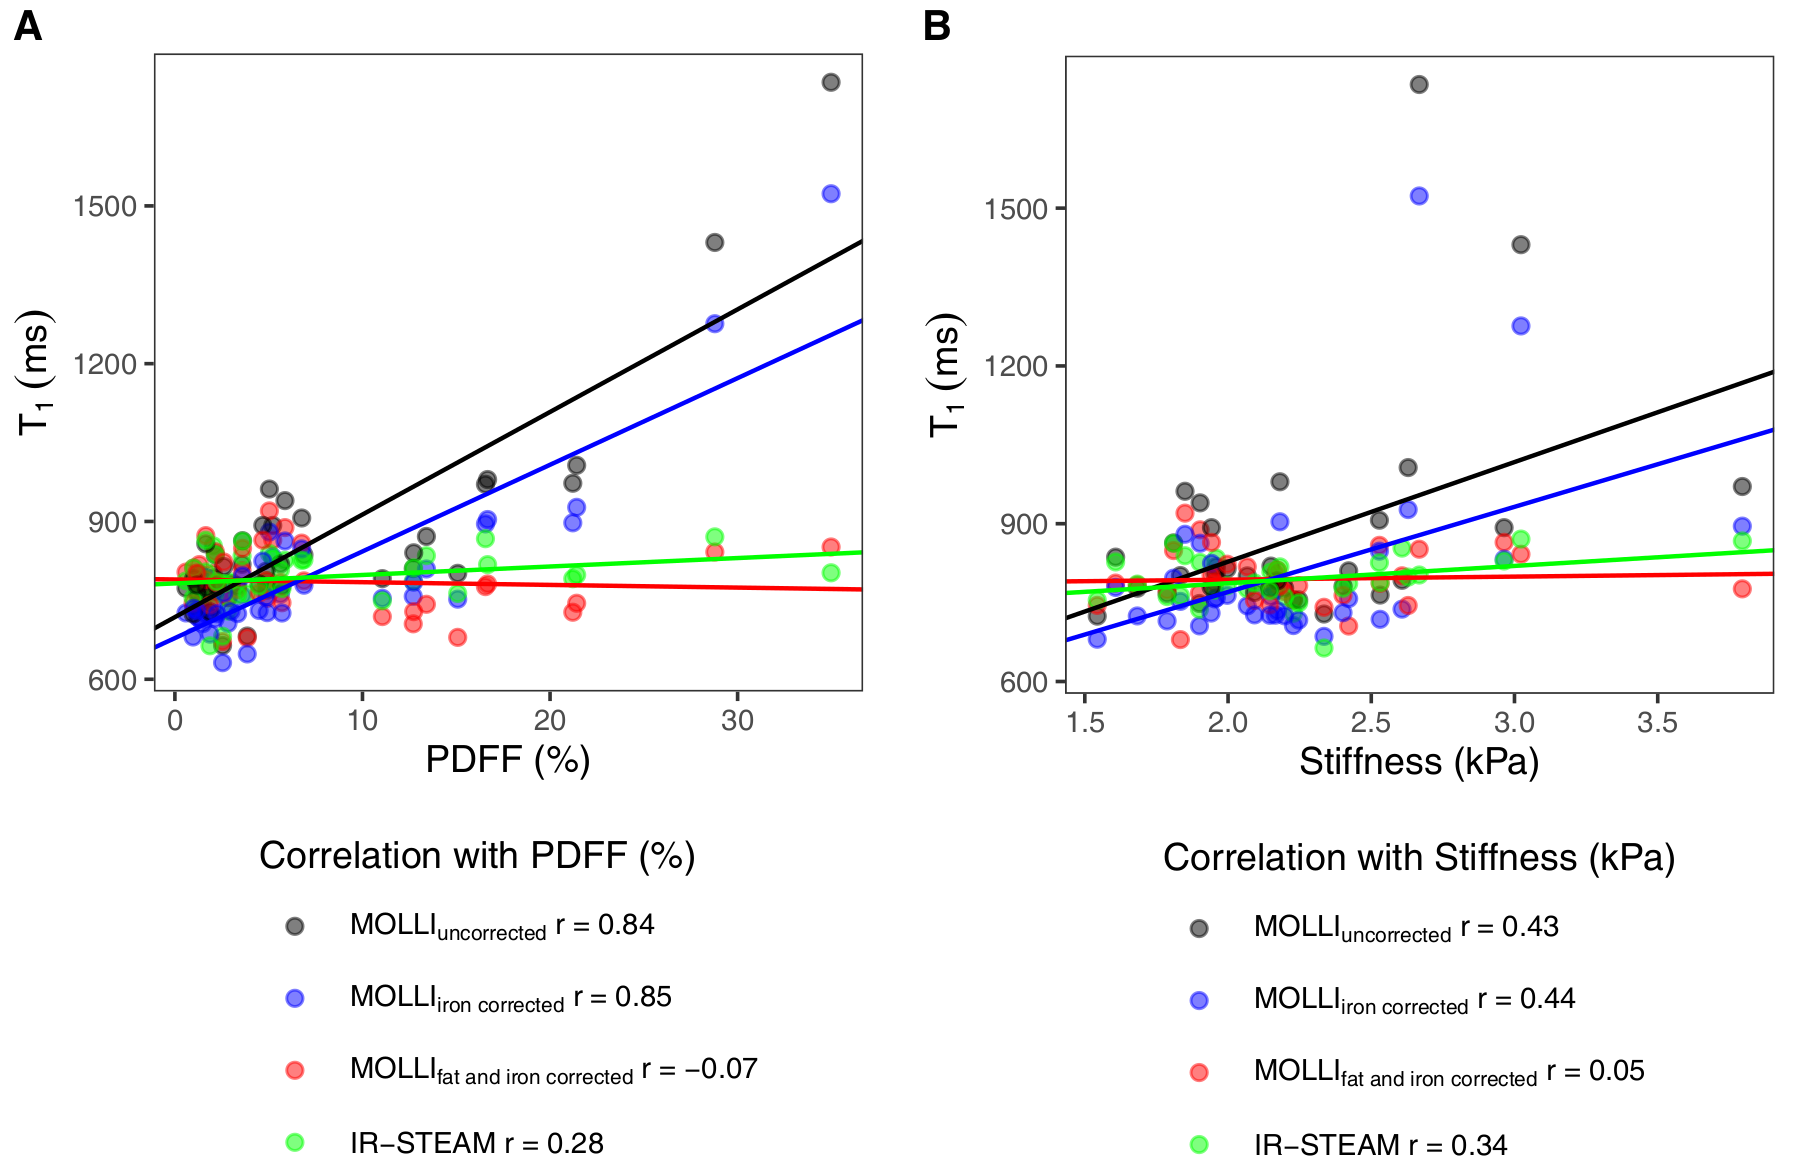
Fig. 5: Effect of T1 correction on the correlation with liver stiffness
(A) Correlation between MOLLI T1 (ms) and PDFF (%). The Pearson's r correlation coefficient are shown for uncorrected (r=0.84, P<0.0001), only iron-corrected ( r=0.85, P<0.0001) and iron- and fat-corrected MOLLI T1 (r=-0.07, P=0.64) and IR-STEAM T1 (r=0.28, P=0.07). (B) Correlation of the MOLLI T1 and liver stiffness (kPa) with coefficients shown for the uncorrected (r=0.43, P=0.01), iron-corrected (r=0.44, P=0.01), iron- and fat-corrected MOLLI T1 (r=0.05, P=0.77) and IR-STEAM T1 (r=0.34, P=0.05).