1085
Validation of Non-Invasive Relative Pressure Mapping by 4D Flow MRI in Aortic Dissection1Dept. of Biomedical Engineering, University of Michigan, Ann Arbor, MI, United States, 2Dept. of Radiology and Biomedical Imaging, University of California San Francisco, San Francisco, CA, United States, 3Dept. of Radiology, University of Michigan, Ann Arbor, MI, United States, 4Dept. of Radiology, Stanford University, Stanford, CA, United States, 5Dept. Molecular Medicine and Surgery, Karolinska Institutet, Stockholm, Sweden, 6Institute for Medical Engineering and Science, Massachusetts Institute of Technology, Cambridge, MA, United States
Synopsis
Keywords: Quantitative Imaging, Blood vessels, Pressure Estimation
False lumen (FL) growth rate in type B aortic dissection (TBAD) is correlated with FL pressurization. 4D flow MRI allows for quantitative assessment of three-dimensional flow, including spatial mapping of relative pressure. Despite its promise, 4D flow relative pressure mapping has not yet been validated in a TBAD-specific context. Here, we validate a state-of-the-art proposed Stokes Estimator (STE) of relative pressure against catheter measurements using three physiologically accurate TBAD flow phantoms and subsequently analyze the method’s sensitivity to image noise. STE pressure estimates closely matched catheter data and were robust to noise, indicating STE’s potential for TBAD treatment planning.
Introduction
Treatment plans for patients with uncomplicated type B aortic dissection (TBAD) utilize false lumen (FL) growth rate as a key indicator of rupture risk1. However, current biomarkers, such as FL diameter, only weakly correlate with FL growth rate2. We recently proposed a method to predict FL growth by estimating mean FL pressure drop using 4D flow MRI3, showing independent correlation with clinically observed growth rates. Three-dimensional relative pressure mapping has not yet been validated in TBAD, however. Herein, we extend and validate the Stokes Estimator (STE)4,5 to provide spatial relative pressure maps from 4D flow MRI within the setting of aortic dissection. Using patient-specific 3D-printed TBAD phantom models6, we compare STE pressure estimates against catheter-based pressure measurements. In addition, STE’s sensitivity to noise is evaluated, elucidating the robustness of relative pressure mapping.Methods
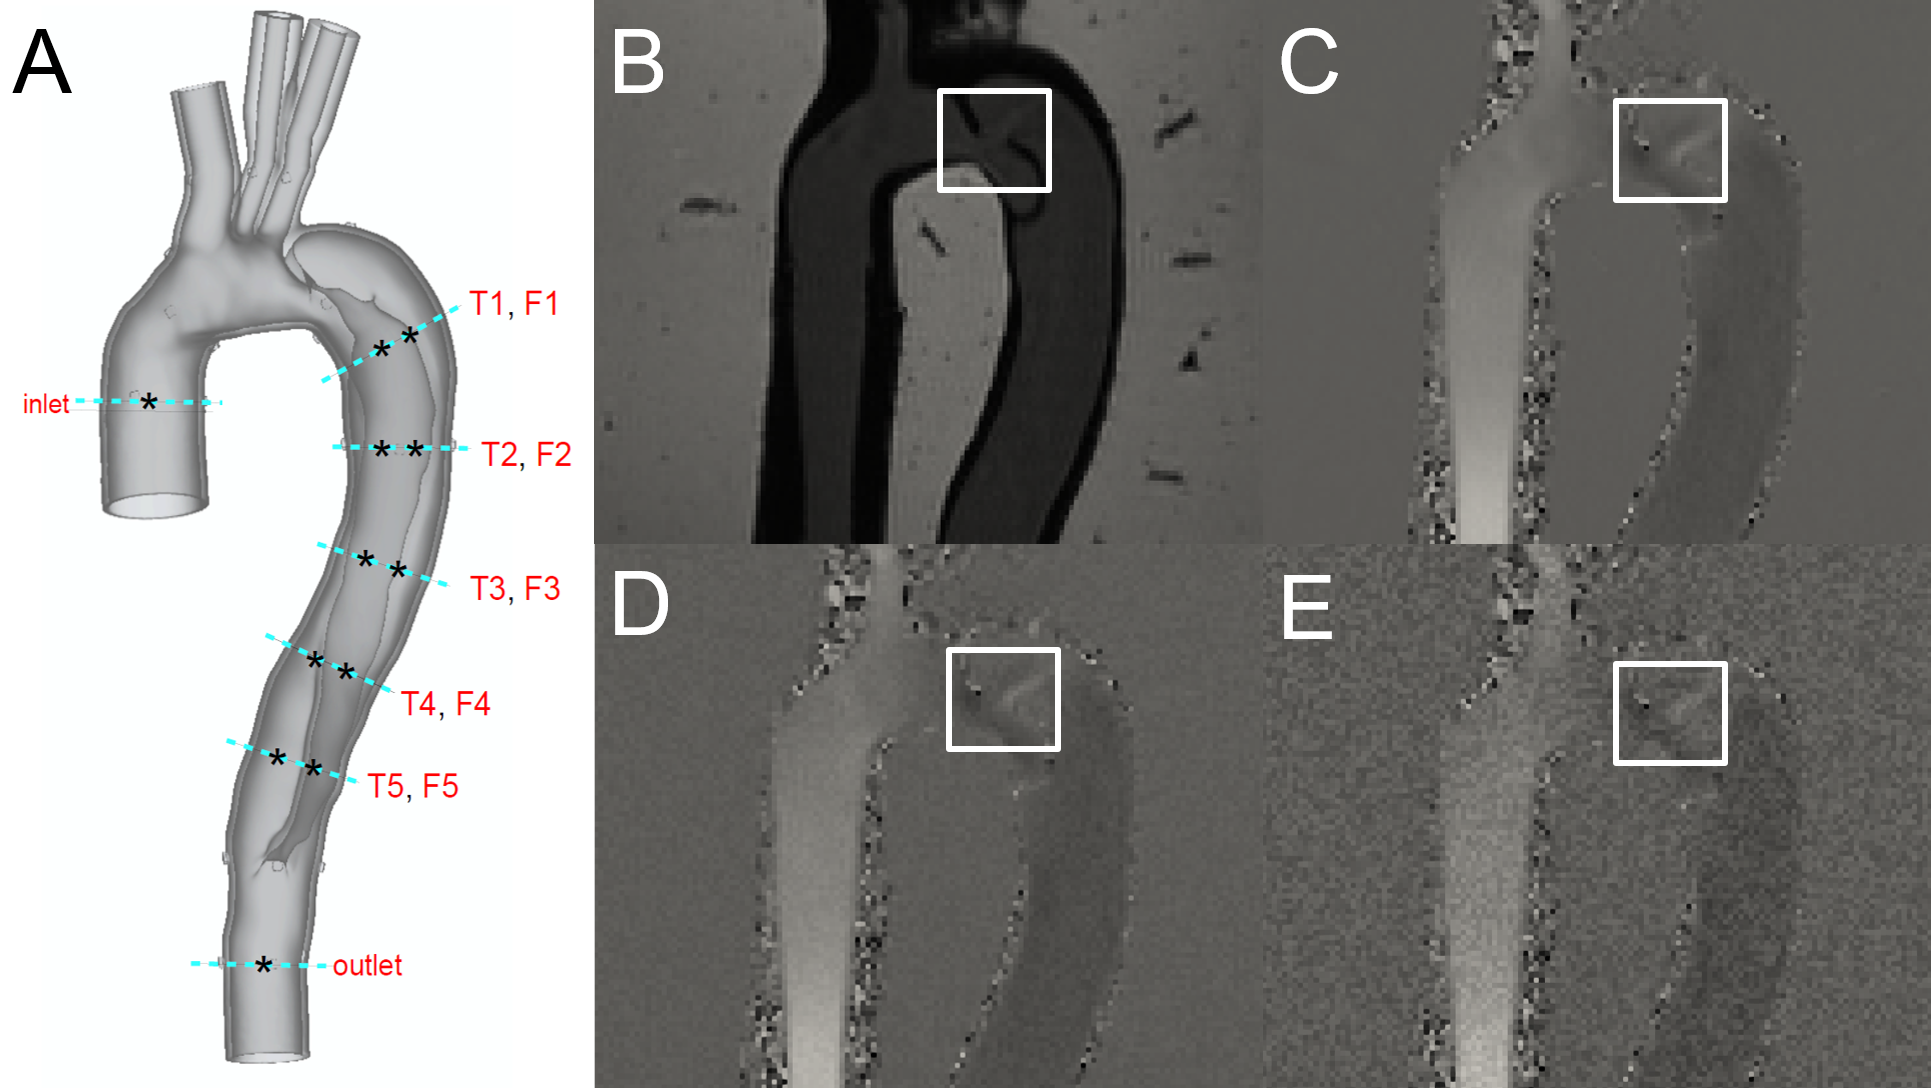
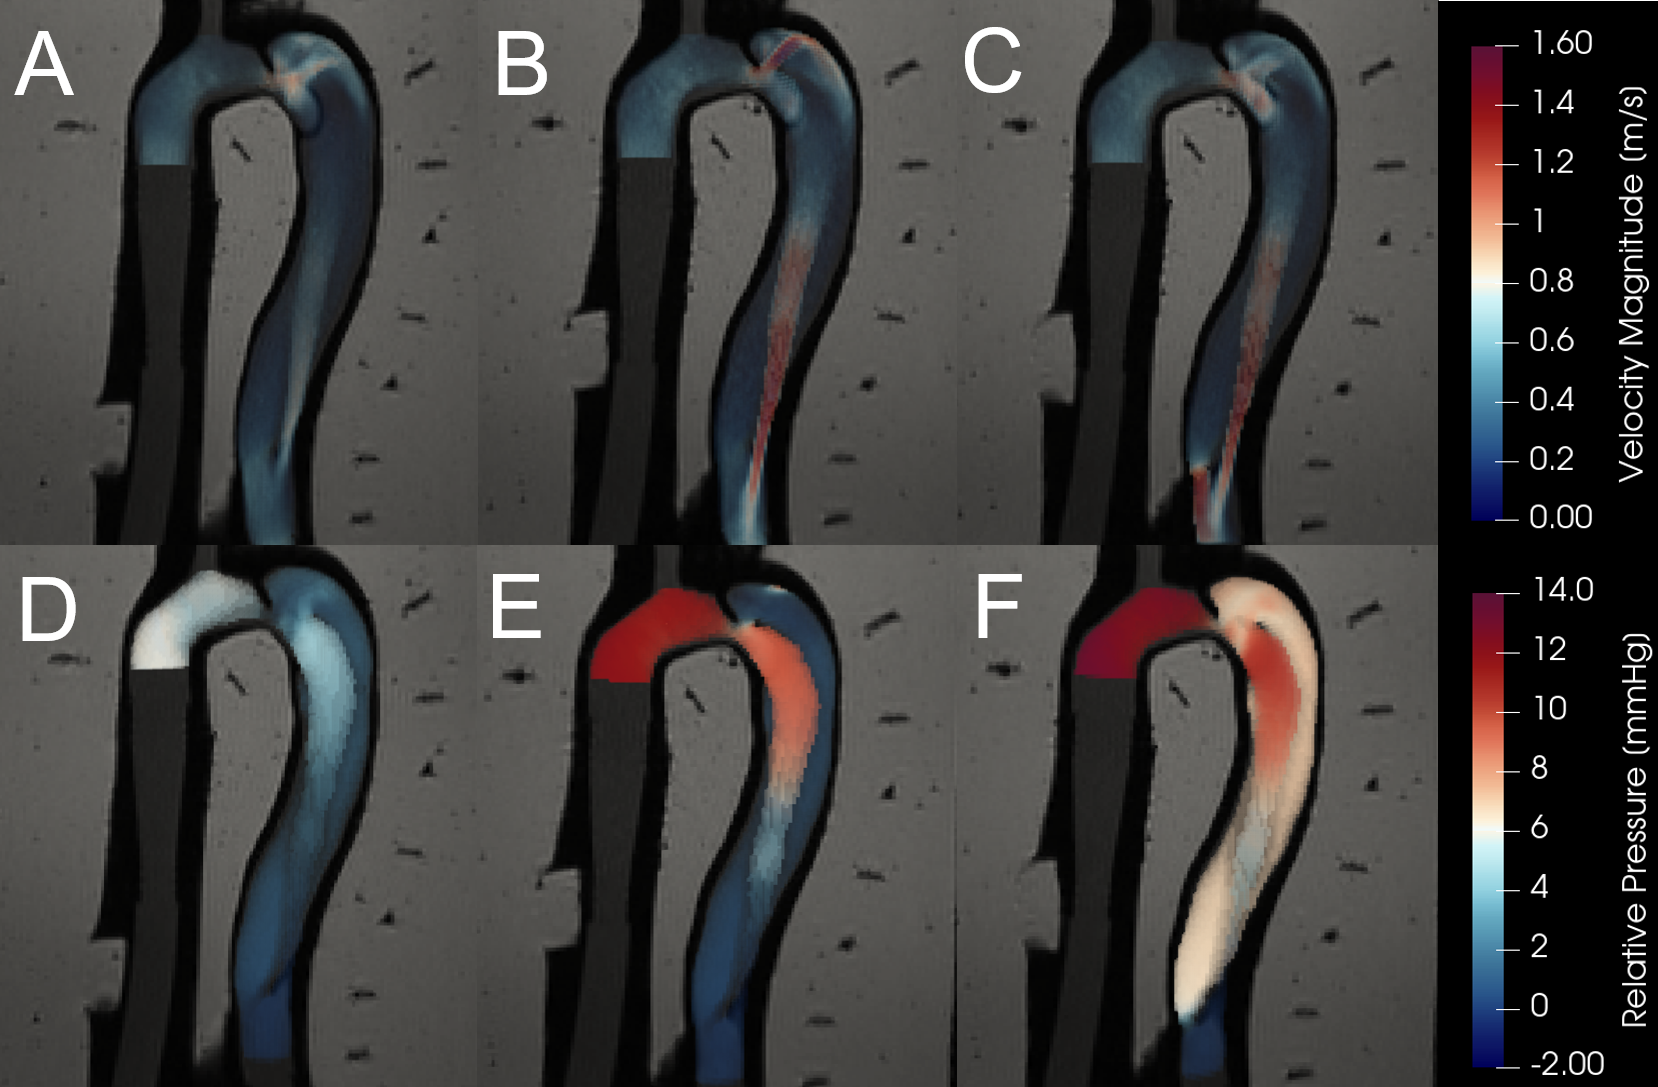
STE was validated using an in vitro flow setup with an embedded compliant 3D-printed TBAD geometry derived from a clinical CT exam and applied physiologically accurate pulsatile flow- and pressure boundary conditions3. 4D flow MRI (3T; voxel size = 1.5x1.5x1.5 mm; temporal resolution = 50 ms; VENC = 1.2-1.7 m/s) was acquired across three models: one baseline model (BL) and two additional models with identical anatomy, but with either a reduced FL entry (BLent) or exit (BLext) tear7. Twelve catheter pressure measurements were acquired at consistent locations across each model (Fig. 1).3D relative pressures maps were calculated from 4D flow images using STE (Fig. 2), which utilizes a Stokes projection problem with a divergence-free auxiliary function, $$$ \widetilde{\mathbf{u}} $$$, to estimate the relative pressure field:
$$ \begin{equation}
\nabla\cdot\mu\left(\nabla\widetilde{\mathbf{u}}+\nabla{\widetilde{\mathbf{u}}}^T\right)-\nabla p=\rho\frac{\partial\mathbf{u}}{\partial t}+\rho\mathbf{u}\cdot\nabla\mathbf{u}-\mu\Delta\mathbf{u}
\end{equation}$$
$$ \nabla\cdot\widetilde{\mathbf{u}}=\ 0 $$
Pressure drops were compared directly to catheter measurements by selecting pressure voxels within the relevant planes (see Fig. 1A), then calculating the average over each plane. A sensitivity analysis was performed by adding synthetic noise to the original images, where the standard deviation:
$$ \sigma_v = \frac{\sqrt{2}v_{\text{max}}}{\pi\cdot\Delta\text{SNR}} $$
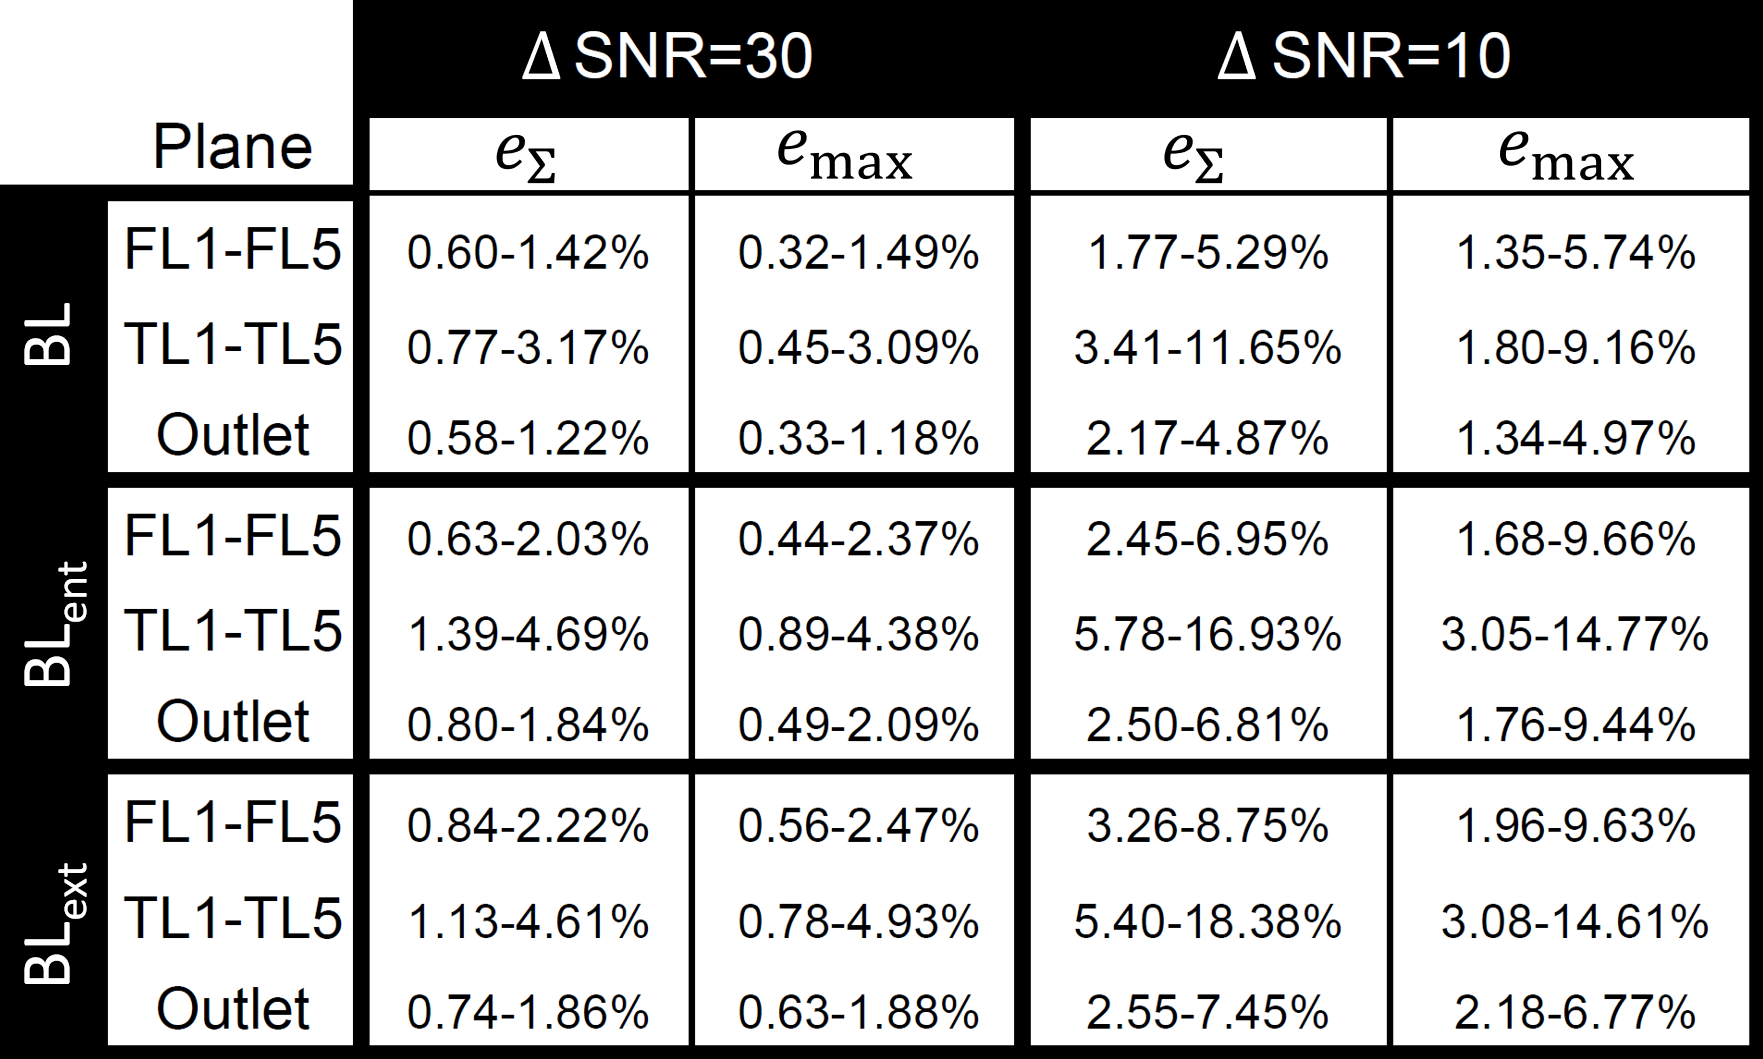
was used to define a Gaussian noise distribution (Fig. 1D-E) truncated at the 2nd standard deviation. Each model was evaluated at both ΔSNR=10 and ΔSNR=30 with n=50 randomly generated noise fields. The resulting pressure estimations from the velocity fields with added noise were compared to the original (no additional noise) pressure estimation at each plane. Sensitivity to noise was then quantitatively assessed using the deviation metrics below:
$$ e_{\Sigma} = \frac{\Sigma^n_1 |P_{\text{original}}(t_n) - P_{\text{added noise}}(t_n)|}{\Sigma^n_1 |P_{\text{original}}(t_n)|} $$
$$ e_{\max} = \frac{\underset{n\in[1,n]}\max{|P_{\text{original}}(t_n) - P_{\text{added noise}}(t_n)|}}{\underset{n\in[1,n]}\max{|P_{\text{original}}(t_n)|}} $$
The first deviation metric, eΣ, represents a measure of the mean deviation from original pressure estimations, whereas emax is simply the maximum deviation normalized by the maximum original pressure.
Results
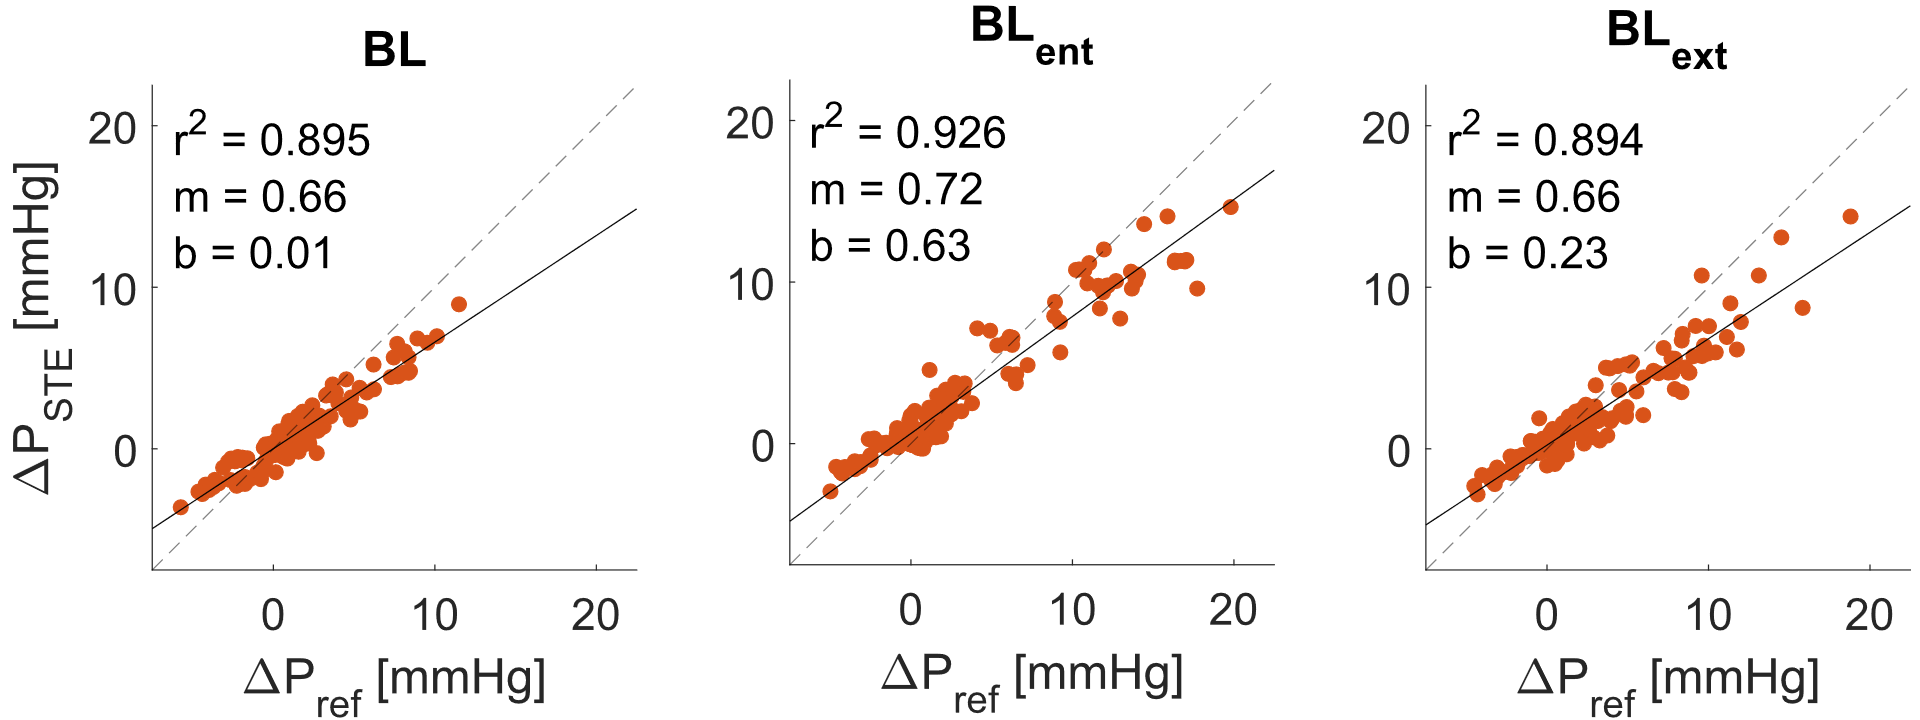
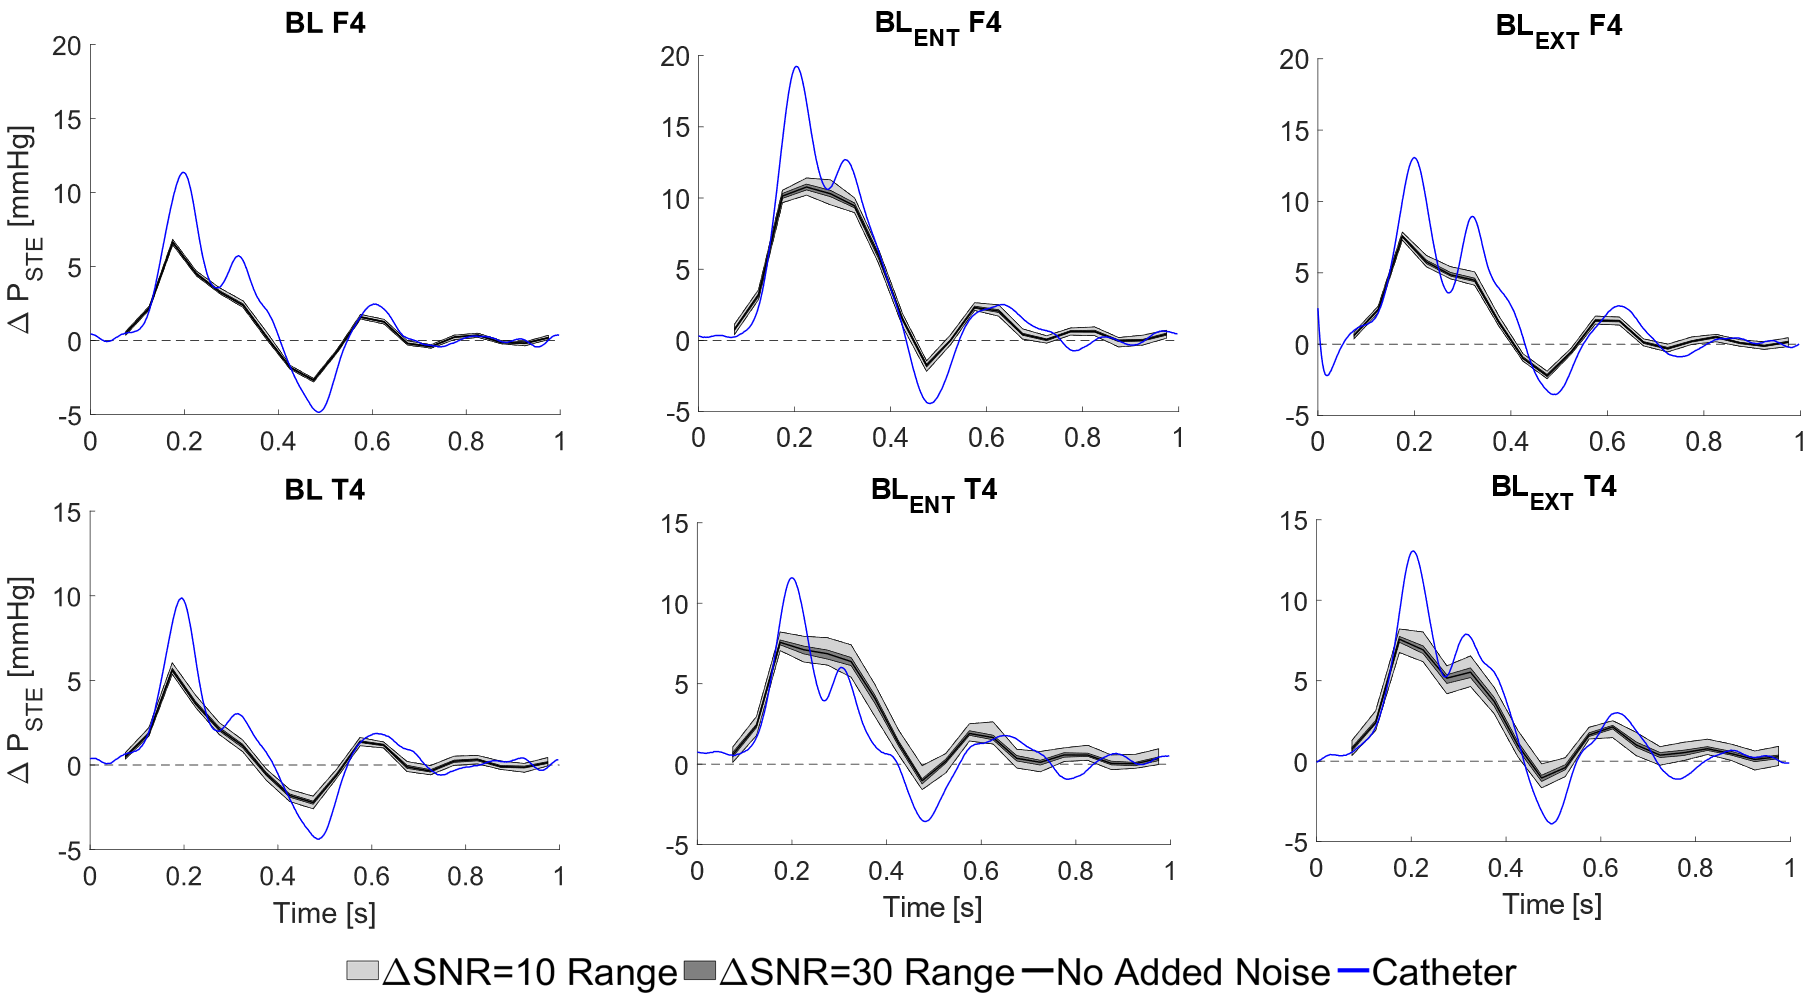
STE showed qualitative agreement with invasive catheter measurements (Fig 3.). STE correlations were strong (r2 = 0.905), with moderate underestimation at peak relative pressure (mean slope = 0.68, mean bias = 0.01 ± 1.9 mmHg). Overall, STE was robust to noise. Fig. 4 gives a graphical summary of the observed sensitivity trends at a representative location (F4 and T4 – see Fig 1.) across all models. Fig. 5 presents a complete overview of the calculated sensitivity deviations. Across all models, true lumen pressure measurements were substantially more sensitive to added noise than false lumen pressure measurements. Pressure measurements in BLent and BLext were also more sensitive to noise than BL, particularly at peak systole.Discussion
Across all models STE strongly followed catheter measurements and was robust against noise. There were a few clear trends across the sensitivity analysis. First, across all models, we see higher estimation deviations in the true lumen compared to the false lumen. This is likely a consequence of fewer voxels representing the assessed flow field through the comparatively thin true lumen. Second, although deviations increase with increasing noise levels, comparably similar performance is observed at both low (ΔSNR=30) and high (ΔSNR=10) added noise configurations. Third, deviations seem higher in regions that are more dependent on advective pressure contributions; this trend is most visible in BLent, where the reduced entry tear size induces enhanced advective flow distal to the tear. Further assessment of this trend will have to be performed in future studies.Additionally, a tendency to underestimate peak relative pressures in dissection-specific geometries was indicated. Given the highly transient flow behavior that takes place during systole, this underestimation might stem from the comparably coarse temporal sampling of the 4D acquisition. For example, in many cases two adjacent time frames would entirely miss the flow behavior at the relative peak pressure indicated from catheter measurements (Fig. 4). Future studies will need to analyze STE’s performance at a variety of temporal resolutions.
Conlusion
STE analysis of 4D flow MRI allows for relative pressure mapping, validated by agreement with catheter-based pressure measurements in three TBAD flow phantoms. STE was also shown to be robust to Gaussian noise, supporting clinical applicability. Qualitative assessment of STE indicated a moderate tendency to underestimate peak systolic relative pressures, although the reason for this underestimation is uncertain. We suspect insufficient temporal sampling plays a role8, motivating the use of temporal upsampling algorithms or revised acquisition methods. Overall, the data demonstrate the potential of STE in conjunction with 4D flow MRI for quantitative hemodynamic estimations of FL relative pressure.Acknowledgements
DN acknowledges funding from the Engineering and Physical Sciences Research Council Healthcare Technology Challenge Award (EP/R003866/1), and support from the Wellcome Trust EPSRC Centre of Excellence in Medical Engineering (WT 088641/Z/09/Z) and the NIHR Biomedical Research Centre at Guy's and St. Thomas' NHS Foundation Trust and KCL. DM acknowledges funding from the Knut and Alice Wallenberg foundation.References
- Rudenick et al, PLoS One, 12, 2017.
- Spinelli et al, J Vasc Surg, 68, 6, 2018.
- Marlevi et al, J Cardiovasc Magn Reson 23, 51, 2021.
- Bertoglio et al, Int J Numer Meth Biomed Engng, 34, 2018.
- Švihlová et al, Int J of Engrng Sci, 114, 2017.
- Zimmermann et al, FIMH 2021, Lecture Notes in Computer Science, vol 12738.
- Zimmermann et al, In: ISMRM 2022, London
- Marlevi et al, Magn Reson Med, 86, 2021.
Figures