1079
Dual Venc 5D flow MRI with Increased Velocity Dynamic Range: An in-vitro and in-vivo Validation and Feasibility Study1Radiology, Northwestern University, Chicago, IL, United States, 2University of Lausanne (CHUV), Lausanne, Switzerland
Synopsis
Keywords: Flow, Pulse Sequence Design
We illustrate a pilot study of the first implementation of dual-venc 5D flow MRI. We found excellent voxel-wise agreement with single-venc 5D flow in a pulsatile phantom. In two healthy controls, we find good agreement, but identify unexpected aliasing in the dual venc 5D flow which requires further investigation.Introduction
Respiration has been shown to be an important driver of hemodynamics in patients post-Fontan repair.1 5D flow MRI2 is a new, free-running, self-gated, highly accelerated method to measure respiration driven 3D blood flow velocities over the cardiac and respiratory cycles. However, a single velocity encode (venc) in 5D flow MRI limits the velocity dynamic range. This is problematic when both venous and arterial flows must be measured (e.g., aortopulmonary collateral quantification). To address this limitation, we developed dual-venc 5D flow MRI which takes advantage of high velocity-to-noise ratio (VNR) of low venc acquisitions while correcting aliasing with high venc data. The goal of this study was to validate the technique in vitro and demonstrate its feasibility in healthy volunteers.Methods
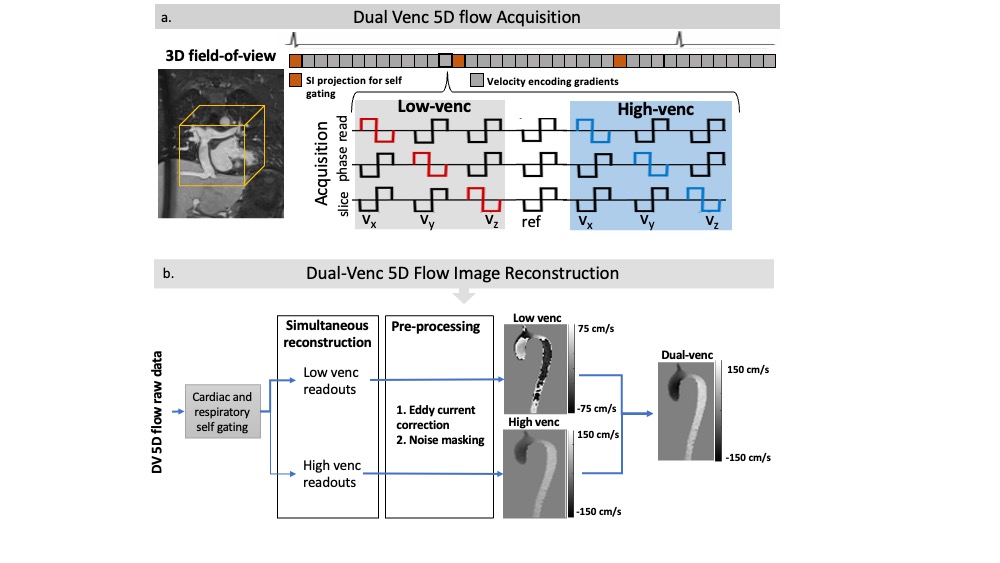
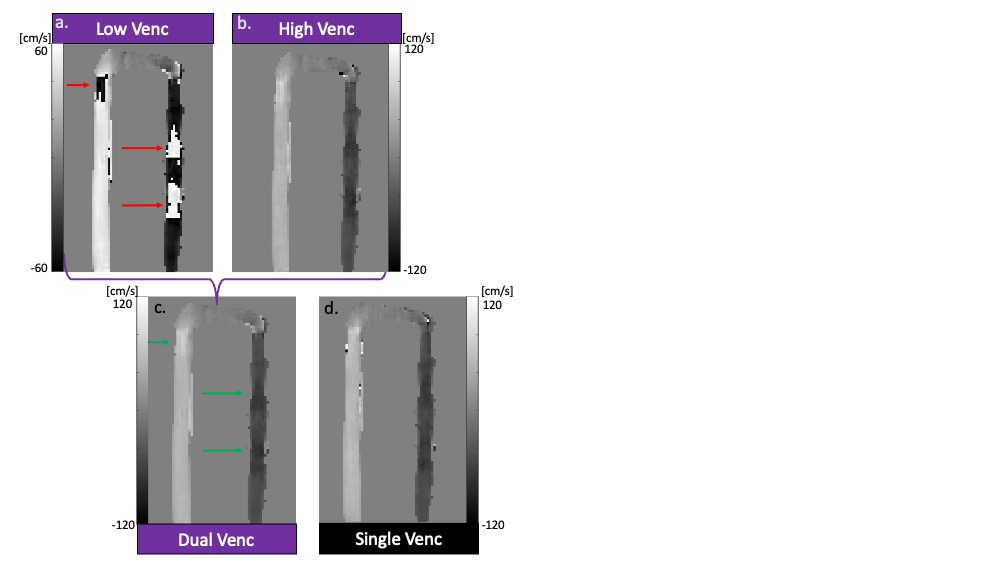
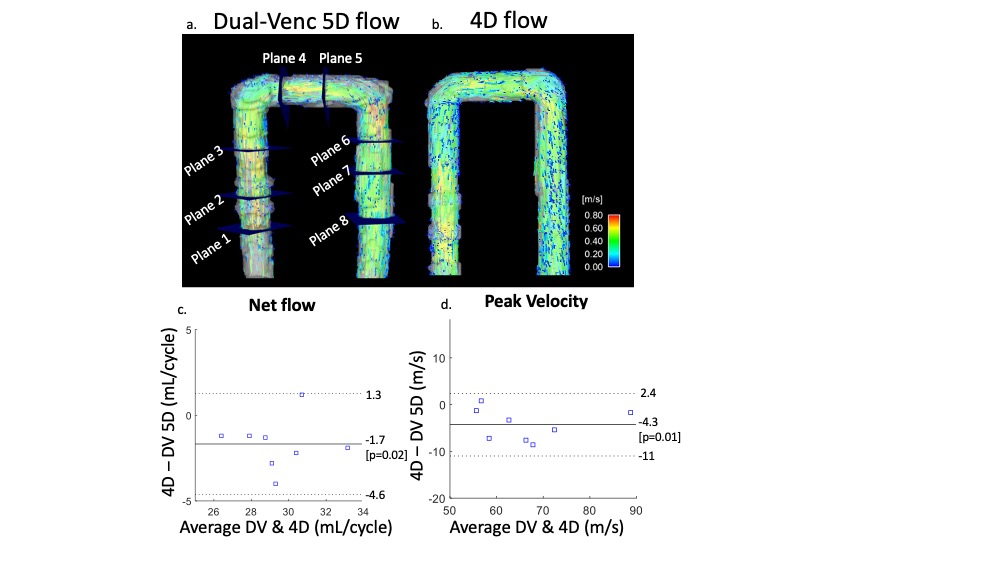
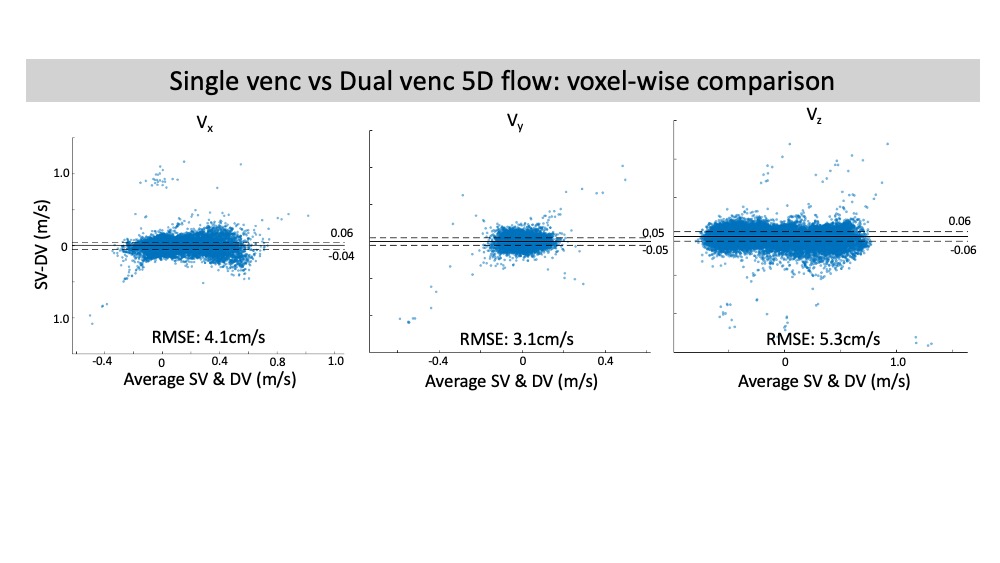
The proposed dual venc (DV) 5D flow MRI sequence utilized a 7-point velocity encoding scheme to measure both low venc (LV) and high venc (HV) velocity data (Fig1a). The acquisition (2.5x2.5x2.5mm, TE/TR: 4.1/34.9ms) was free-running, radially sampled, and retrospectively self-gated using respiratory and cardiac signals extracted from superior-inferior readouts. The LV and HV data were reconstructed in parallel using compressed sensing (CS) and were separately preprocessed for background-phase corrections. A difference image (HV-LV) was used to identify and correct velocity aliasing in the LV data as previously described3 (Fig1b). This preserved the favorable VNR of the LV images while correcting aliasing using the HV images. DV 5D flow (venc=60/120cm/s) was acquired in an established pulsatile flow phantom2 (60bpm, U-tube shape, Gd enhanced water) for validation. The respiratory dimension was collapsed in this experiment. Single venc (SV) 5D flow (venc=120cm/s) and 4D flow (venc=120cm/s) were also acquired. Both 5D flow scans had set scan times (SV: 8.5min, DV: 18min) that acquired 4820 radial spokes with 6 subshots for velocity encoding (4 gradients in SV, 7 in DV). Net flow and peak velocity were measured in several 2D regions of interest (Fig3a). VNR (Eq1) was calculated in both SV and DV 5D flow images (water bottles used as static tissue). DV (venc=75/150cm/s) and SV (venc=150cm/s) 5D flow were also acquired in 2 healthy adults. Voxel-wise comparisons were made in a region with velocity aliasing in the LV, but not HV, data. VNR in the caval veins was calculated in both SV and DV 5D flow images (spine segmented for static tissue). Only end-expiration was compared in this study.$$VNR=mean(velocity_{3D segmentation}))/(SD(velocity_{static tissue}) [EQ1]$$
Results
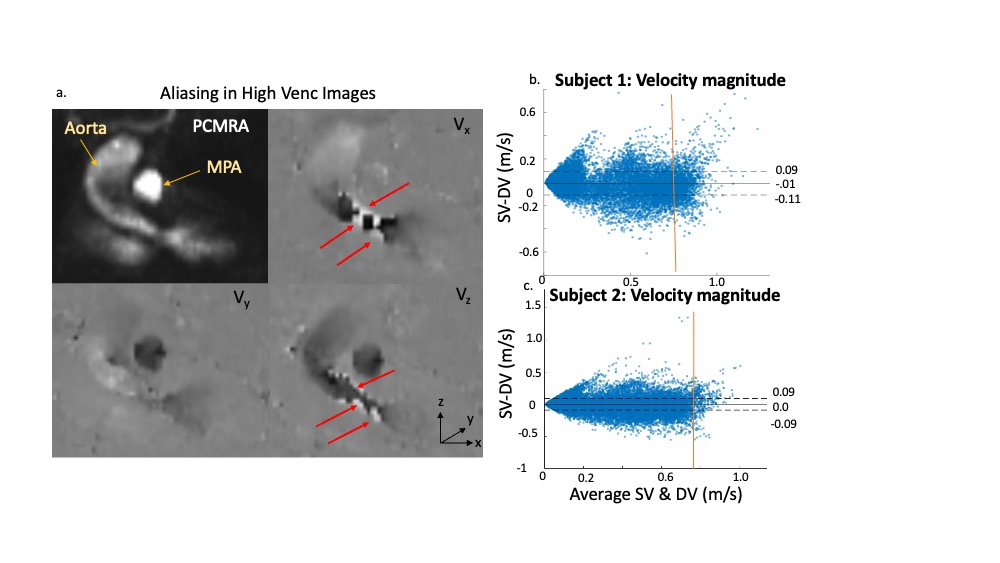
In-vitro validation: Aliasing was seen in LV images (Fig2a) that was corrected in the DV images (Fig2c). Bland-Altman analysis revealed good agreement with 4D flow for net flow (limits of agreement [LOA]: 2.9mL, 10% of mean net flow) and peak velocity (LOA: 6.7cm/s, 10% of mean peak velocity) (Fig3). However, there was significant overestimation by DV 5D flow compared to 4D flow in both net flow (1.7mL, p=0.02, 6% of mean net flow) and peak velocity (4.2cm/s, p=0.01, 7% of mean peak velocity). Bland-Altman analysis for voxel-wise comparisons of SV and DV velocities had significant bias (<1cm/s, p<.01) and LOA of <6cm/s in all velocity directions (7% of peak velocity and 13% of mean velocity at peak flow, Fig4). VNR increased 69% in DV images compared to SV images.In-vivo feasibility: In both volunteers, there was unexpected aliasing near the aortic valve in HV images (Fig5a) and was thus uncorrected in the DV images. However, there was appropriate correction of aliasing in other regions, such as the descending aorta (Fig5b), which had good agreement of velocity magnitude in both subjects between SV and DV 5D flow (LOA: 11 & 9cm/s, bias <1cm/s p<.01, Fig5b). This was 11% and 10% of peak velocity in the DAo respectively. Additionally, the DV images had an 80% increase and 109% increase in VNR in each subject, respectively.
Discussion
We demonstrate the first implementation of DV 5D flow MRI. The acquisition improved VNR >65% compared to SV 5D flow which is greater than what could be achieved from simply increasing the scan time to 18 minutes (45% increase). The theoretical VNR increase due to halving the venc was ~100%. Variation from this may be due to the high acceleration, imperfect background phase correction, or CS regularization. The increased VNR will improve the utility of 5D flow in Fontan patients. For example, slow, venous flow has been shown to vary with respiration.2 However, selecting a venc to best measure this precludes analysis in narrowed pulmonary arteries, a possible cause of Fontan failure.4 While these are promising results, in vivo data suggests that further investigation is necessary to prevent aliasing seen near the aortic valve. This artefact may reflect increased noise due to imbalanced distribution of the first magnetic moment in the HV gradients or increased motion noise due to long scan times. This study served to establish in vitro validation and in vivo feasibility of dual venc 5D flow MRI. Additional studies are necessary to investigate the impact of DV 5D flow on respiratory driven hemodynamicsConclusion
We illustrated a pilot study of the first implementation of dual-venc 5D flow MRI. We found good agreement with single venc 5D flow and 4D flow in a pulsatile phantom in addition to increased VNR.Acknowledgements
No acknowledgement found.References
1. Wei, Z., Whitehead, K. K., Khiabani, R. H., Tree, M., Tang, E., Paridon, S. M., ... & Yoganathan, A. P. (2016). Respiratory effects on Fontan circulation during rest and exercise using real-time cardiac magnetic resonance imaging. The Annals of thoracic surgery, 101(5), 1818-1825.
2. Ma, L. E., Yerly, J., Piccini, D., Di Sopra, L., Roy, C. W., Carr, J. C., ... & Markl, M. (2020). 5D flow MRI: a fully self-gated, free-running framework for cardiac and respiratory motion–resolved 3D hemodynamics. Radiology: Cardiothoracic Imaging, 2(6).
3. Schnell, S., Ansari, S. A., Wu, C., Garcia, J., Murphy, I. G., Rahman, O. A., ... & Markl, M. (2017). Accelerated dual‐venc 4D flow MRI for neurovascular applications. Journal of Magnetic Resonance Imaging, 46(1), 102-114.
4. Amodeo, A., Galletti, L., Marianeschi, S., Picardo, S., Giannico, S., Di Renzi, P., & Marcelletti, C. (1997). Extracardiac Fontan operation for complex cardiac anomalies: seven years' experience. The Journal of thoracic and cardiovascular surgery, 114(6), 1020-1031.
Figures