1078
Biventricular and Hemodynamic Assessment under Multi-stage Exercise using Real-time CMR
Preethi S Chandrasekaran1, Chong Chen2, Yingmin Liu1, Christopher Crabtree3, Syed Murtaza Arshad4, Matthew Tong5, Yuchi Han5, and Rizwan Ahmad2
1Davis Heart and Lung Research Institute, Ohio State University, Columbus, OH, United States, 2Biomedical Engineering, Ohio State University, Columbus, OH, United States, 3Department of Human Sciences, Ohio State University, Columbus, OH, United States, 4Electrical and Computer Engineering, Ohio State University, Columbus, OH, United States, 5Cardiovascular Medicine, Ohio State University, Columbus, OH, United States
1Davis Heart and Lung Research Institute, Ohio State University, Columbus, OH, United States, 2Biomedical Engineering, Ohio State University, Columbus, OH, United States, 3Department of Human Sciences, Ohio State University, Columbus, OH, United States, 4Electrical and Computer Engineering, Ohio State University, Columbus, OH, United States, 5Cardiovascular Medicine, Ohio State University, Columbus, OH, United States
Synopsis
Keywords: Heart, Velocity & Flow, Exercise CMR
A comprehensive exercise stress cardiovascular MRI (Ex-CMR) was performed in twelve healthy subjects. Biventricular quantification was performed from real-time cine, while hemodynamic parameters in the ascending aorta and main pulmonary artery were estimated using real-time flow. The acquisition process was repeated two to three times at increasing exercise intensities. The highly accelerated (R = 7-8 for cine and R = 16 for flow) real-time data were reconstructed inline using Gadgetron-based compressed sensing reconstruction. In agreement with the literature, the ejection fraction and cardiac output correlated positively with exercise intensity.Introduction
Exercise stress Cardiovascular MRI (Ex-CMR) may improve risk assessment and early diagnosis of cardiovascular disease. Exercise is preferred over pharmacologic stress because the level of exercise provides prognostic information. Despite the commercial availability of in-magnet supine ergometers, acquiring and processing Ex-CMR data remains technically challenging due to high heart rates, rapid and exaggerated breathing motion, unreliable ECG signal, limited time window to collect data, and degraded image quality. Here, we demonstrate the feasibility of acquiring real-time cine (RT-Cine), real-time aortic and pulmonic flow (RT-Flow) from twelve healthy volunteers at multiple stages of exercise. This is accomplished by leveraging (i) highly accelerated RT-Cine and RT-Flow imaging, (ii) compressed sensing-based inline reconstruction, (iii) data-driven heart-rate estimation, (iv) and utilization of multiple coil sensitivity maps to suppress artifacts. In this preliminary study, we report biventricular function as well as aortic and pulmonic peak velocities.Methods
Twelve healthy volunteers (10 male, 28±7 years; BMI: 19.5–32.7 kg/m2) were scanned under free-breathing conditions using prototype RT-Cine [1] and RT-Flow [2] sequences on a 3T scanner (Vida, Siemens Healthcare, Erlangen, Germany). Volunteers were imaged at rest and during exercise with a supine cycle ergometer (Lode BV, Netherlands) at workloads of 20 W, 40 W, and 60 W (nine subjects). At each stage, a shot-axis (SAX) stack of RT-Cine covering the whole heart as well as ascending aortic (AAo) and main pulmonary artery (MPA) RT-Flow images were acquired. Imaging was initiated 60 s after each increment of resistance to stabilize the heart rate. Fourteen slices were acquired in RT-Cine with Golden Ratio Offset sampling pattern [3] with the following imaging parameters: 6 mm slices for scanning duration of 3 s/slice, TE: (1.1–1.29) ms; TR: (2.55–2.9) ms; acceleration: 7-8; spatial resolution of reconstructed images: (1.82x1.82) mm2 to (2.27x2.27) mm2; temporal resolution: (35.7–50.2) ms, with only one subject above 50 ms; flip angle: (29–44)º. Three parallel slices (7.2 mm apart) of AO/MPA RT-Flow were acquired to accommodate the potential through-plane motion with the following imaging parameters: TE/TR: 2.13/3.58 ms; acceleration: 16; spatial resolution: (2x2) mm2 to (2.75x2.75) mm2; temporal resolution: 43 ms; flip angle: 10º; velocity encoding: 150 cm/s at rest and 250 cm/s at exercise.Data were reconstructed inline with Gadgetron-based implementation of SCoRe [4], a parameter-free SENSE-based compressive sensing method. The reconstructed cine/flow images were analyzed in suiteHEART software (NeoSoft LLC, Pewaukee, WI). To quantify cardiac function, short-axis contours were automatically generated from RT-Cine images and then visually assessed frame-by-frame and modified manually when necessary. Background phase correction was applied on RT-Flow images using a second-order weighted regularized least squares fitting [5]. Then, peak velocity and flow of the ascending aorta at the root level (AAo) and main pulmonary artery (MPA) were quantified using all available complete heartbeats in eleven volunteers. The heart rate at each stage was calculated from the RT-Flow images and then used to calculate the cardiac output.
Results
Cardiac function when tracked from rest to exercise show that end-diastolic volume is relatively stable in both ventricles (Fig. 1a and 2a), whereas end-systolic volume decreases (Fig. 1b and 2b), stroke volume (Fig. 1c-1e and 2c-2e), ejection fraction, and cardiac output increase with exercise. Peak velocity and cardiac output in AAo and MAP were seen to increase (Fig. 3a,c,d,f); however, the stroke volume remained relatively stable (Fig. 3b,3e). Representative images of RT-Cine and RT-Flow from one volunteer are shown in Fig. 4 and 5.Discussion
RT-Cine acquisitions with 14 slices cover the whole heart; however, with exaggerated respiratory motion under exercise, the heart location changes from slice to slice, which can lead to additional variation in the quantification of volumes. In addition, we noticed a degradation in image quality in the basal-most slices due to motion, flow, and field inhomogeneity artifacts. These artifacts were partially suppressed using two sets of sensitivity maps [6]. We anticipate further improvement in the image quality and cardiac function quantification by increasing acquisition time and quantifying the heartbeat in the end-expiratory phase [7].Conclusion
A comprehensive multi-stage real-time exercise protocol was successfully executed in healthy volunteers. The overall image quality was acceptable for quantification and the results are in agreement with the values reported in the literature [8, 9].Acknowledgements
This work was funded by NIH project R01HL151697.References
- C. Chen et al. ISMRM 2018 Abstract #4894
- C. Chen et al. SCMR 2020 Abstract #751158
- M. Joshi et al. arXiv:2206.03630
- R. Ahmad et al. IEEE Transactions on Computational Imaging 1 (4), 220-235 (2015)
- A. Pruitt et al. Magnetic Resonance in Medicine 81:2424–2438 (2019)
- M. Uecker et al. Magnetic Resonance in Medicine 71(3): 990–1001 (2014)
- C. Chen et al. Magnetic Resonance in Medicine 87:1595–1604 (2021)
- T.P. Craven et al. The International Journal of Cardiovascular Imaging 37:685–698 (2021)
- R.I. Beaudry et al. Am. J. Physiol. Regul. Integr. Comp. Physiol. 315: R638–R645 (2018)
Figures
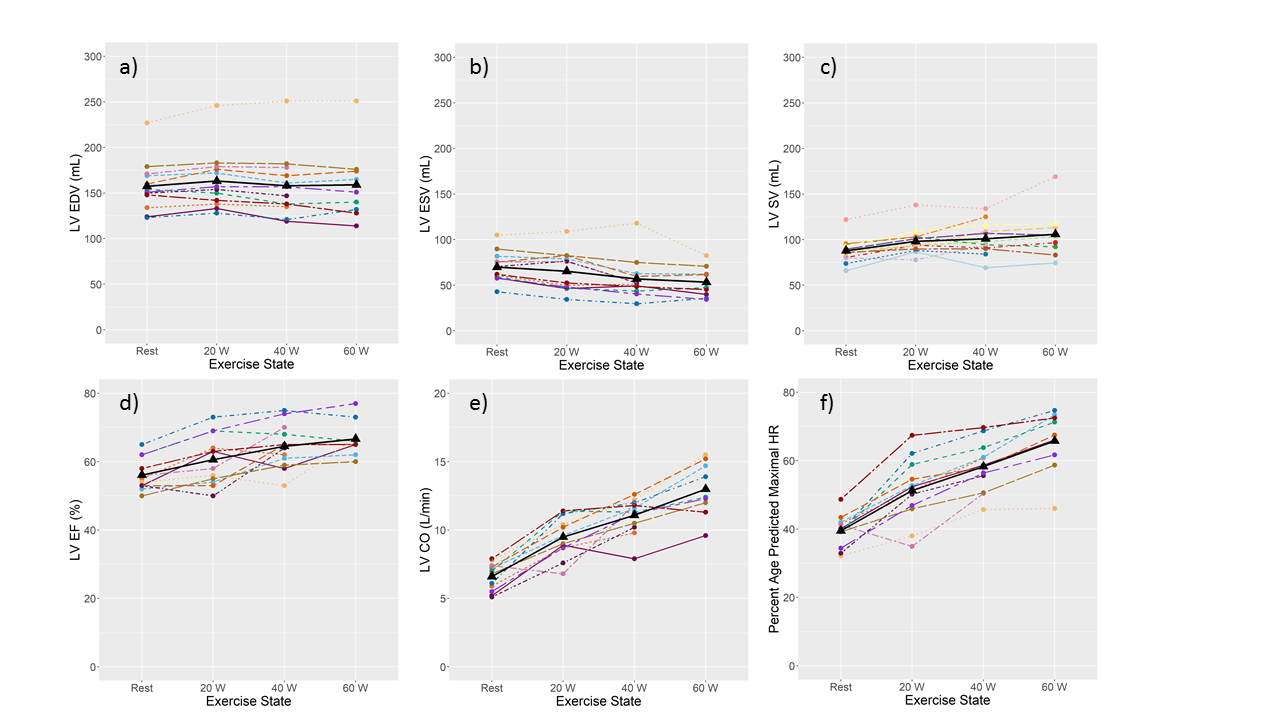
Figure 1: Left
ventricular (LV) function tracked over rest and different exercise intensities
for 12 healthy volunteers. End-diastolic volume (EDV) (a), end-systolic volume (ESV)
(b), stroke volume (SV) (c), ejection fraction (EF) (d), cardiac output (CO) (e),
and heart rate (f) are displayed for each volunteer represented by different
colors and the mean is coded in black.
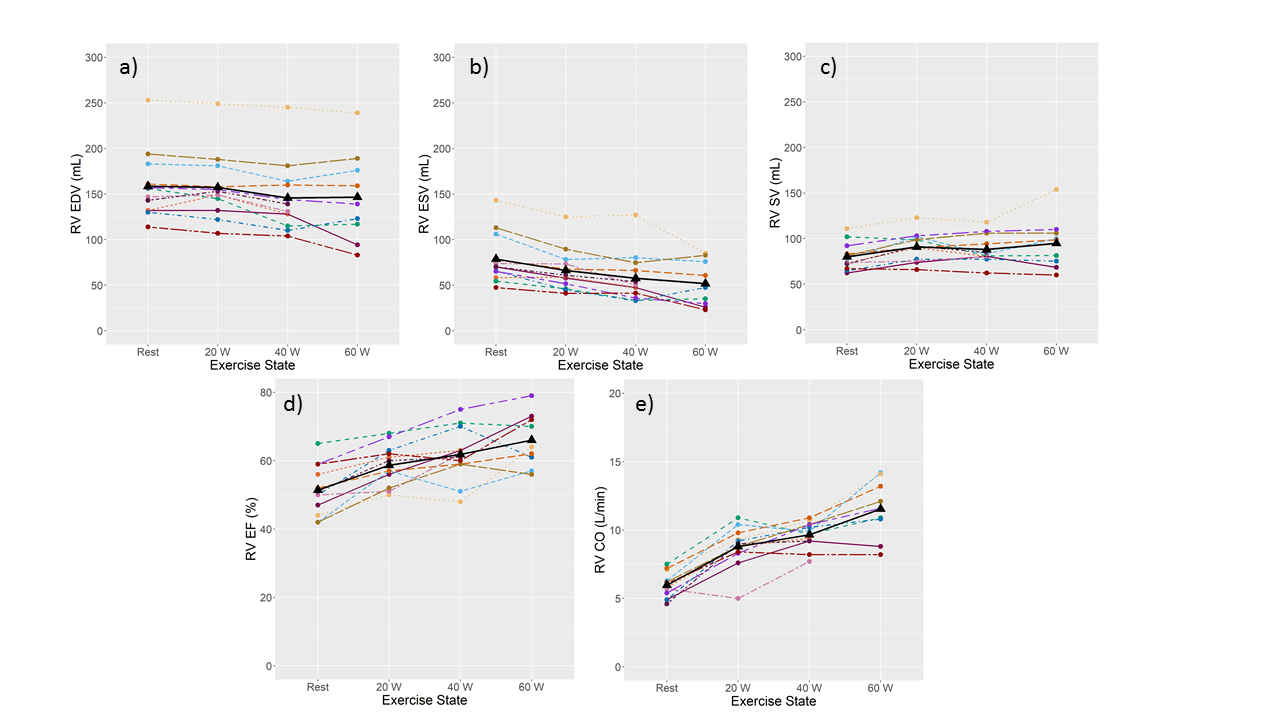
Figure 2: Right
ventricular (RV) function tracked over rest and different exercise intensities
for 12 healthy volunteers. End-diastolic volume (EDV) (a), end-systolic volume
(ESV) (b), stroke volume (SV) (c), ejection fraction (EF) (d), cardiac output
(CO) (e), and heart rate (f) are displayed for each volunteer represented by
different colors and the mean is coded in black.
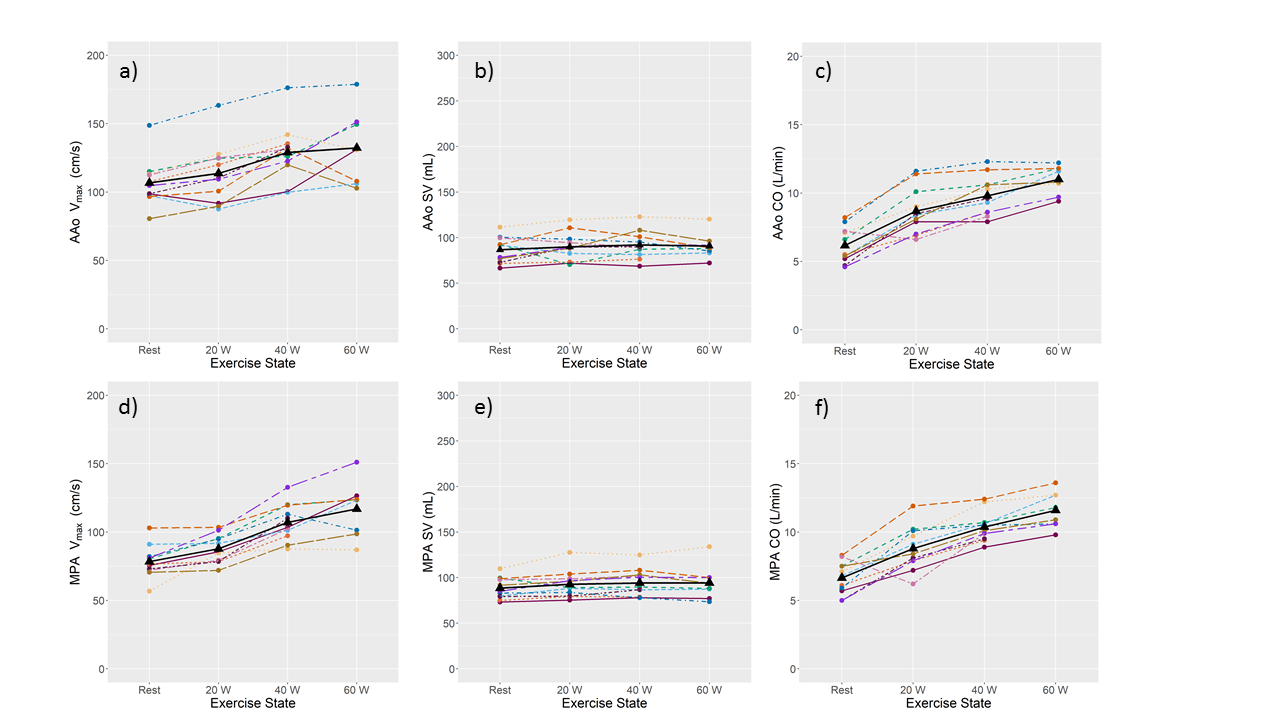
Figure 3: Hemodynamic
response to exercise in 11 healthy volunteers. For the two large vessels,
ascending aorta at the root level (AAo) and the main pulmonary artery (MPA),
peak velocity (a, d) (Vmax), stroke volume (b, e) (SV), and cardiac
output (CO) (c, f) are displayed for each volunteer represented by a different color
and the mean is coded in black.
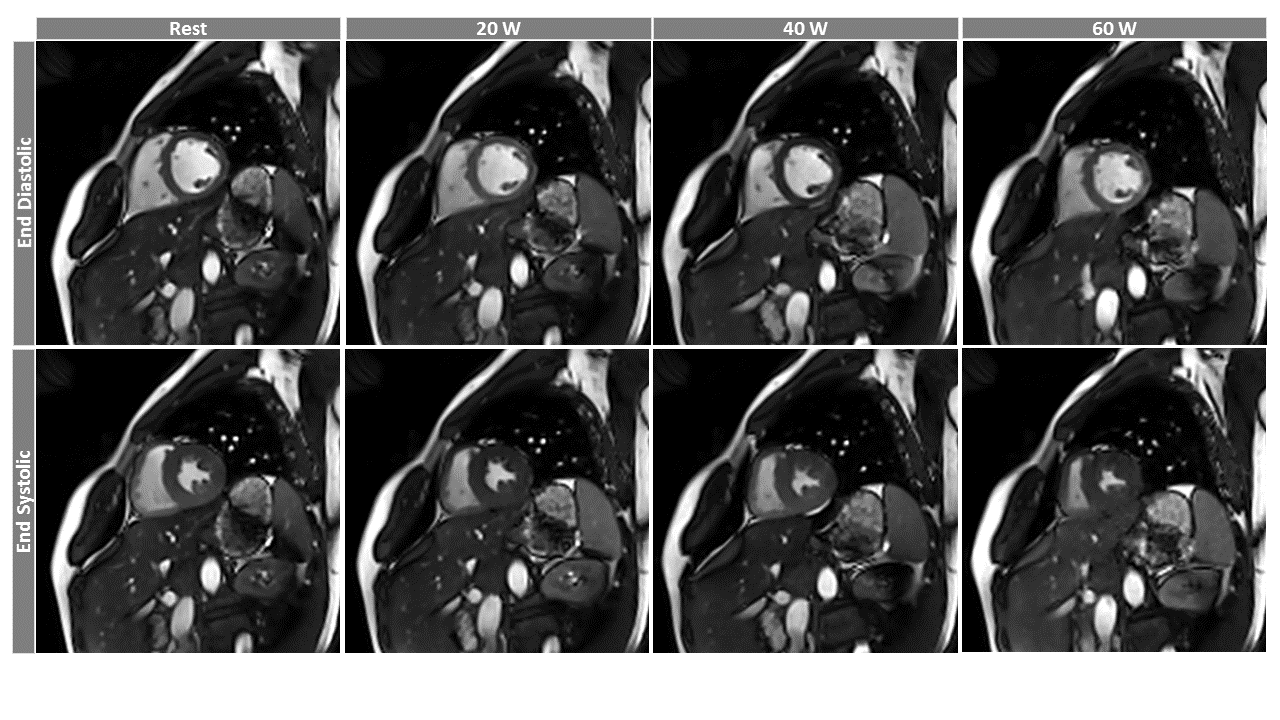
Figure 4: Representative
images of RT-Cine acquisition from one volunteer tracks a mid-ventricular slice
from diastole to systole from rest to three levels of increasing exercise
intensities.
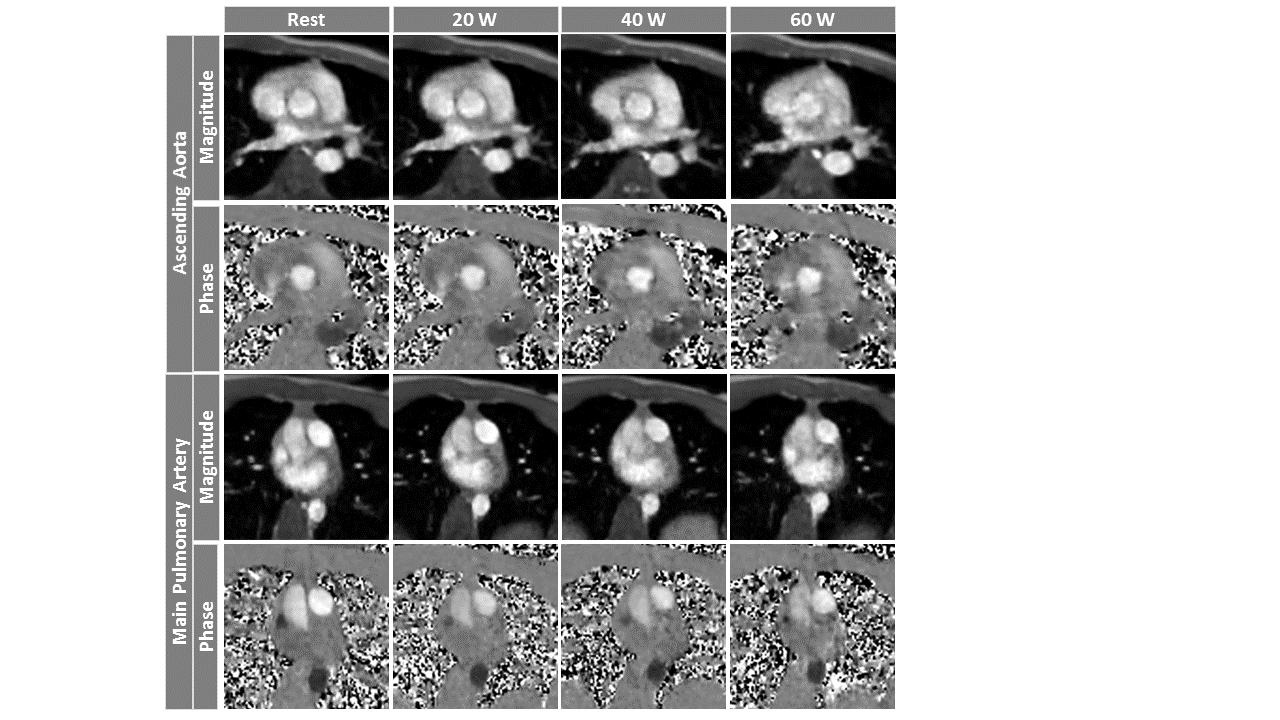
Figure 5: Representative
images of RT-Flow acquisition from one volunteer show magnitude and phase
images of AAo (top) and MPA (bottom) tracked from rest to three exercise
intensities. The velocity encoding gradient was set as follows: at rest: AAo:
150 cm/s, MPA: 100 mc/s; during exercise: AAo: 250 cm/s, MPA: 200 cm/s.
DOI: https://doi.org/10.58530/2023/1078