1076
Toward accurate cerebral blood flow estimation in mice after accounting for anesthesia1Russell H. Morgan Department of Radiology and Radiological Science, Johns Hopkins University School of Medicine, Baltimore, MD, United States, 2F. M. Kirby Research Center for Functional Brain Imaging, Kennedy Krieger Research Institute, Baltimore, MD, United States, 3Department of Biomedical Engineering, Johns Hopkins University School of Medicine, Baltimore, MD, United States
Synopsis
Keywords: Flow, Animals
CBF measurements in mice were often confounded by the utilizations of anesthesia, which are generally vasoactive. Here, we aimed to systematically understand the relationships between CBF and related physiological factors, not only the anesthesia dose but also respiratory rate (RR), heart rate (HR), and exposure time to anesthesia. We found that CBF measurements in mice were affected by anesthesia dose and time, but can be corrected by using respiratory rate and heart rate. The correction scheme will facilitate applications of CBF measurements in mechanistic understanding of vascular diseases and preclinical therapeutic trials by providing anesthesia-independent CBF measurements.INTRODUCTION
MRI measurement of cerebral blood flow (CBF) in humans provides a powerful biomarker for several brain diseases.1,2 However, when applying similar techniques in mouse models, a major confounding factor is anesthesia, which is used in virtually all MRI studies of mice. Most anesthetic agents are known to have a vasoactive effect,3,4 either dilating or constricting blood vessels. Therefore, in order to correctly interpret CBF measures in mice, the effects of anesthesia must be elucidated and, ideally, accounted for. Here we aimed to systematically understand the relationship between CBF and related physiological factors, not only the anesthesia dose but also respiration rate (RR), heart rate (HR), exposure time to anesthesia. We then applied these relationships to develop a correction scheme for anesthesia-independent CBF estimation.METHODS
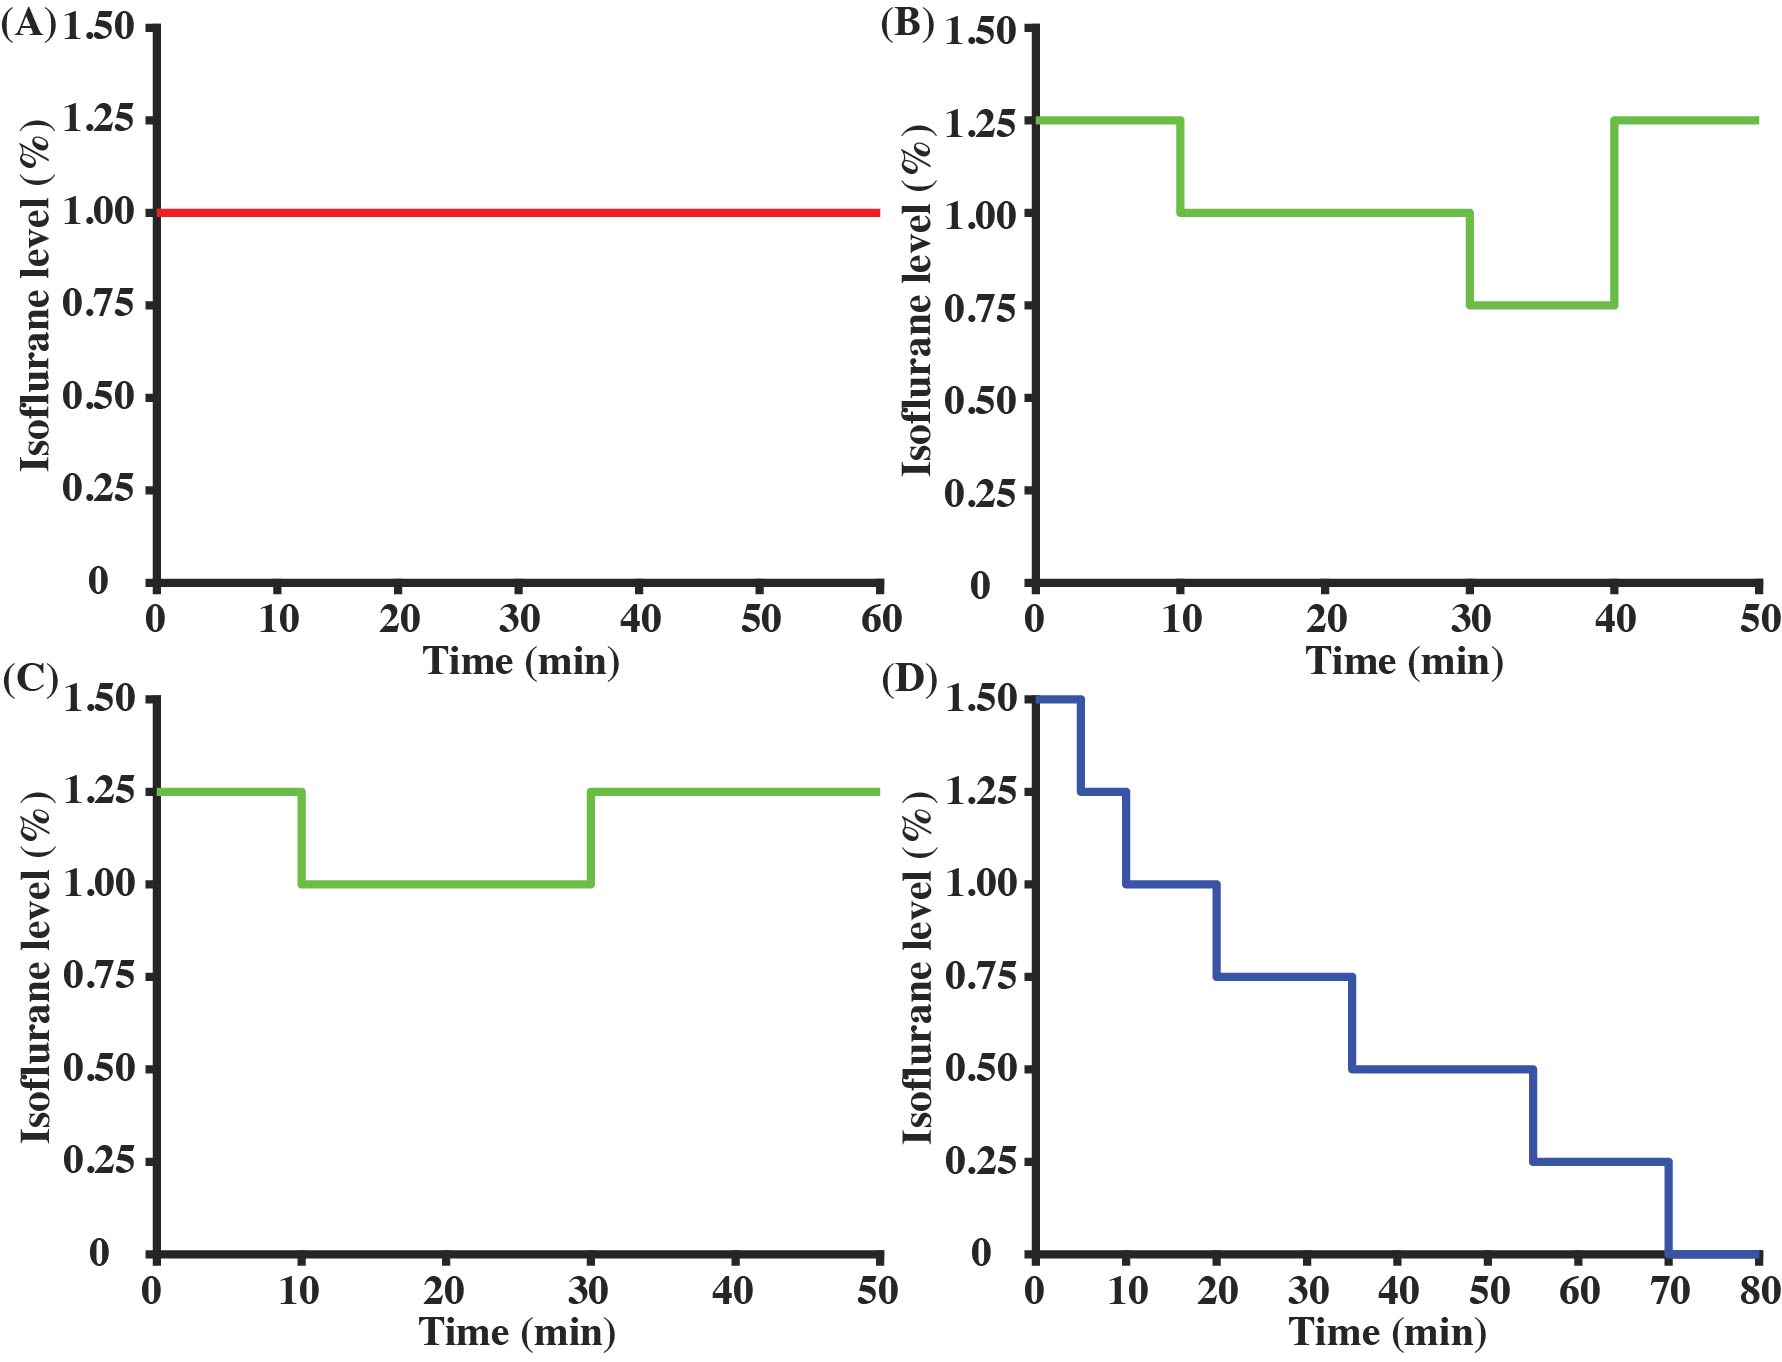
All experiments were approved by the local IACUC. An 11.7T Bruker Biospec system (maximum gradient of 0.74 T/m) with a 72-mm quadrature volume resonator (transmitter) and 2×2 phased-array coil (receiver) was utilized. A 3D-printed holder (Ultimaker) together with a bite bar and ear pins were used, so that the mice would have minimal motions even at very low anesthesia states.Our previous study suggested that the effects of anesthesia on CBF not only depend on the dose but also on how long the anesthesia has been applied to the animal.5 Therefore, here we studied the time course of CBF under a variety of dose combinations: (a) Regimen I (Fig. 1A, N=5 mice) with a constant 1.00% isoflurane (the regimen most commonly used in prior studies6,7); (b) Regimen II (Fig. 1B, N=3) with time-varying isoflurane doses ranging from 0.75 to 1.25%; (c) Regimen III (Fig. 1C, N=2) with time-varying isoflurane doses ranging from 1.00 to 1.25%; (d) Regimen IV (Fig. 1D, N=6) with progressively reducing isoflurane from 1.50% to 0%. Experiments with Regimen IV will result in the mouse waking up toward the end. We therefore stopped the CBF scanning when mice exhibited severe motions. In total, 16 mice (7 females and 9 males; 29±2 weeks; 28.8±1.4 grams) were utilized in the entire study.
CBF was measured with phase-contrast (PC) MRI in a major feeding artery of the brain, usually the left internal carotid artery. This is to ensure the maximum temporal resolution in our dynamic study (0.6 min per PC scan). Assuming that the anesthesia effects on CBF are equivalent in all major arteries of the brain, the single-artery value was converted to whole-brain CBF (combining left/right internal carotid and left/right vertebral arteries) in reporting. HR was recorded with an ultrashort TE (UTE) MRI sequence (0.4 min per UTE scan)6 rather than the MouseOX monitoring system to avoid potential physiological perturbation induced by needle penetrations. PC and UTE scans were interleaved, leading to a temporal resolution of 1.0 min. RR at each time point was monitored with the non-invasive MouseOX system.
Linear mixed-effect (LME) model was used for statistical analyses (significance level at P<0.05).
RESULTS AND DISCUSSION
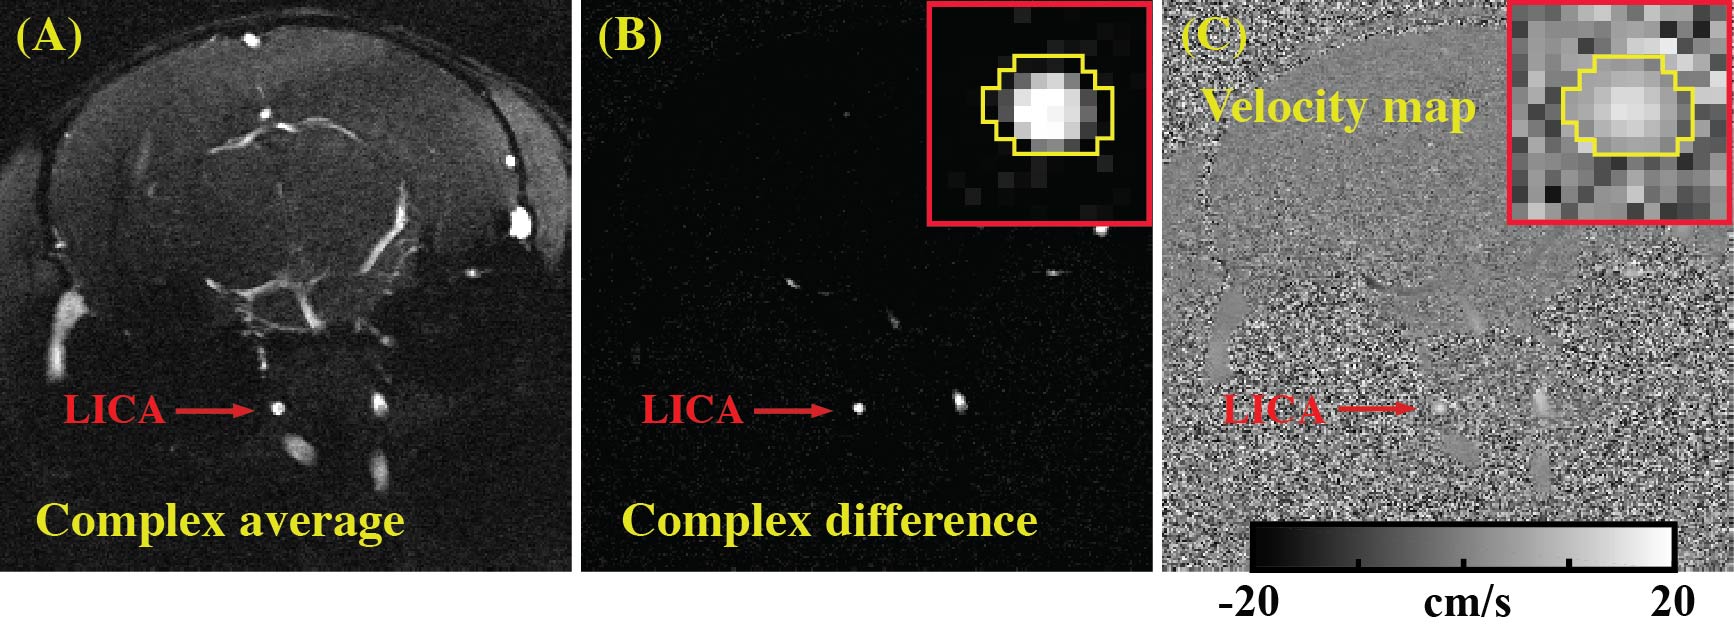
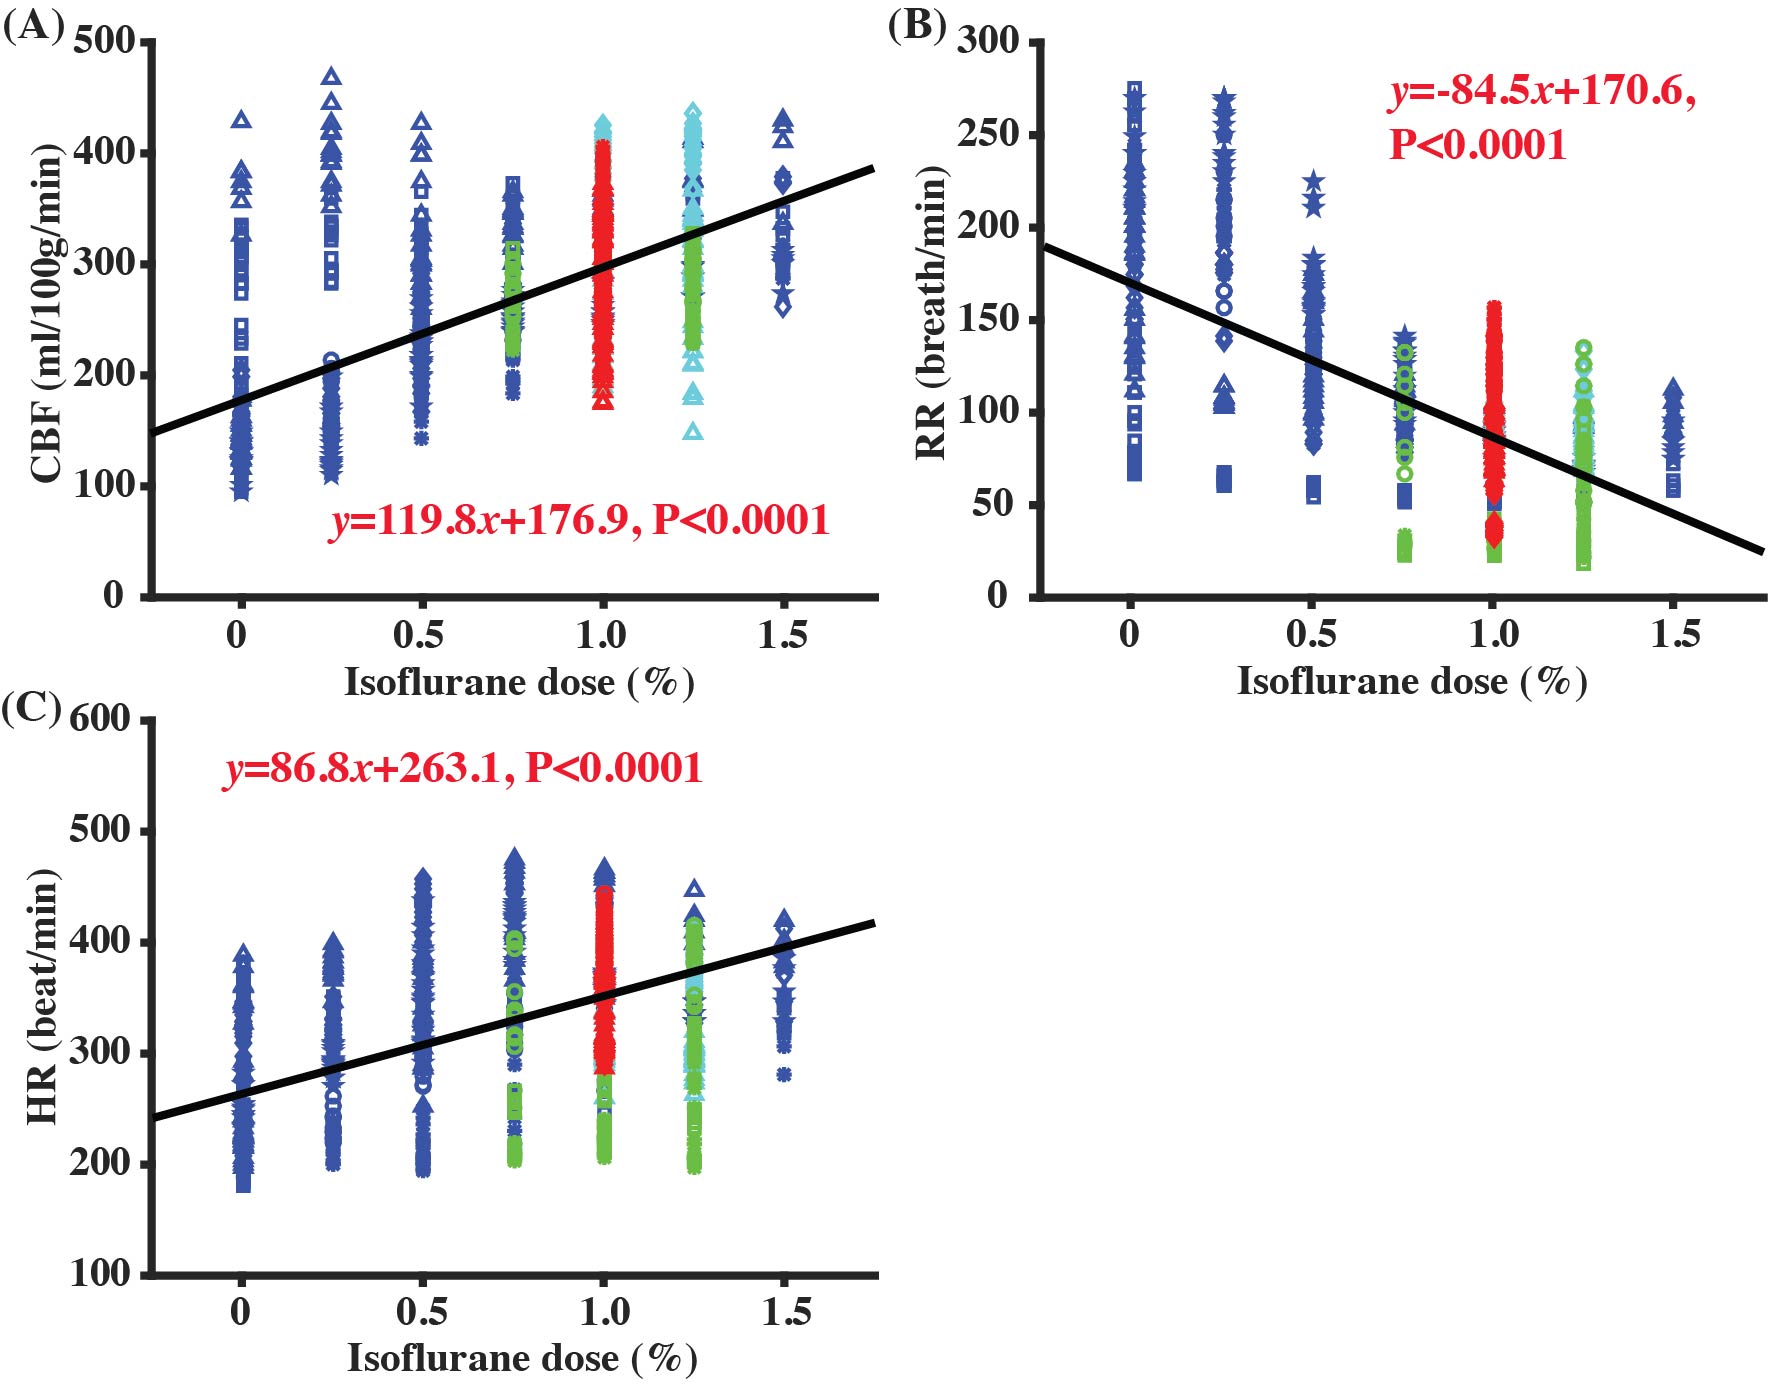
Figure 2 presents the complex average image, complex difference image, and velocity map of a PC dataset at the starting time point of Regimen IV. It can be noticed that LICA was highlighted in the complex difference image (Fig. 2B) to facilitate the delineation of region-of-interest (ROI), which was finally applied to the velocity map (Fig. 2C) for blood flow quantification.Figure 3 shows the correlations between different physiological parameters and isoflurane dose, when combining data from all four Regimens. CBF was positively correlated with isoflurane dose (Fig. 3A, P<0.0001), consistent with the expected vasodilatory effects of isoflurane3. However, the CBF variation even at the same dose was still large and the coefficient of determination of the correlation (R2=0.29) was modest. Additionally, there was a significant negative correlation between RR and dose (Fig. 3B, P<0.0001) and a significant positive correlation between HR and dose (Fig. 3C, P<0.0001).
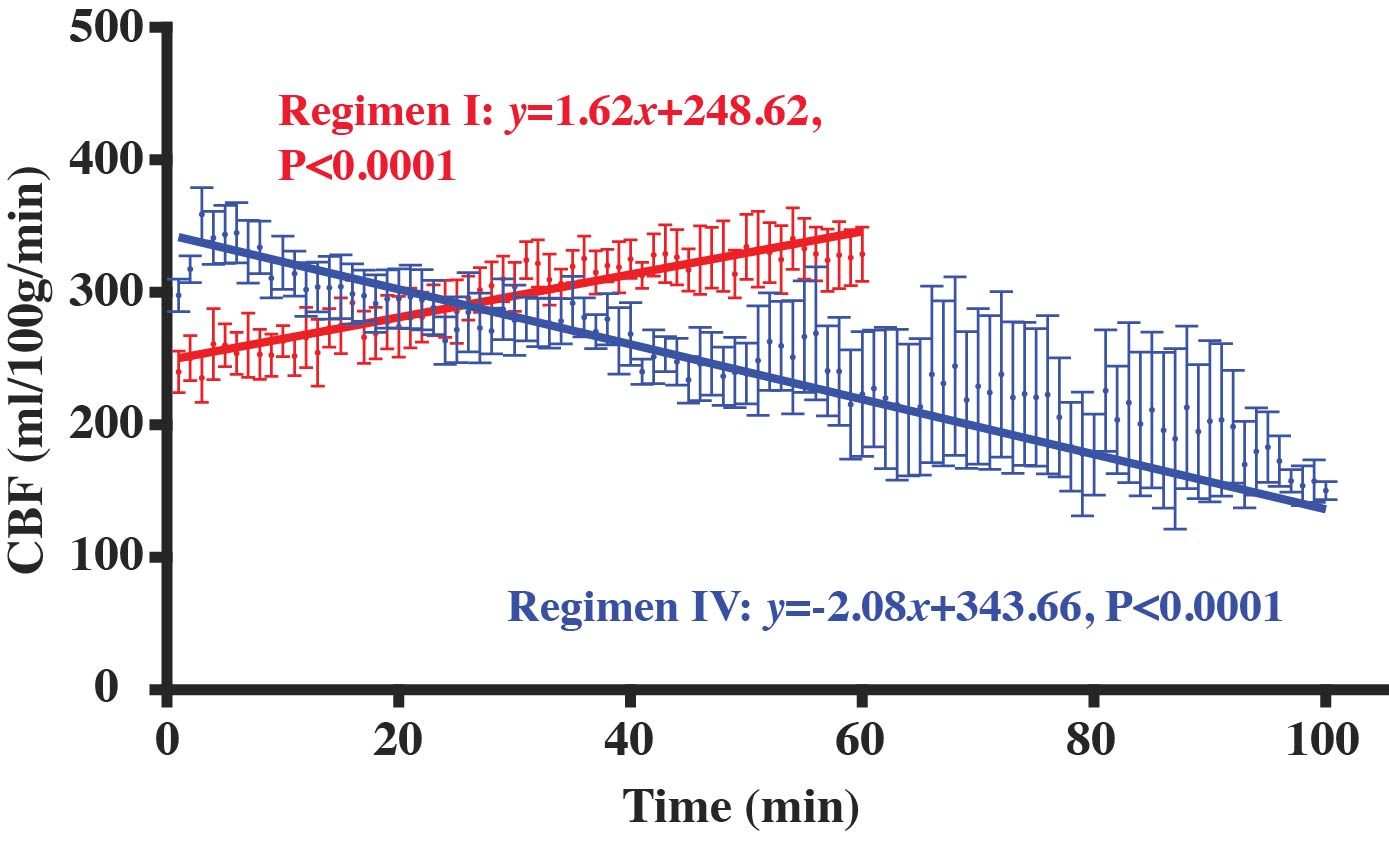
Figure 4 shows the temporal dynamics of CBF in Regimen I and Regimen IV. In Regimen I where the anesthesia dose was constant as in typical mouse experiments, there was a significant CBF increase (red curve) with time (P<0.0001), suggesting that time has an interaction effect with anesthesia dose in modulating CBF. In Regimen IV where the dose was gradually decreased, CBF decreased (blue curve) with time (P<0.0001).
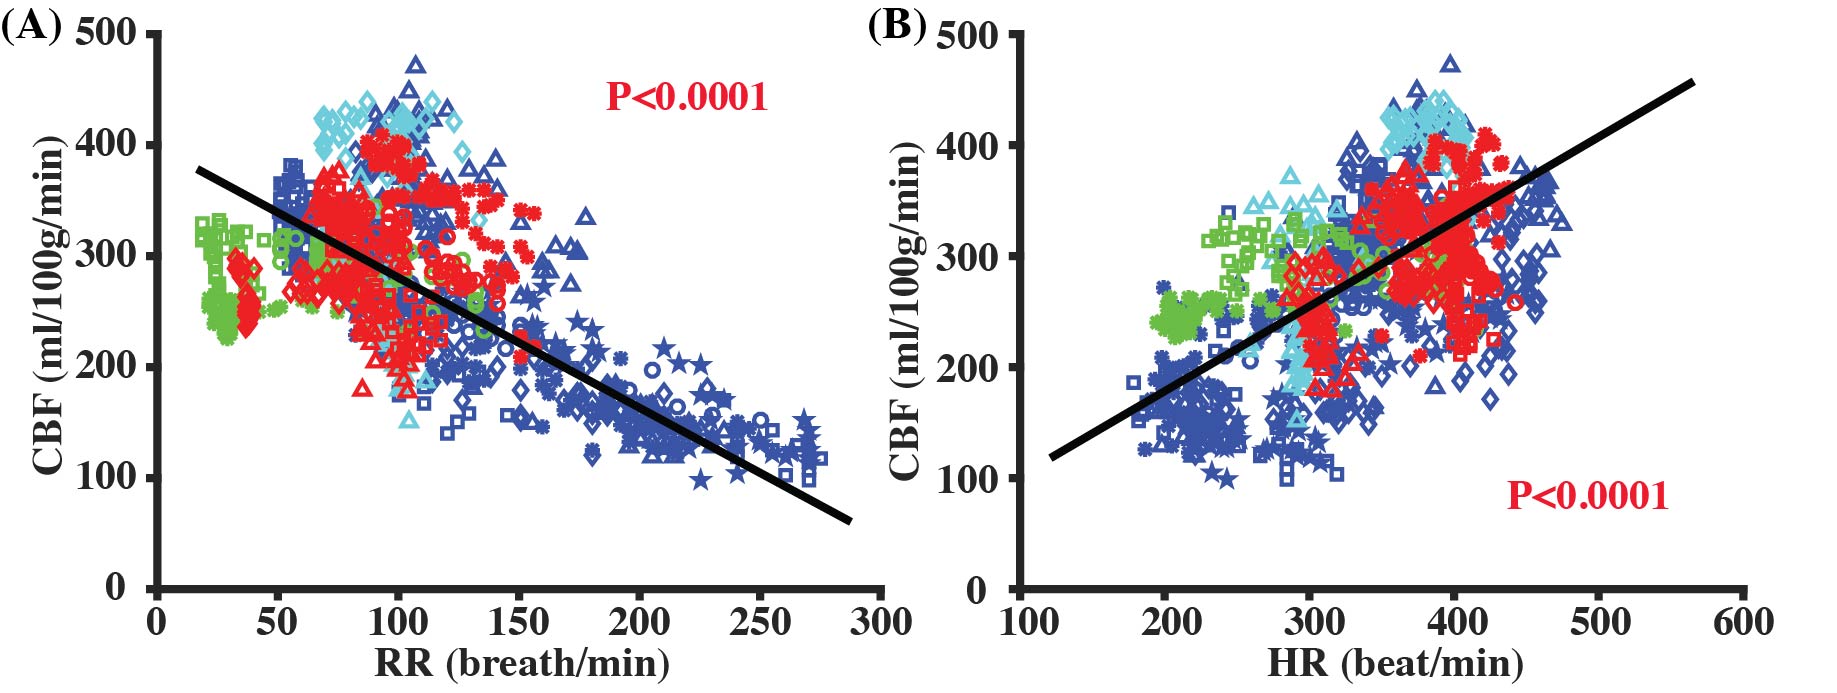
Figure 5 summarizes the relationships between CBF and RR or HR. There was a significant negative correlation between CBF and RR (Fig. 5A, P<0.0001), and a positive correlation between CBF and HR (Fig. 5B, P<0.0001). By including both RR and HR into the same LME model, it can be established that which can provide a calibration method to estimate anesthesia-independent CBF for anesthetized mice. Note that the above equation can account for R2=0.53 of the variances in our entire data. With this method, CBF at the awake state in mice was estimated to be 122.4 ml/100g/min, which, we believe, reflects the normative CBF values in mice but is substantially lower than some of the previous reports6,8 measured under anesthesia.
CONCLUSION
MRI CBF measurements in mice are affected by anesthesia dose and time, but can be corrected by using respiratory rate and heart rate.Acknowledgements
No acknowledgement found.References
1. Lu H, Xu F, Rodrigue KM et al. Alterations in cerebral metabolic rate and blood supply across the adult lifespan. Cereb Cortex 2011; 21(6): 1426-1634.
2. Kisler K, Nelson AR, Montagne A et al. Cerebral blood flow regulation and neurovascular dysfunction in Alzheimer disease. Nat Rev Neurosci 2017; 18(7): 419-434.
3. Li CX, Patel S, Auerbach EJ et al. Dose-dependent effect of isoflurane on regional cerebral blood flow in anesthetized macaque monkeys. Neurosci Lett 2013; 541: 58-62.
4. Fukuda M, Vazquez AL, Zong X et al. Effects of the alpha(2)-adrenergic receptor agonist dexmedetomidine on neural, vascular and BOLD fMRI responses in the somatosensory cortex. Eur J Neurosci 2013; 37(1): 80-95.
5. Wei Z, Li Y, Hou X et al. Quantitative cerebrovascular reactivity MRI in mice using acetazolamide challenge. Magn Reson Med 2022; 88: 2233–2241.
6. Wei Z, Chen L, Hou X et al. Age-related alterations in brain perfusion, venous oxygenation, and oxygen metabolic rate of mice: A 17-month longitudinal MRI study. Front Neurol 2020; 11: 559.
7. Schroeter A, Schlegel F, Seuwen A et al. Specificity of stimulus-evoked fMRI responses in the mouse: the influence of systemic physiological changes associated with innocuous stimulation under four different anesthetics. Neuroimage 2014; 94: 372-384.
8. Evans PG, Sokolska M, Alves A et al. Non-Invasive MRI of Blood–Cerebrospinal Fluid Barrier Function. Nat Commun 2020; 11(1): 2081.
Figures