1053
Histological validation of myelin-sensitive MRI metrics in the common marmoset1McConnell Brain Imaging Centre, Montreal Neurological Institute and Hospital, McGill University, Montreal, QC, Canada, 2Department of Neurology and Neurosurgery, McGill University, Montreal, QC, Canada, 3Comparative Medicine and Animal Resources Center, McGill University, Montreal, QC, Canada, 4Hotchkiss Brain Institute and Departments of Radiology and Clinical Neuroscience, University of Calgary, Calgary, AB, Canada, 5Department of Biomedical Engineering, McGill University, Montreal, QC, Canada
Synopsis
Keywords: Validation, Brain, Marmoset
Several studies have compared myelin-sensitive MRI maps to myelin staining to demonstrate the degree of correlation of the MRI metric with myelin content. This study in the common marmoset compares six myelin-sensitive MRI metrics acquired in vivo to stains for myelin, cell nuclei, and ferritin. T2*-based myelin water fraction (MWF) and inhomogeneous magnetization transfer saturation (ihMTsat) presented the greatest specificity for myelin content, with ihMTsat having a higher signal in grey matter regions. T1w/T2w had the strongest correlation with the iron-storage protein ferritin, and T2* presented the greatest correlation with the cell nuclei stain.
Introduction
Myelin is a critical component of the nervous system and is a primary feature of interest in many neuroimaging studies. Several MRI metrics are used to assess myelin content in the brain, and a number of studies have histologically correlated these metrics to myelin content1–8. This correlation was supported in a recent meta-analysis9, however, each contrast may also be sensitive to other components of brain tissue (e.g. iron).The common marmoset (Callithrix jacchus) is being rapidly adopted by the neuroscience community to better understand the human brain, stimulating the generation of marmoset neuroimaging atlases10–14. The marmoset brain provides an ideal model for human brain imaging, as it possesses similar cortical myeloarchitecture to humans, a thick cortex with minimal cortical folding, and more white matter than rodents. This study takes advantage of the morphology of the marmoset brain to investigate the relationship between six myelin-sensitive MRI metrics and three histological stains to assess myelin specificity.
Methods
This study was approved by our institutional ethics committee. MRI images were collected in an anesthetized adult marmoset using a 3T-PrismaFit scanner (Siemens, Germany) with a 16-channel marmoset RF coil15 (Takashima Seisakusho Co./ Rogue Research, Inc.) over four sessions. The following myelin-sensitive metrics were acquired: R1 relaxation rate, T1w/T2w signal ratio, T2* relaxation time, T2*-based myelin water fraction (MWF), magnetization transfer saturation (MTsat), and inhomogeneous MTsat (ihMTsat). Imaging parameters are detailed in Figure 1.A T1-weighted anatomical scan from each session was used to generate a template with ANTs16. The parameter maps were calculated in the native imaging space and subsequently transformed to template space.
The marmoset brain was perfusion fixed, extracted, and placed in 4% PFA. A microtome was used to cut the brain into 20 μm-thick sections. Block-face images (48 μm resolution) were acquired during the sectioning process to facilitate realignment. All immunohistochemical stains and washes were performed via immersion of all samples together to promote homogeneous staining. Slides were blocked and permeabilized, and then stained with a rabbit anti-Ferritin primary antibody for 48h at 4 degrees. The same slides were then stained with an Alexa488 anti-rabbit secondary antibody, FluoroMyelin Red, and Hoechst overnight at 4 degrees. FluoroMyelin is a lipid stain that can be used to visualize myelination patterns due to its high lipid density. Imaging was performed on an ImageXpress High-Content Imaging System (Molecular Devices, USA) with a 10x objective to acquire image tiles for each section (0.67 μm resolution).
High-resolution tiles were corrected for intensity variations17 and stitched together18 in ImageJ19,20. Block-face images were reconstructed into a 3D volume using Possum21, with the T1w template as a reference. Five immunostained sections were registered to the block-face volume using ANTs. All images were sampled to the resolution of the block-face images.
30 ROIs were manually drawn using ITK-snap22, to avoid susceptibility artifacts present in the T2*-based maps. Correlations were calculated between each MRI contrast and the average fluorescence intensity value in the ROIs from the three histological stains to visualize the sensitivity and specificity of the contrasts to cell density, iron storage, and myelin content.
Results & Discussion
Figure 2 presents the ROIs and the five histological sections used for the analysis.A coronal slice of each of the registered MRI metrics is presented in Figure 3.
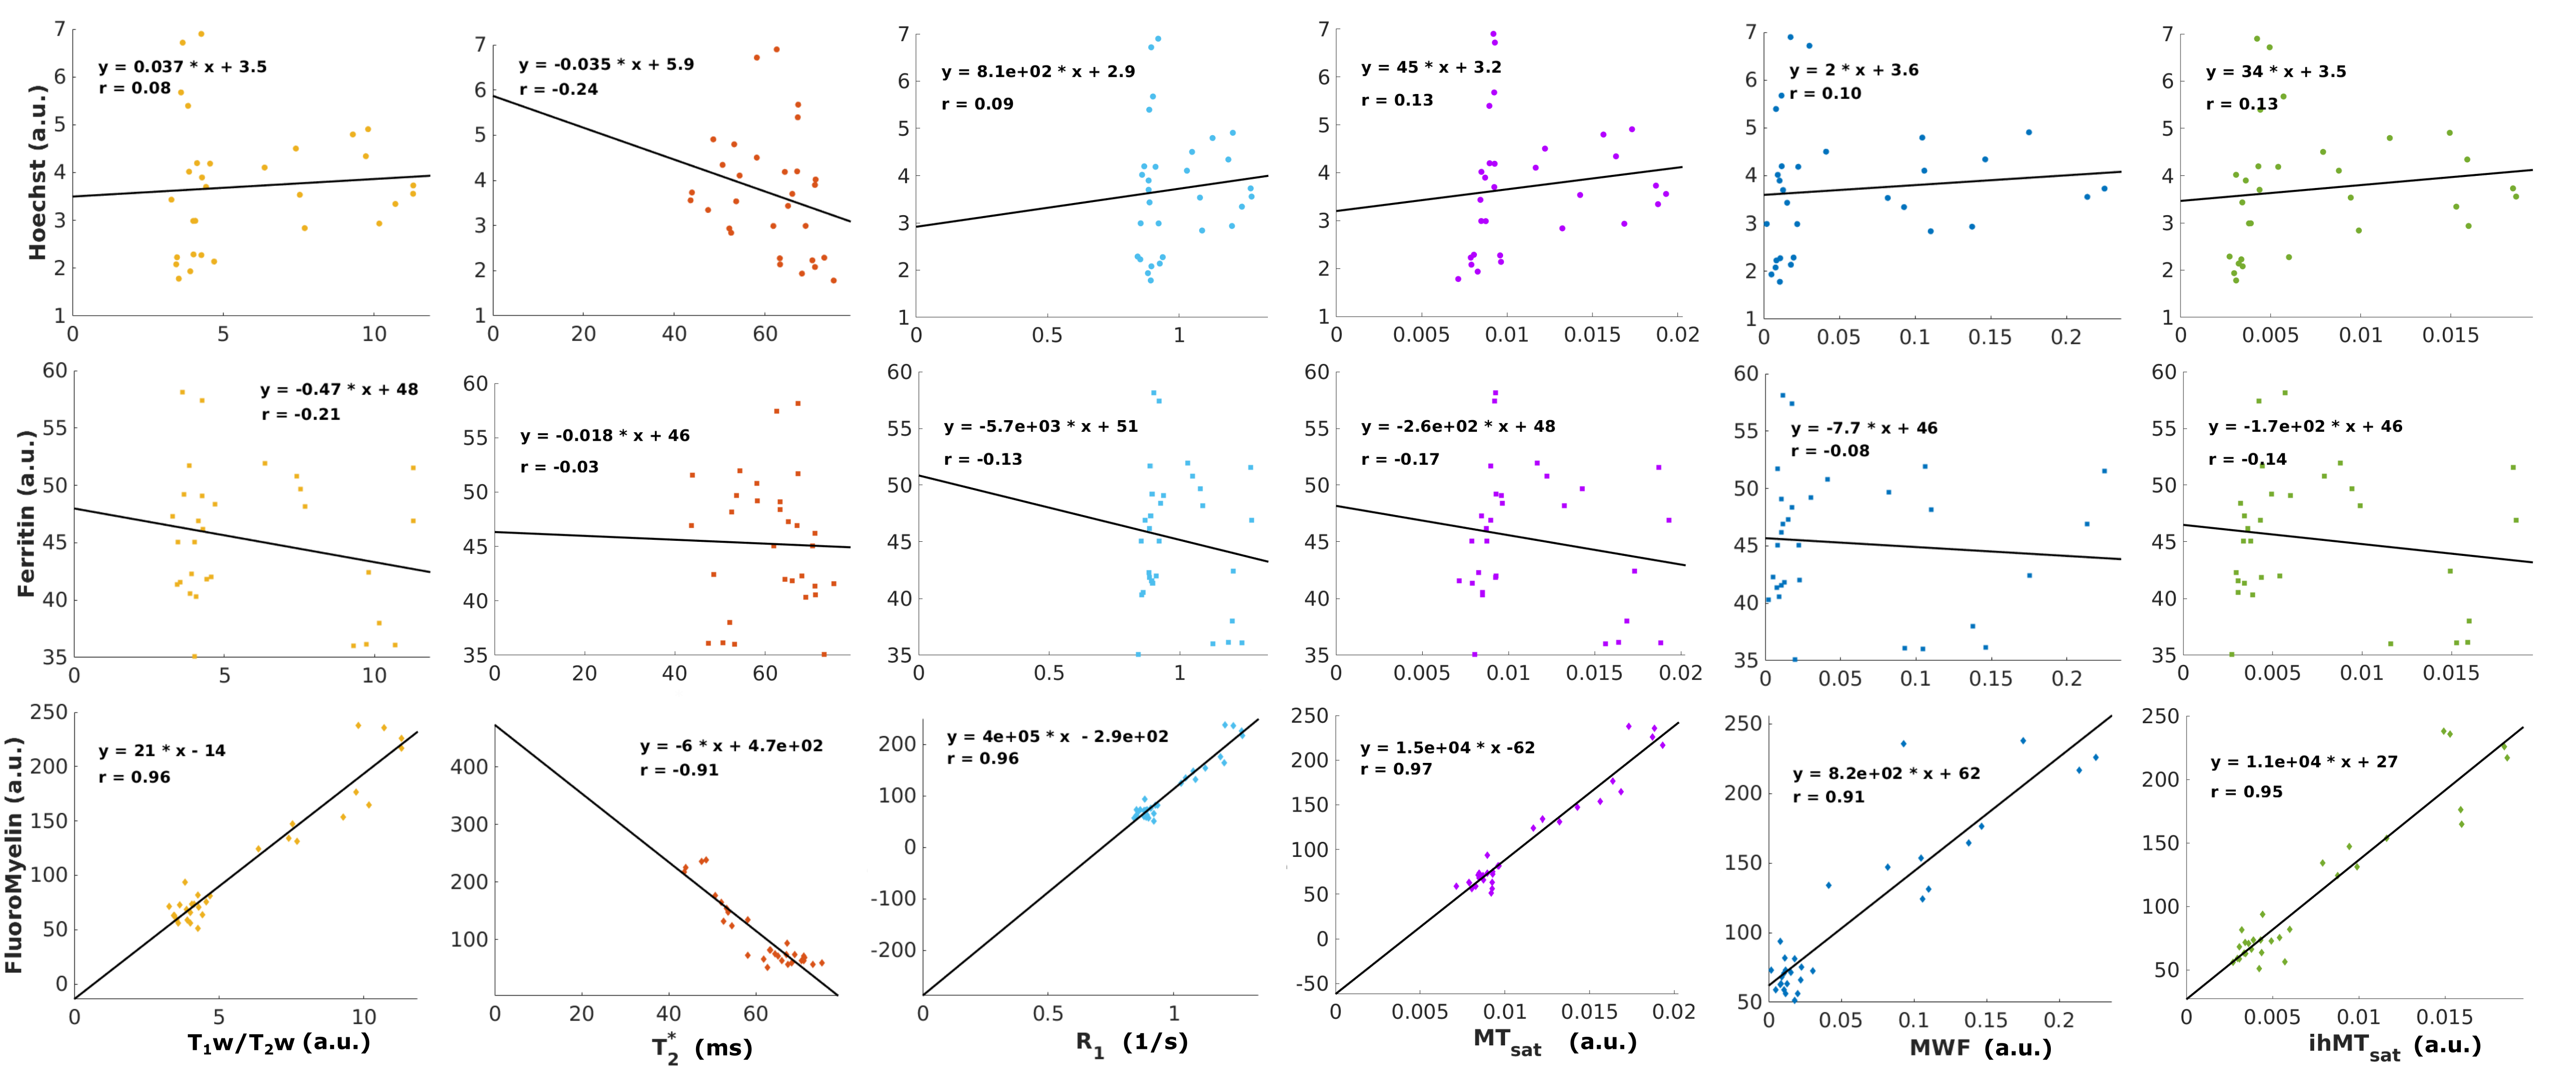
Correlations between the MRI metrics and histological stains are presented in Figure 4. The Hoechst stain was used as a proxy for cell density, and most of the investigated MRI metrics presented a weak correlation with this stain (r ≤ 0.13). T2* had the largest degree of correlation (r = -0.24) with the nuclear stain. All contrasts were negatively correlated with ferritin, with T1w/T2w presenting the strongest correlation (r = -0.21). Interestingly, T2* had the lowest correlation with ferritin staining (r = -0.03). It should be noted that ferritin is an iron-storage protein, and its concentration is not necessarily equivalent with the iron loading of a cell.
All metrics presented a high degree of correlation with FluoroMyelin (r > 0.9), as expected based on a recent meta-analysis9. MWF and ihMTsat presented strong correlations with FluoroMyelin with low y-intercept values, indicative of specificity, alongside low correlations with the ferritin and Hoechst. T1w/T2w presented the lowest y-intercept with FluoroMyelin staining, which could suggest specificity for myelin content. However, the moderate correlation coefficient of T1w/T2w with ferritin staining highlights the sensitivity of this contrast to other aspects of tissue composition.
Limitations
This study was performed on a single, healthy marmoset. While the correlations were generated over different brain tissue types, it is plausible that these relationships could be disrupted in pathological conditions. Furthermore, the impact of fiber orientation on the MR maps was not investigated.Conclusions
Using in-vivo MRI and histological methods in the common marmoset, this study echoes previous findings highlighting that many MRI contrasts are highly correlated with myelin. This work demonstrates the degree to which some MRI metrics are also sensitive to other histological metrics such as cell density and iron-storage, which may be important factors for investigating specific neuropathologies. Future directions of this work will combine these results with additional stains of myelin basic protein, microtubules and neurofilaments, as well as with diffusion MR data23.Acknowledgements
We thank Takuya Hayashi (RIKEN, Brain Connectomics Imaging Laboratory) for sharing his marmoset connectome MRI protocols15, as well as Rogue Research (Stephen Frey) and Hybex (Brian Hynes) for the development of the marmoset MRI chair. This project was supported by Brain Canada Foundation's support of the McConnell Brain Imaging Center. Additional financial support was provided by the Natural Sciences and Engineering Research Council of Canada, the Fonds de recherche du Québec – Santé, Healthy Brains for Healthy Lives, the Campus Alberta Innovates Program, and the Molson Foundation.References
1. Stüber C, Morawski M, Schäfer A, et al. Myelin and iron concentration in the human brain: A quantitative study of MRI contrast. Neuroimage. 2014;93(P1):95-106. doi:10.1016/j.neuroimage.2014.02.026
2. Eickhoff S, Walters NB, Schleicher A, et al. High-resolution MRI reflects myeloarchitecture and cytoarchitecture of human cerebral cortex. Hum Brain Mapp. 2005;24(3):206-215. doi:10.1002/hbm.20082
3. Edwards LJ, Kirilina E, Mohammadi S, Weiskopf N. Microstructural imaging of human neocortex in vivo. Neuroimage. 2018;182:184-206. doi:10.1016/j.neuroimage.2018.02.055
4. Alkemade A, Pine K, Kirilina E, et al. 7 Tesla MRI Followed by Histological 3D Reconstructions in Whole-Brain Specimens. Front Neuroanat. 2020;14(October):1-11. doi:10.3389/fnana.2020.536838
5. Birkl C, Birkl-Toeglhofer AM, Endmayr V, et al. The influence of brain iron on myelin water imaging. Neuroimage. 2019;199(May):545-552. doi:10.1016/j.neuroimage.2019.05.042
6. Bagnato F, Hametner S, Franco G, et al. Selective Inversion Recovery Quantitative Magnetization Transfer Brain MRI at 7T: Clinical and Postmortem Validation in Multiple Sclerosis. J Neuroimaging. 2018;28(4):380-388. doi:10.1111/jon.12511
7. Khodanovich MY, Sorokina I V., Glazacheva VY, et al. Histological validation of fast macromolecular proton fraction mapping as a quantitative myelin imaging method in the cuprizone demyelination model. Sci Rep. 2017;7(October 2016):1-12. doi:10.1038/srep46686
8. Hametner S, Endmayr V, Deistung A, et al. The influence of brain iron and myelin on magnetic susceptibility and effective transverse relaxation - A biochemical and histological validation study. Neuroimage. 2018;179(February):117-133. doi:10.1016/j.neuroimage.2018.06.007
9. Mancini M, Karakuzu A, Cohen-Adad J, Cercignani M, Nichols TE, Stikov N. An interactive meta-analysis of MRI biomarkers of Myelin. Elife. 2020;9:1-23. doi:10.7554/eLife.61523
10. Liu C, Ye FQ, Yen CCC, et al. A digital 3D atlas of the marmoset brain based on multi-modal MRI. Neuroimage. 2018;169(July 2017):106-116. doi:10.1016/j.neuroimage.2017.12.004
11. Liu C, Ye FQ, Newman JD, et al. A resource for the detailed 3D mapping of white matter pathways in the marmoset brain. Nat Neurosci. 2020;23(2):271-280. doi:10.1038/s41593-019-0575-0
12. Majka P, Bednarek S, Chan JM, et al. Histology-Based Average Template of the Marmoset Cortex With Probabilistic Localization of Cytoarchitectural Areas. Neuroimage. 2021;226(April 2020):117625. doi:10.1016/j.neuroimage.2020.117625
13. Majka P, Bai S, Bakola S, et al. Open access resource for cellular-resolution analyses of corticocortical connectivity in the marmoset monkey. Nat Commun. 2020;11(1). doi:10.1038/s41467-020-14858-0
14. Woodward A, Hashikawa T, Maeda M, et al. The Brain/MINDS 3D digital marmoset brain atlas. Sci Data. 2018;5:1-12. doi:10.1038/sdata.2018.9
15. Hori Y, Autio J, Ohno M, et al. Translating the Human Connectome Project to Marmoset Imaging : 16-Channel Multi-Array Coil and HCP-Style MRI Protocols and Preprocessing. In: Proceedings of the 27th Annual Meeting of ISMRM, Paris, France. ; 2018.
16. Avants BB, Epstein CL, Grossman M, Gee JC. Symmetric diffeomorphic image registration with cross-correlation: Evaluating automated labeling of elderly and neurodegenerative brain. Med Image Anal. 2008;12(1):26-41. doi:10.1016/j.media.2007.06.004
17. Peng T, Thorn K, Schroeder T, et al. A BaSiC tool for background and shading correction of optical microscopy images. Nat Commun. 2017;8:1-7. doi:10.1038/ncomms14836
18. Preibisch S, Saalfeld S, Tomancak P. Globally optimal stitching of tiled 3D microscopic image acquisitions. Bioinformatics. 2009;25(11):1463-1465. doi:10.1093/bioinformatics/btp184
19. Schindelin J, Arganda-Carreras I, Frise E, et al. Fiji: An open-source platform for biological-image analysis. Nat Methods. 2012;9(7):676-682. doi:10.1038/nmeth.2019
20. Abràmoff MD, Magalhães PJ, Ram SJ. Image processing with ImageJ. Biophotonics Int. 2004;11(7):36-42.
21. Majka P, Wójcik DK. Possum—A Framework for Three-Dimensional Reconstruction of Brain Images from Serial Sections. Neuroinformatics. 2016;14(3):265-278. doi:10.1007/s12021-015-9286-1
22. Yushkevich PA, Gao Y, Gerig G. ITK-SNAP: An interactive tool for semi-automatic segmentation of multi-modality biomedical images. In: Proceedings of the Annual International Conference of the IEEE Engineering in Medicine and Biology Society, EMBS. IEEE; 2016:3342-3345. doi:10.1109/EMBC.2016.7591443
23. Rowley CD, Leppert IR, Campbell JSW, et al. g-Ratio in the common marmoset: a comparison across different myelin-sensitive MRI metrics with b-tensor encoded diffusion. In: International Society for Magnetic Resonance in Medicine. ; 2021:0296.
24. Veraart J, Novikov DS, Christiaens D, Ades-aron B, Sijbers J, Fieremans E. Denoising of diffusion MRI using random matrix theory. Neuroimage. 2016;142:394-406. doi:10.1016/j.neuroimage.2016.08.016
25. Kellner E, Dhital B, Kiselev VG, Reisert M. Gibbs-ringing artifact removal based on local subvoxel-shifts. Magn Reson Med. 2016;76(5):1574-1581. doi:10.1002/mrm.26054
26. Song JE, Shin J, Lee H, Lee HJ, Moon WJ, Kim DH. Blind Source Separation for Myelin Water Fraction Mapping Using Multi-Echo Gradient Echo Imaging. IEEE Trans Med Imaging. 2020;39(6):2235-2245. doi:10.1109/TMI.2020.2967068
Figures
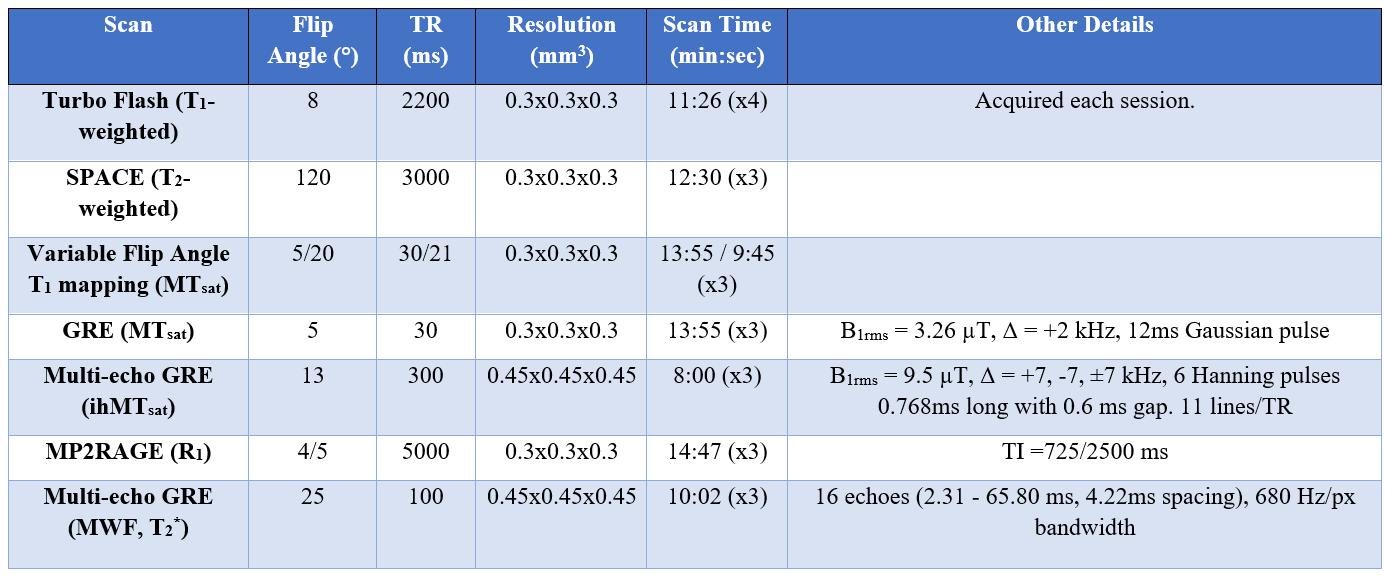
Figure 1: Imaging Parameters. Myelin-sensitive metrics were repeated three times and averaged. Myelin-sensitive metrics were denoised using MP-PCA24 and Gibb’s ringing removal25. The myelin water fraction (MWF) map was generated using rPCA approach26.
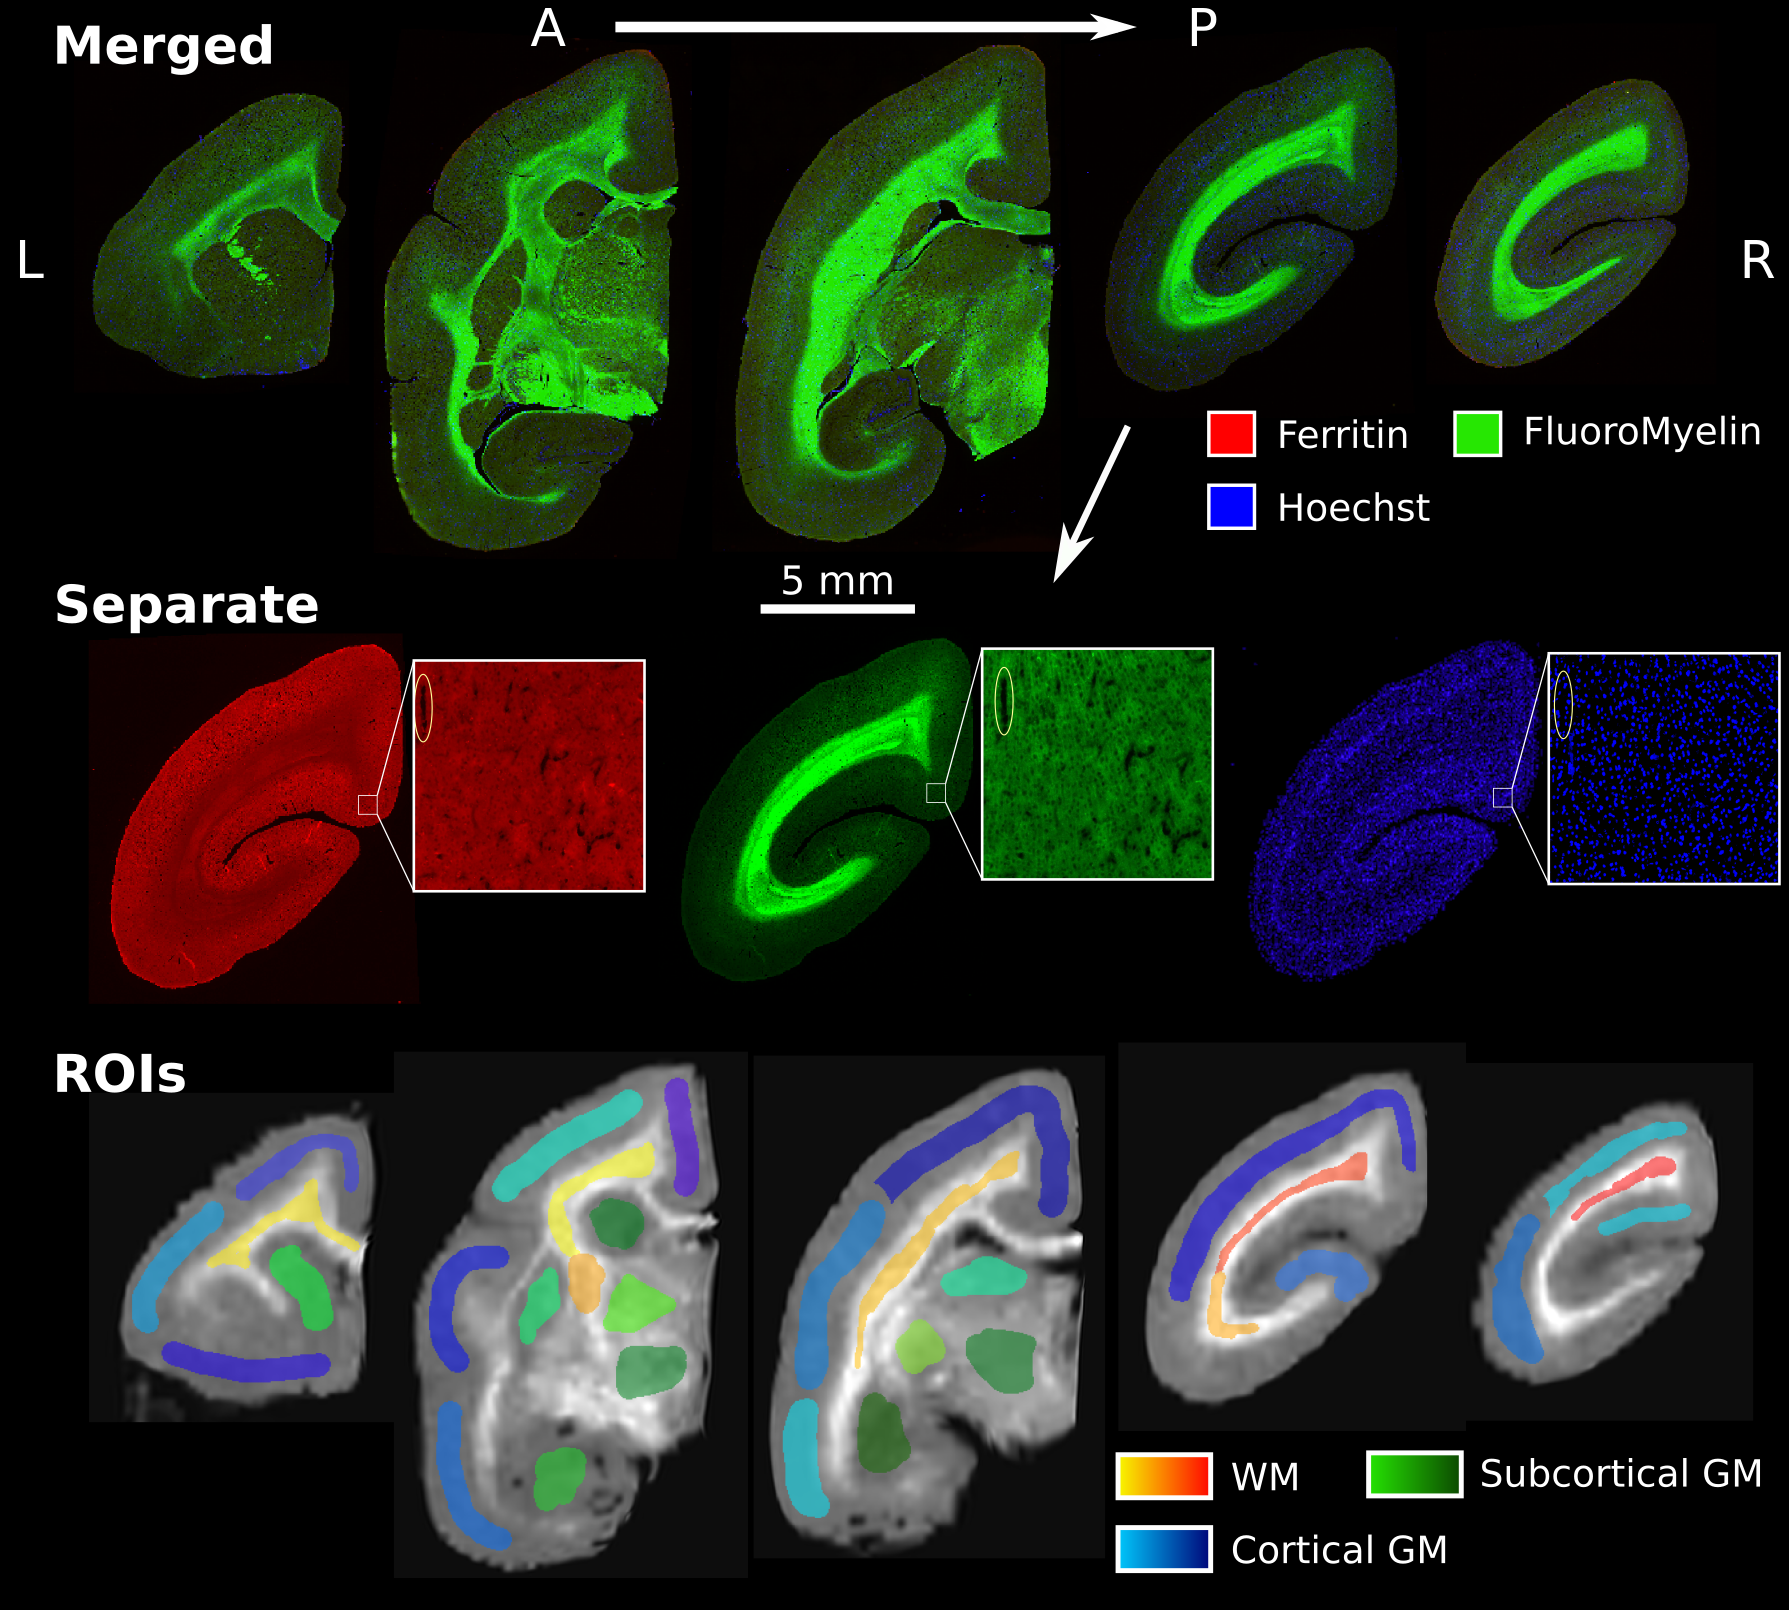
Figure 2: Five sections selected for analysis. The colour channels are separated for a single slice to illustrate the regional differences in each stain, with red, green, and blue representing ferritin, FluoroMyelin and Hoechst stains respectively. The zoomed-in tiles present the image at the acquired resolution of 0.67 μm. The bottom row presents the manually delineated ROIs, overlayed on the MTsat map. ROIs were coloured based on the tissue type they covered and did not span multiple slices.
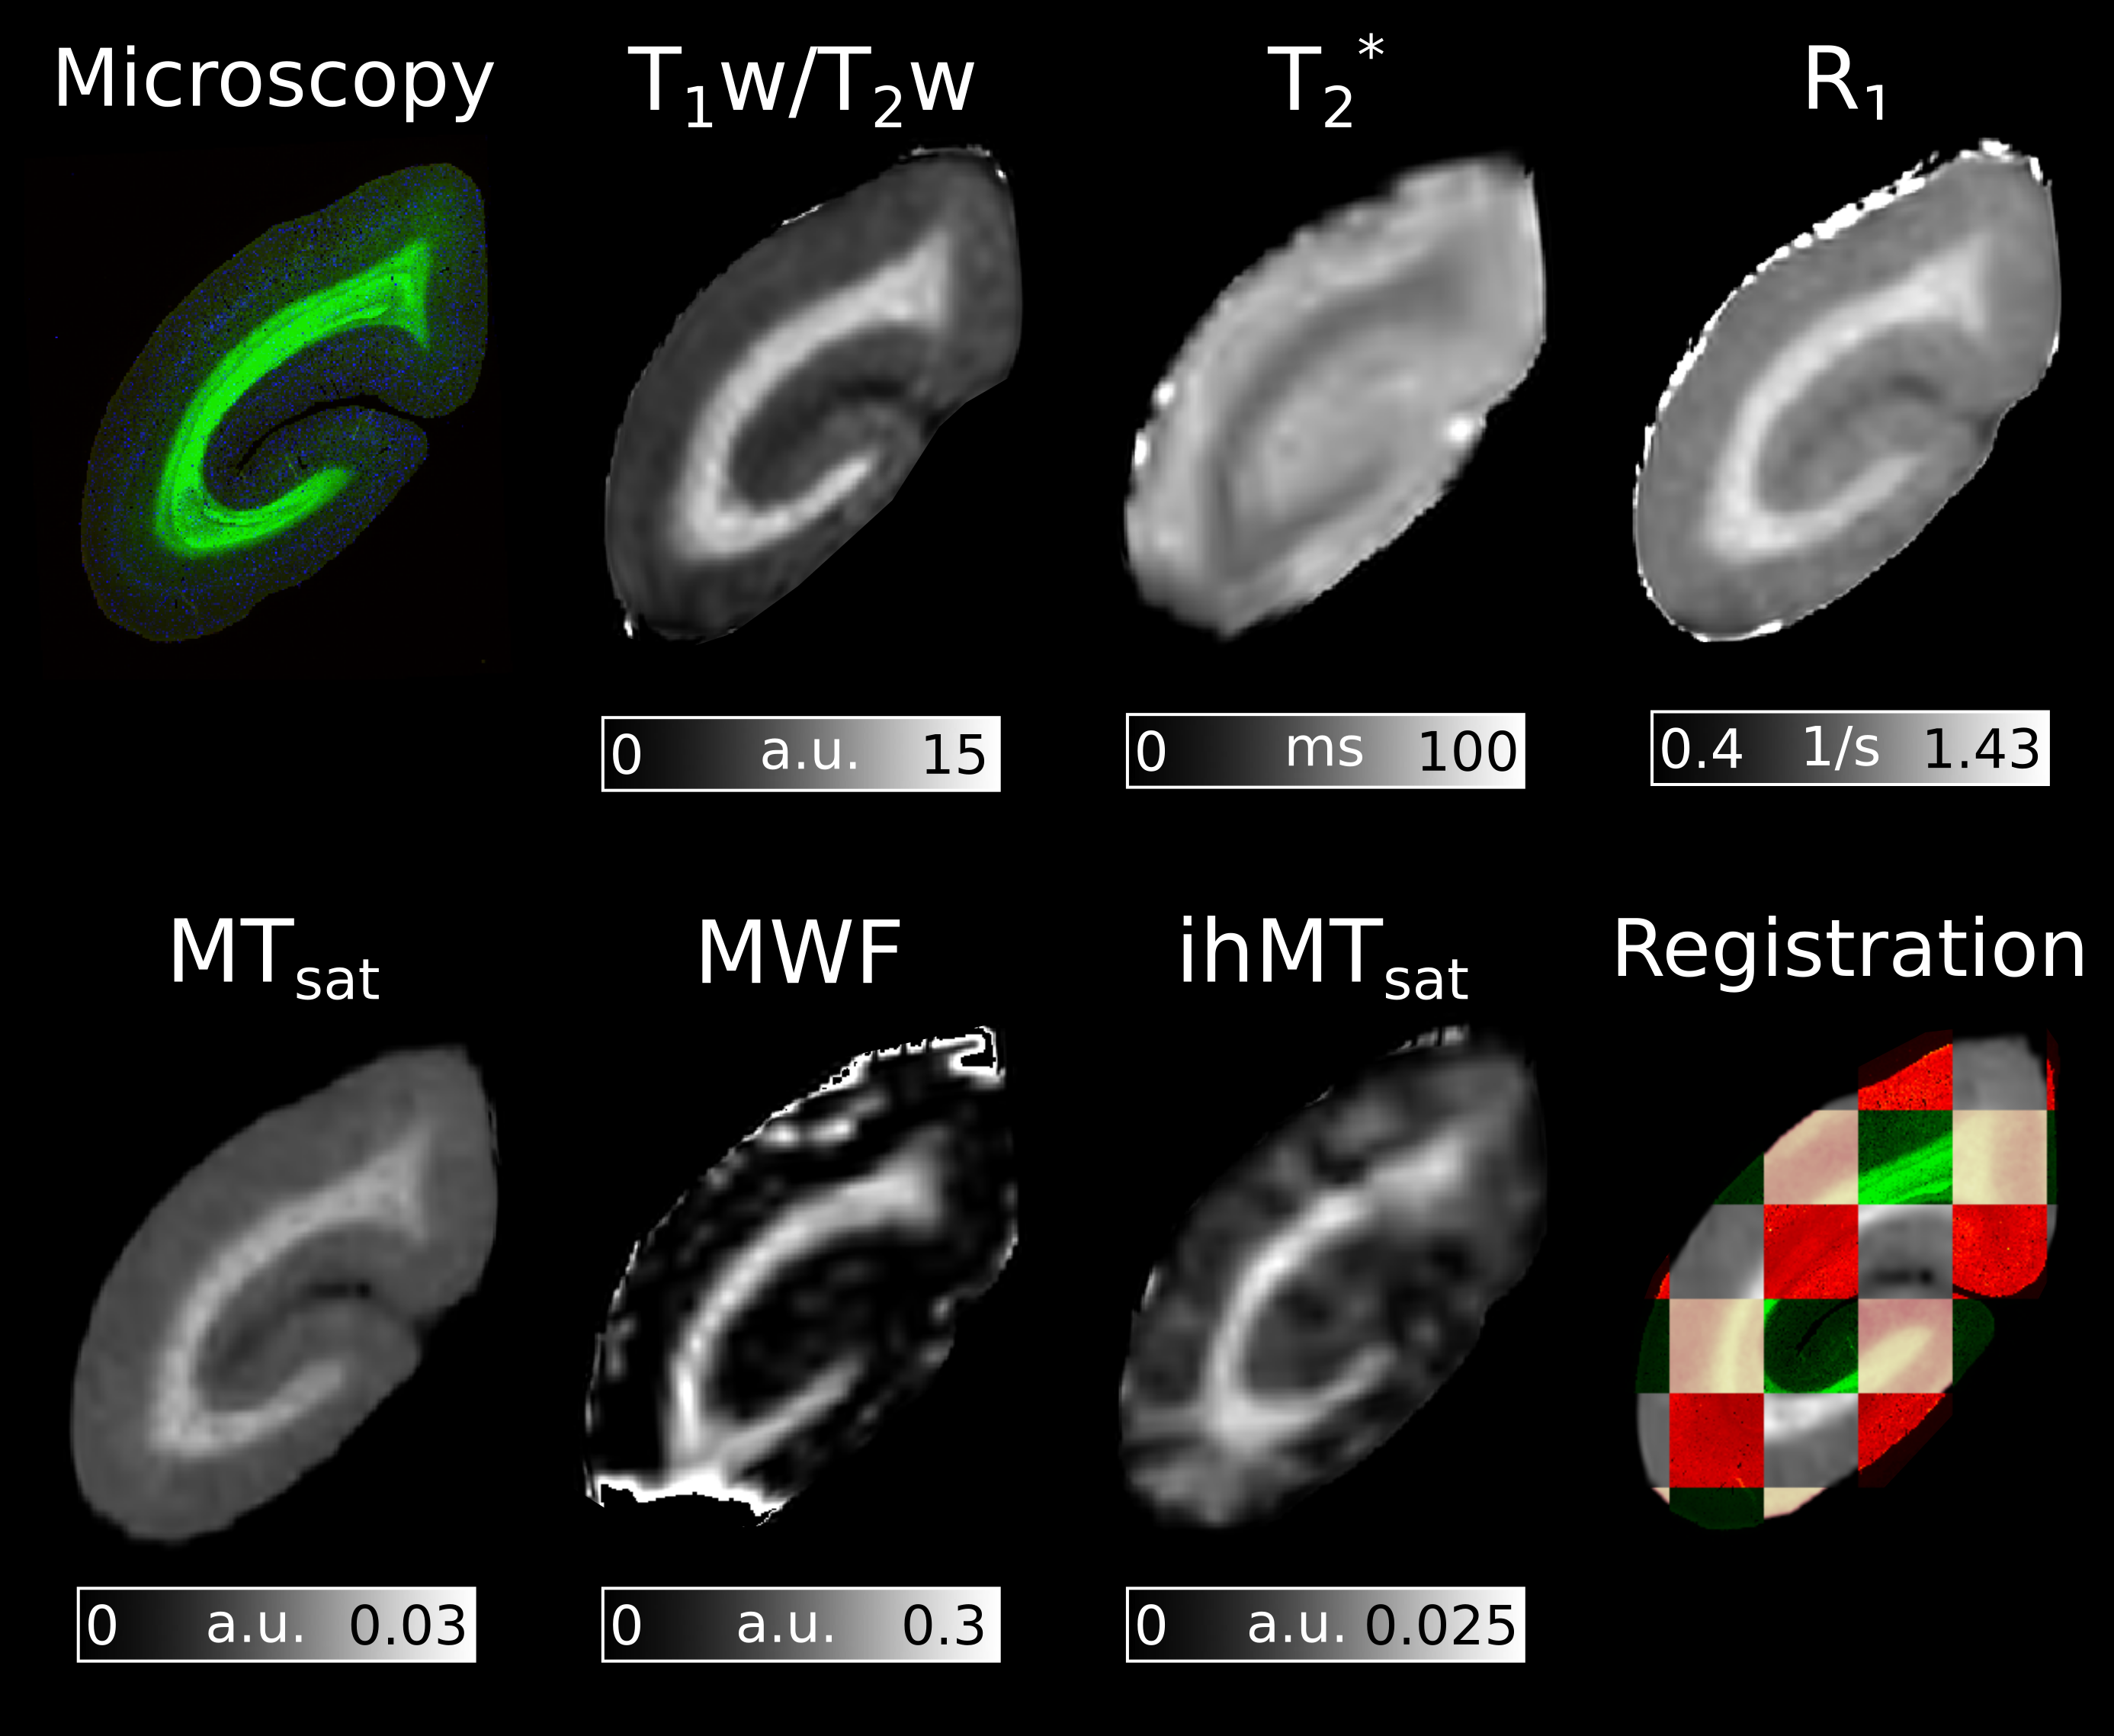
Figure 3: RGB histology section and myelin-sensitive MRI metrics aligned in a common space. Susceptibility-induced signal dropout is present in the T2* and MWF maps. This is most apparent on the inferior and superior regions of the slice. The tiled registration image contains the FluoroMyelin stain in green, ferritin stain in red, the block-face images in pink, and the MTsat MRI image in grey scale. Good alignment between MR maps and the histological stains is observed in the tiled imaged.