1052
Multi-center, multi-vendor validation of PDFF-R2* mapping in an Optimized Fat-Iron Phantom1Radiology, University of Wisconsin-Madison, Madison, WI, United States, 2Calimetrix, Madison, Wisconsin, Madison, WI, United States, 3Radiology, University of California, San Diego, San Diego, CA, United States, 4Canon Medical Systems, Tustin, CA, United States, 5Radiology, UT Southwestern, Medical Center, Dallas, TX, United States, 6Radiology, Children’s Hospital of Philadelphia, Philadelphia, PA, United States, 7Biomedical Engineering, University of Wisconsin-Madison, Madison, WI, United States, 8Medical Physics, University of Wisconsin-Madison, Madison, WI, United States, 9Medicine, University of Wisconsin-Madison, Madison, WI, United States, 10Emergency Medicine, University of Wisconsin-Madison, Madison, WI, United States
Synopsis
Keywords: Validation, Phantoms
Reliable, quantitative assessment of fat and iron is important in the management of chronic liver diseases. Confounder-corrected chemical-shift-encoded (CSE)-MRI estimates proton-density fat-fraction (PDFF) and R2* as quantitative biomarkers for fat and iron, which have been shown to be highly reproducible across centers, field strengths and manufacturers. However, reproducibility in the setting of concomitantly high levels of fat and iron is poorly understood.
To ensure the fidelity of CSE-MRI in clinical routine, a validation study was performed under controlled conditions on a phantom that modulates fat and iron simultaneously. Excellent multi-center and multi-vendor reproducibility of CSE-MRI PDFF and R2* was found.
Background
Non-alcoholic fatty liver disease is the most common chronic liver disease.1 In a population-based study, estimated prevalence of concomitant abnormal fat and iron was seen in 9% of participants.2 Reproducible quantification of liver fat and iron is essential for diagnosis and treatment monitoring, as well as for evaluation of new therapeutics in clinical trials.1,3Confounder-corrected CSE-MRI estimates PDFF and R2*, as quantitative biomarkers for fat and iron.1 CSE-MRI has been shown to be highly reproducible across scanners, field strengths and manufacturers.4 However, the reproducibility in the setting of concomitant fat and iron deposition is poorly understood. Importantly, fat and iron deposition may confound the estimation of PDFF and R2*, respectively.
Therefore, the purpose of this work is to evaluate the multi-center, multi-vendor reproducibility of CSE-MRI PDFF and R2* quantification at 1.5T and 3T using a quantitative fat-iron phantom.
Methods
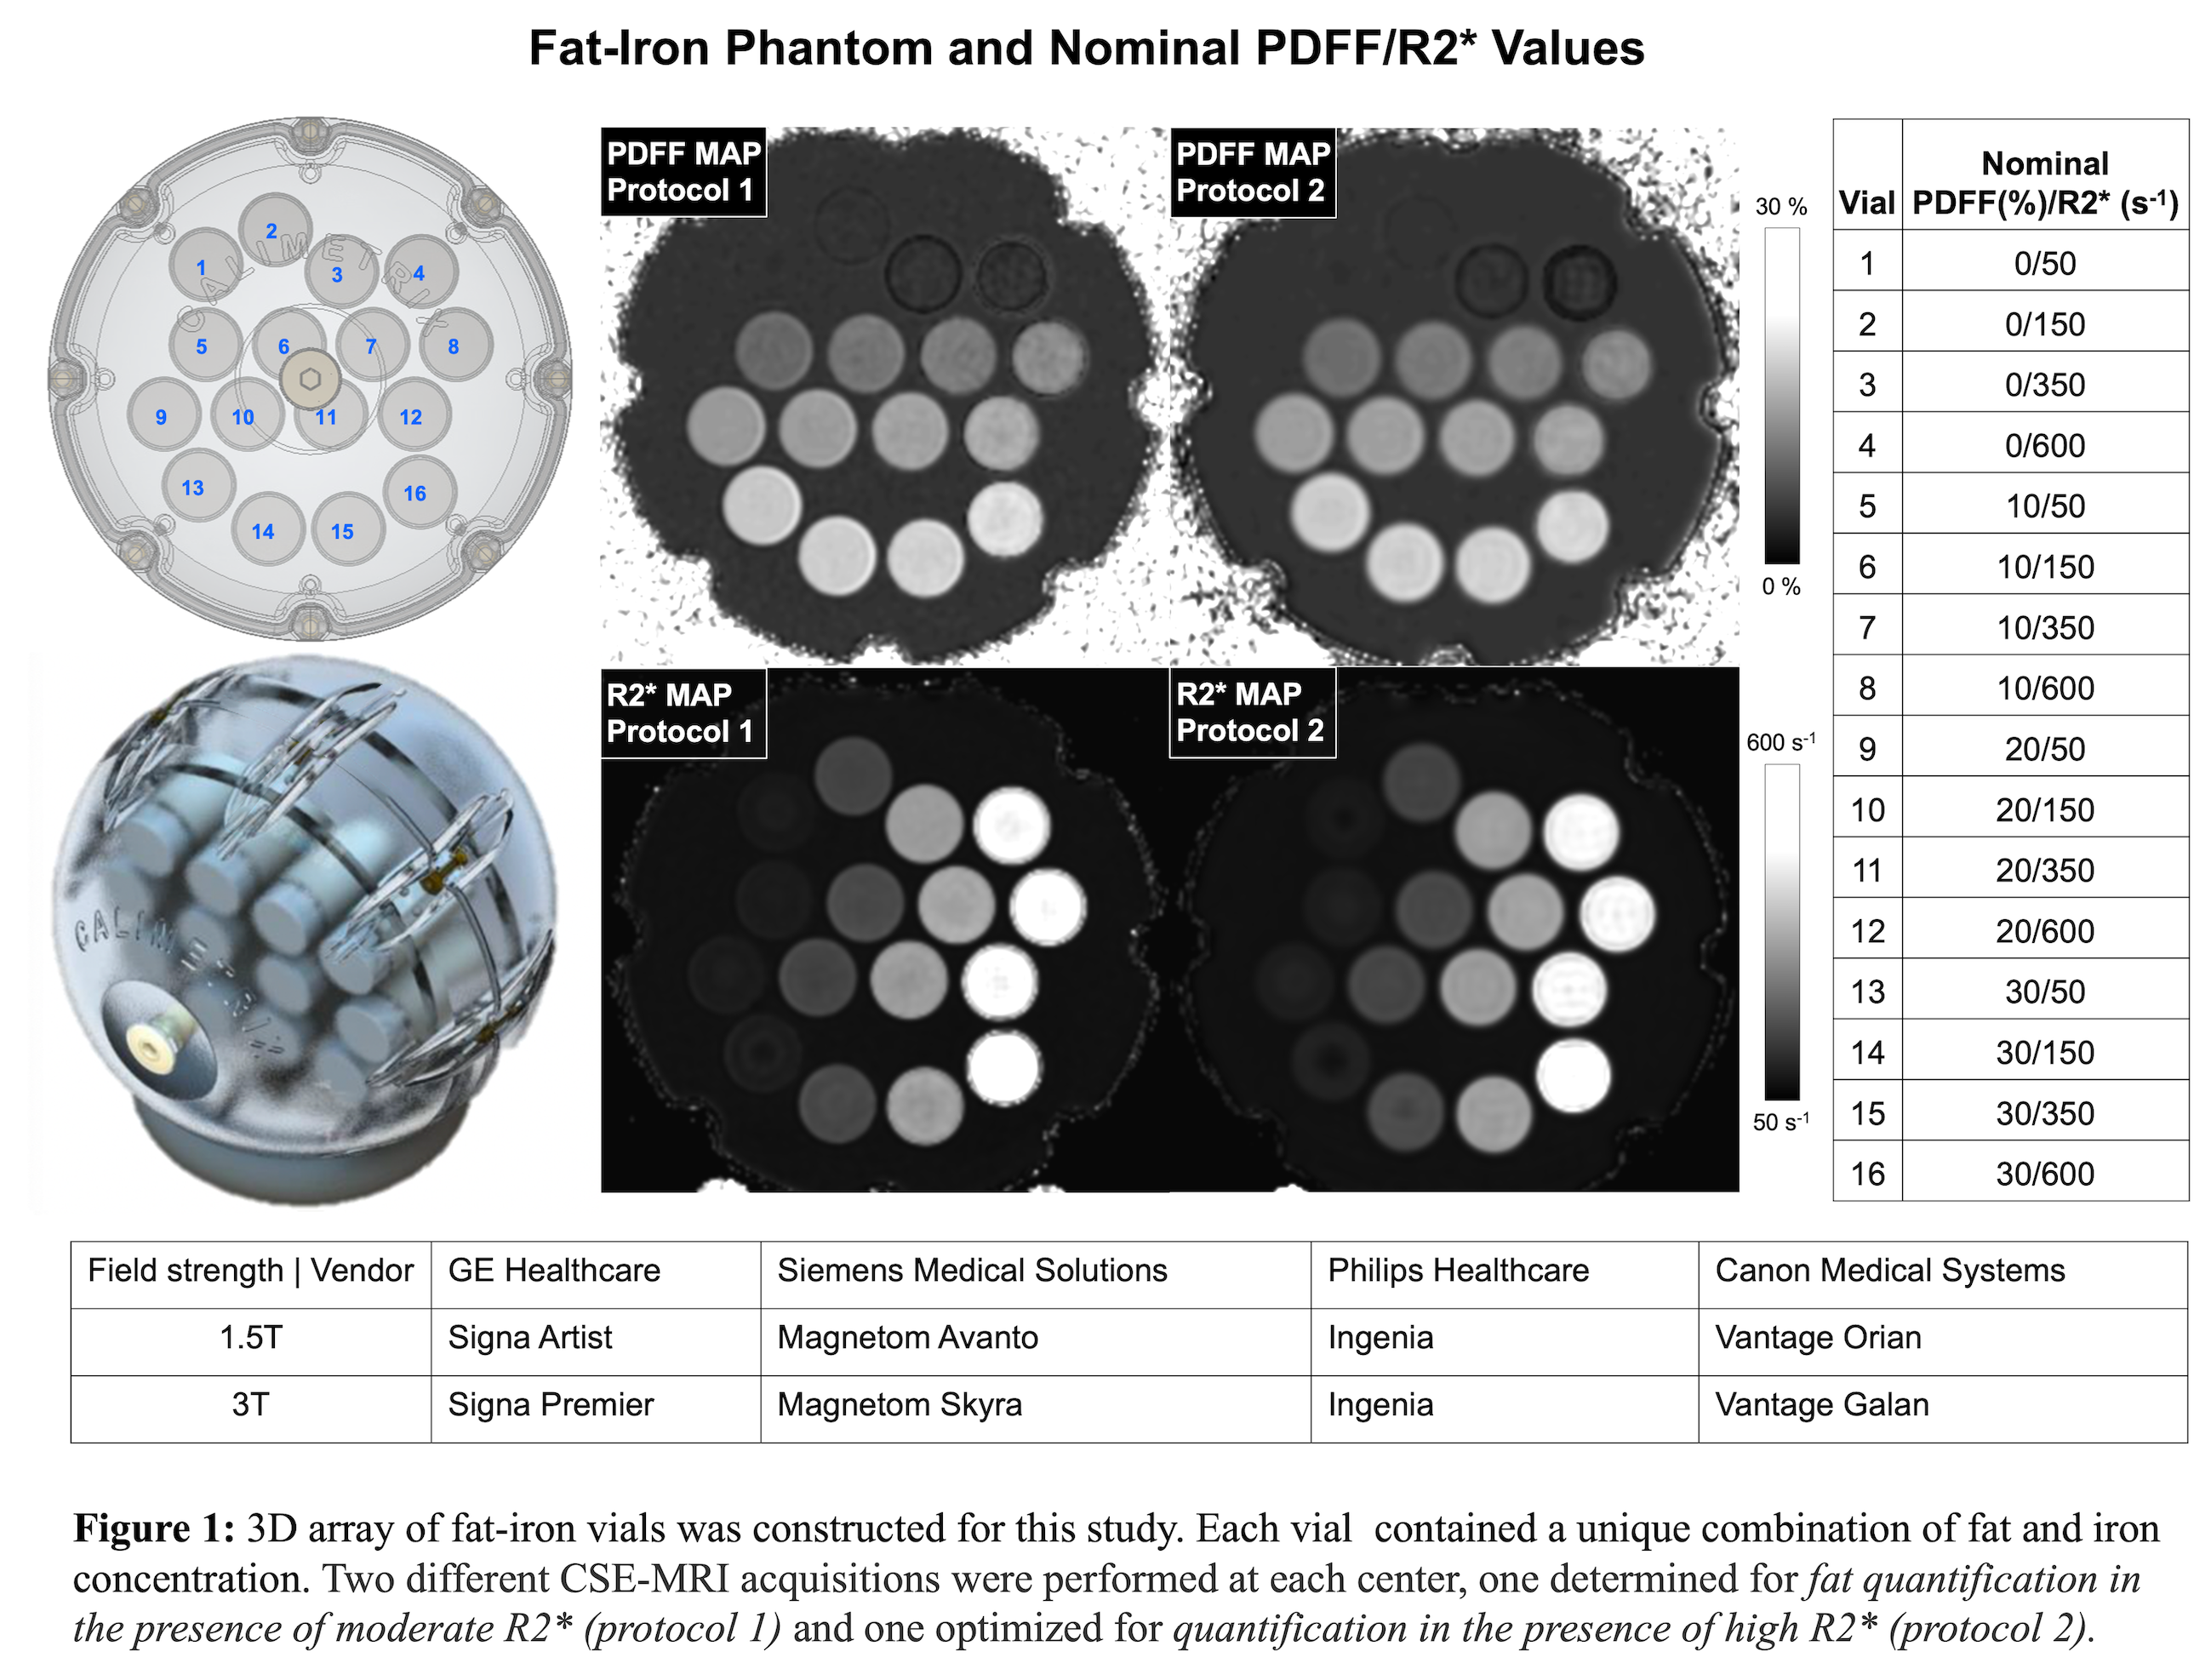
Fat-Iron Phantom Construction: The prototype phantom (Calimetrix, Madison, WI) includes 16 cylindrical vials (20 mL), covering a 4x4 grid of PDFF-R2* values (Figure 1). Each vial contains an agarose-based emulsion with a unique combination of PDFF (range 0-30%, modulated using peanut oil) and R2* values (range 50-600s-1, modulated using superparamagnetic iron-oxide particles (COMPEL, Bangs Labs, Fishers, IN). The vials are placed in a spherical housing containing a doped water bath, to optimize B0 homogeneity and image quality.Imaging Centers: The phantom was scanned at four centers with different MR vendors (1. GE, 2. Siemens, 3. Philips, 4. Canon) in a round-robin study. At each center, the phantom was scanned at both 1.5T and 3T (Figure 1), using a 3D multi-echo, spoiled-gradient-echo sequence (CSE-MRI), with acquisition parameters approximately matched across centers. Two different CSE-MRI acquisitions were used, one determined for fat quantification in the presence of moderate R2* (protocol 1): TE1=1.0 to 1.2ms; ΔTE=0.8-1.96ms (3T) and 1.2-2.1ms (1.5T), 6 echoes, slice thickness=4mm, flip angle=3°(3T) and 3-5°(1.5T); and one optimized for fat-iron quantification in the presence of high R2* (protocol 2): TE1=0.8 to 1.2ms; ΔTE=0.6-1.1ms (3T) and 0.7-1.2 (1.5T), 6-8 echoes, slice thickness=4mm, flip angle=3-4° (3T) and 4-5°(1.5T).
After imaging at the third center (before the shipment to the center 4) the phantom was returned to center 1 for an interim scan to assess phantom stability. A final scan to evaluate stability will be performed after the phantom is returned from center 4 to center 1.
Image Reconstruction and Analysis: PDFF and R2* maps were reconstructed automatically at each of the four centers, using the vendor-provided reconstruction, and transferred to center 1 for analysis. For each vial, an ROI (1.9cm diameter) was drawn in the central slices of the maps, and the median of the corresponding voxel values was recorded for further analysis. Statistical analysis was performed with R (v4.1.0., tidyverse v1.3.1, ggplot2 v.3.3.6, irr v.0.84.1, rstatix 0.7.0). Intraclass correlation coefficient (ICC), scatter plots and reproducibility coefficient (RC)5 were calculated. The stability of the phantom was assessed using the ICC based on the difference between the initial and interim scans on a 3T scanner at center 1.
Results
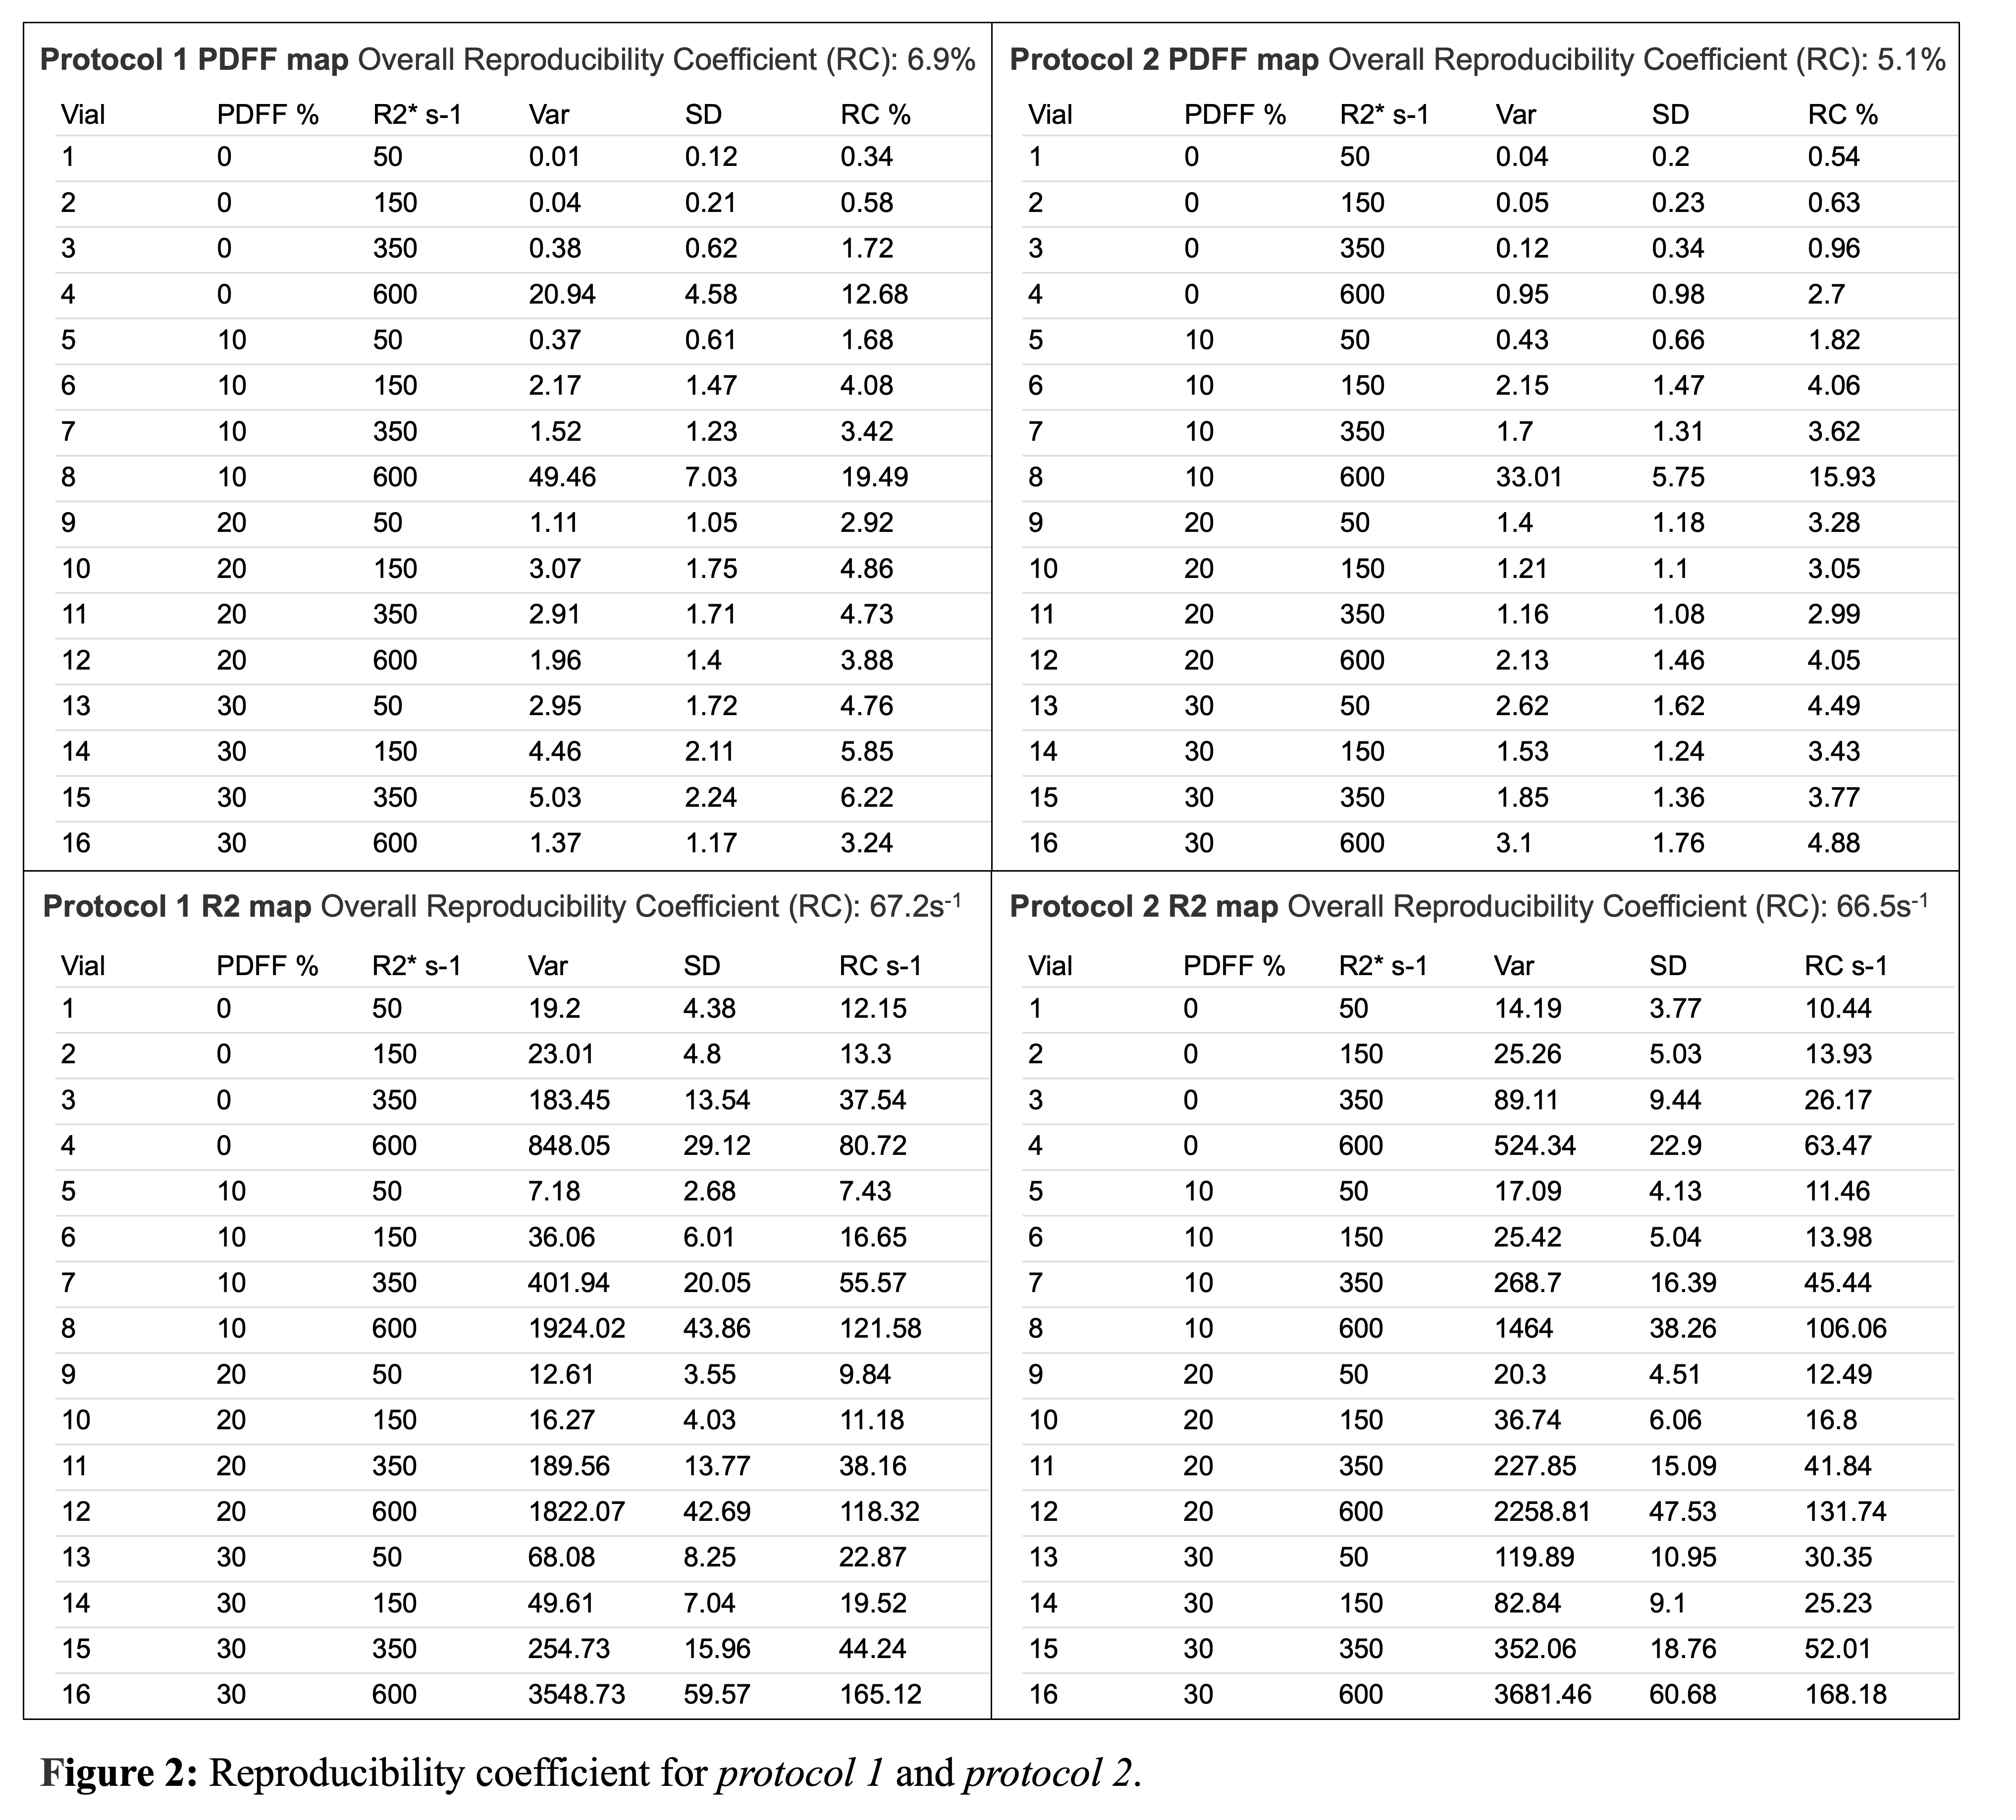
PDFF Reproducibility: Excellent agreement was observed for all PDFF measurements between centers, scanners, and sequences with ICC=0.967 [CI 95% 0.939,0.986]. In the sub-analysis excellent agreement was observed between centers, scanners for protocol 1 with ICC=0.955 [CI 95% 0.916,0.981], as well as for protocol 2, ICC=0.976 [CI 95% 0.953,0.99]. The overall RC was 6.9% for protocol 1, and 5.1% for protocol 2 (Figure 2).R2* Reproducibility: Excellent agreement was observed for all R2* measurements between centers, vendors, and protocols with ICC=0.988 [CI 95% 0.978,0.995]. In the sub-analysis, comparably strong agreement was observed between centers and vendors with ICC=0.987 [CI 95% 0.975,0.995] for protocol 1, and ICC=0.987 [CI 95% 0.976, 0.995] for protocol 2. The overall RC was 67.2 s-1 for protocol 1, and 66.5s-1 for protocol 2 (Figure 2).
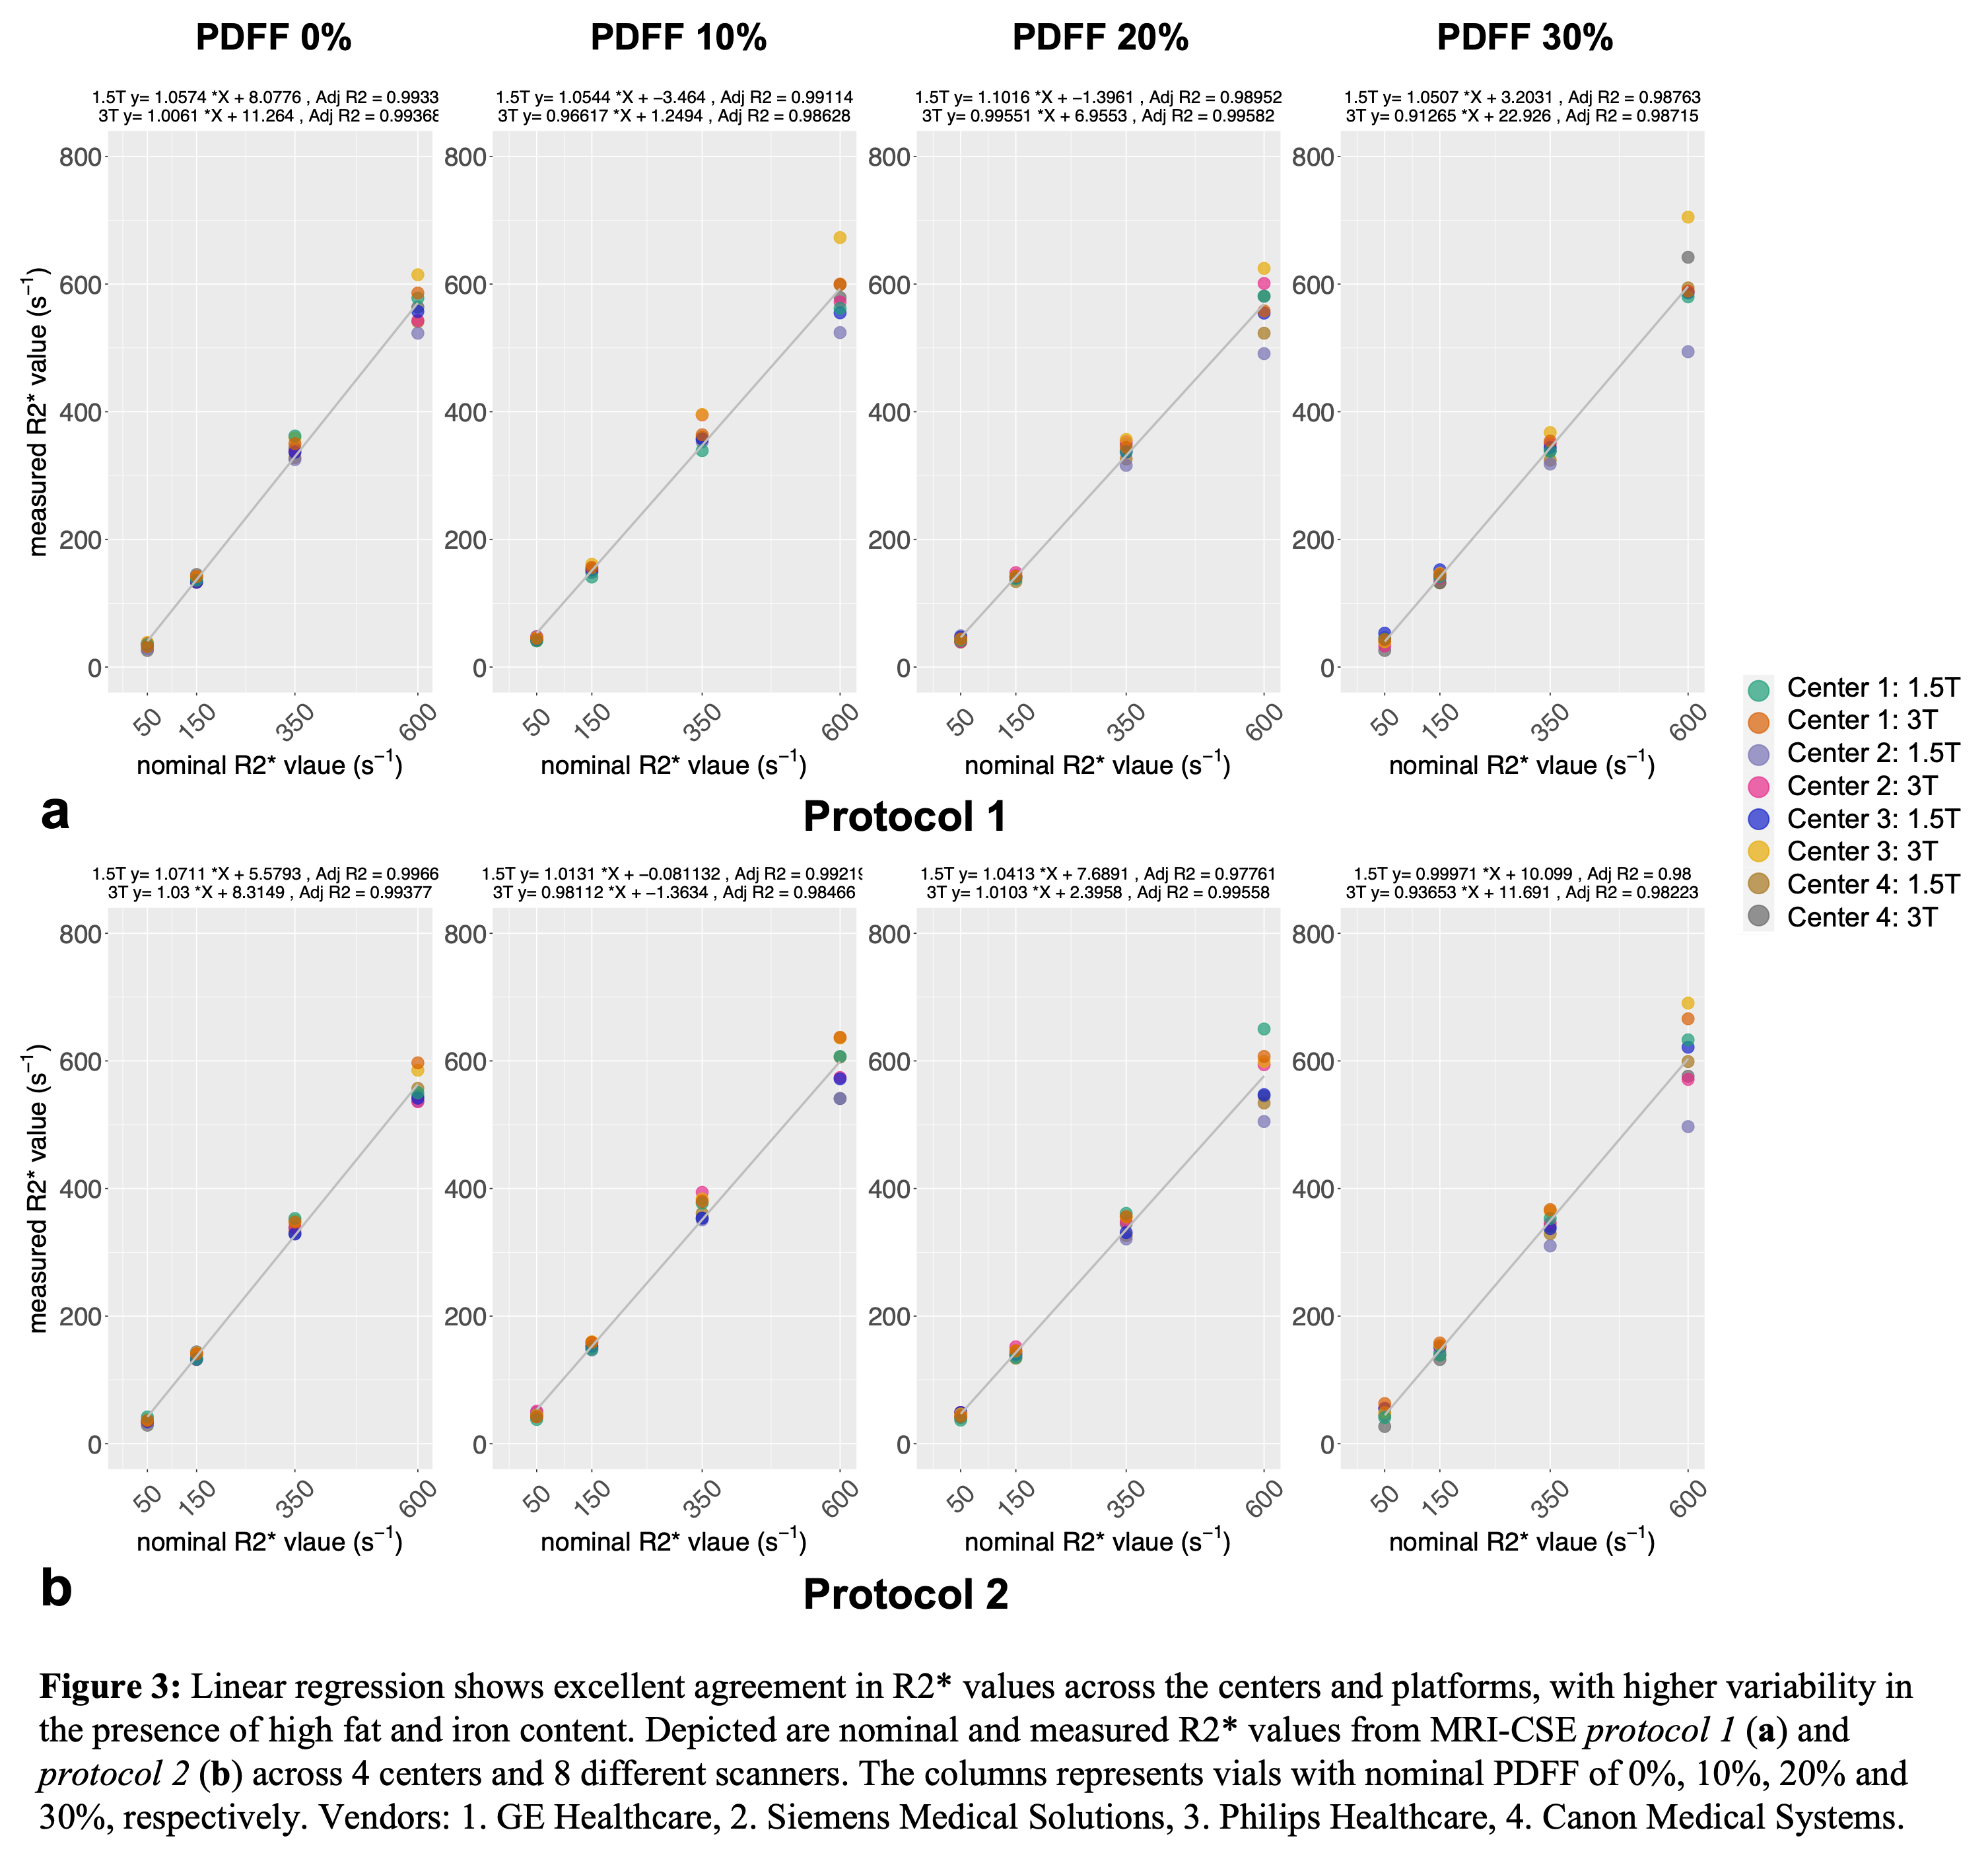
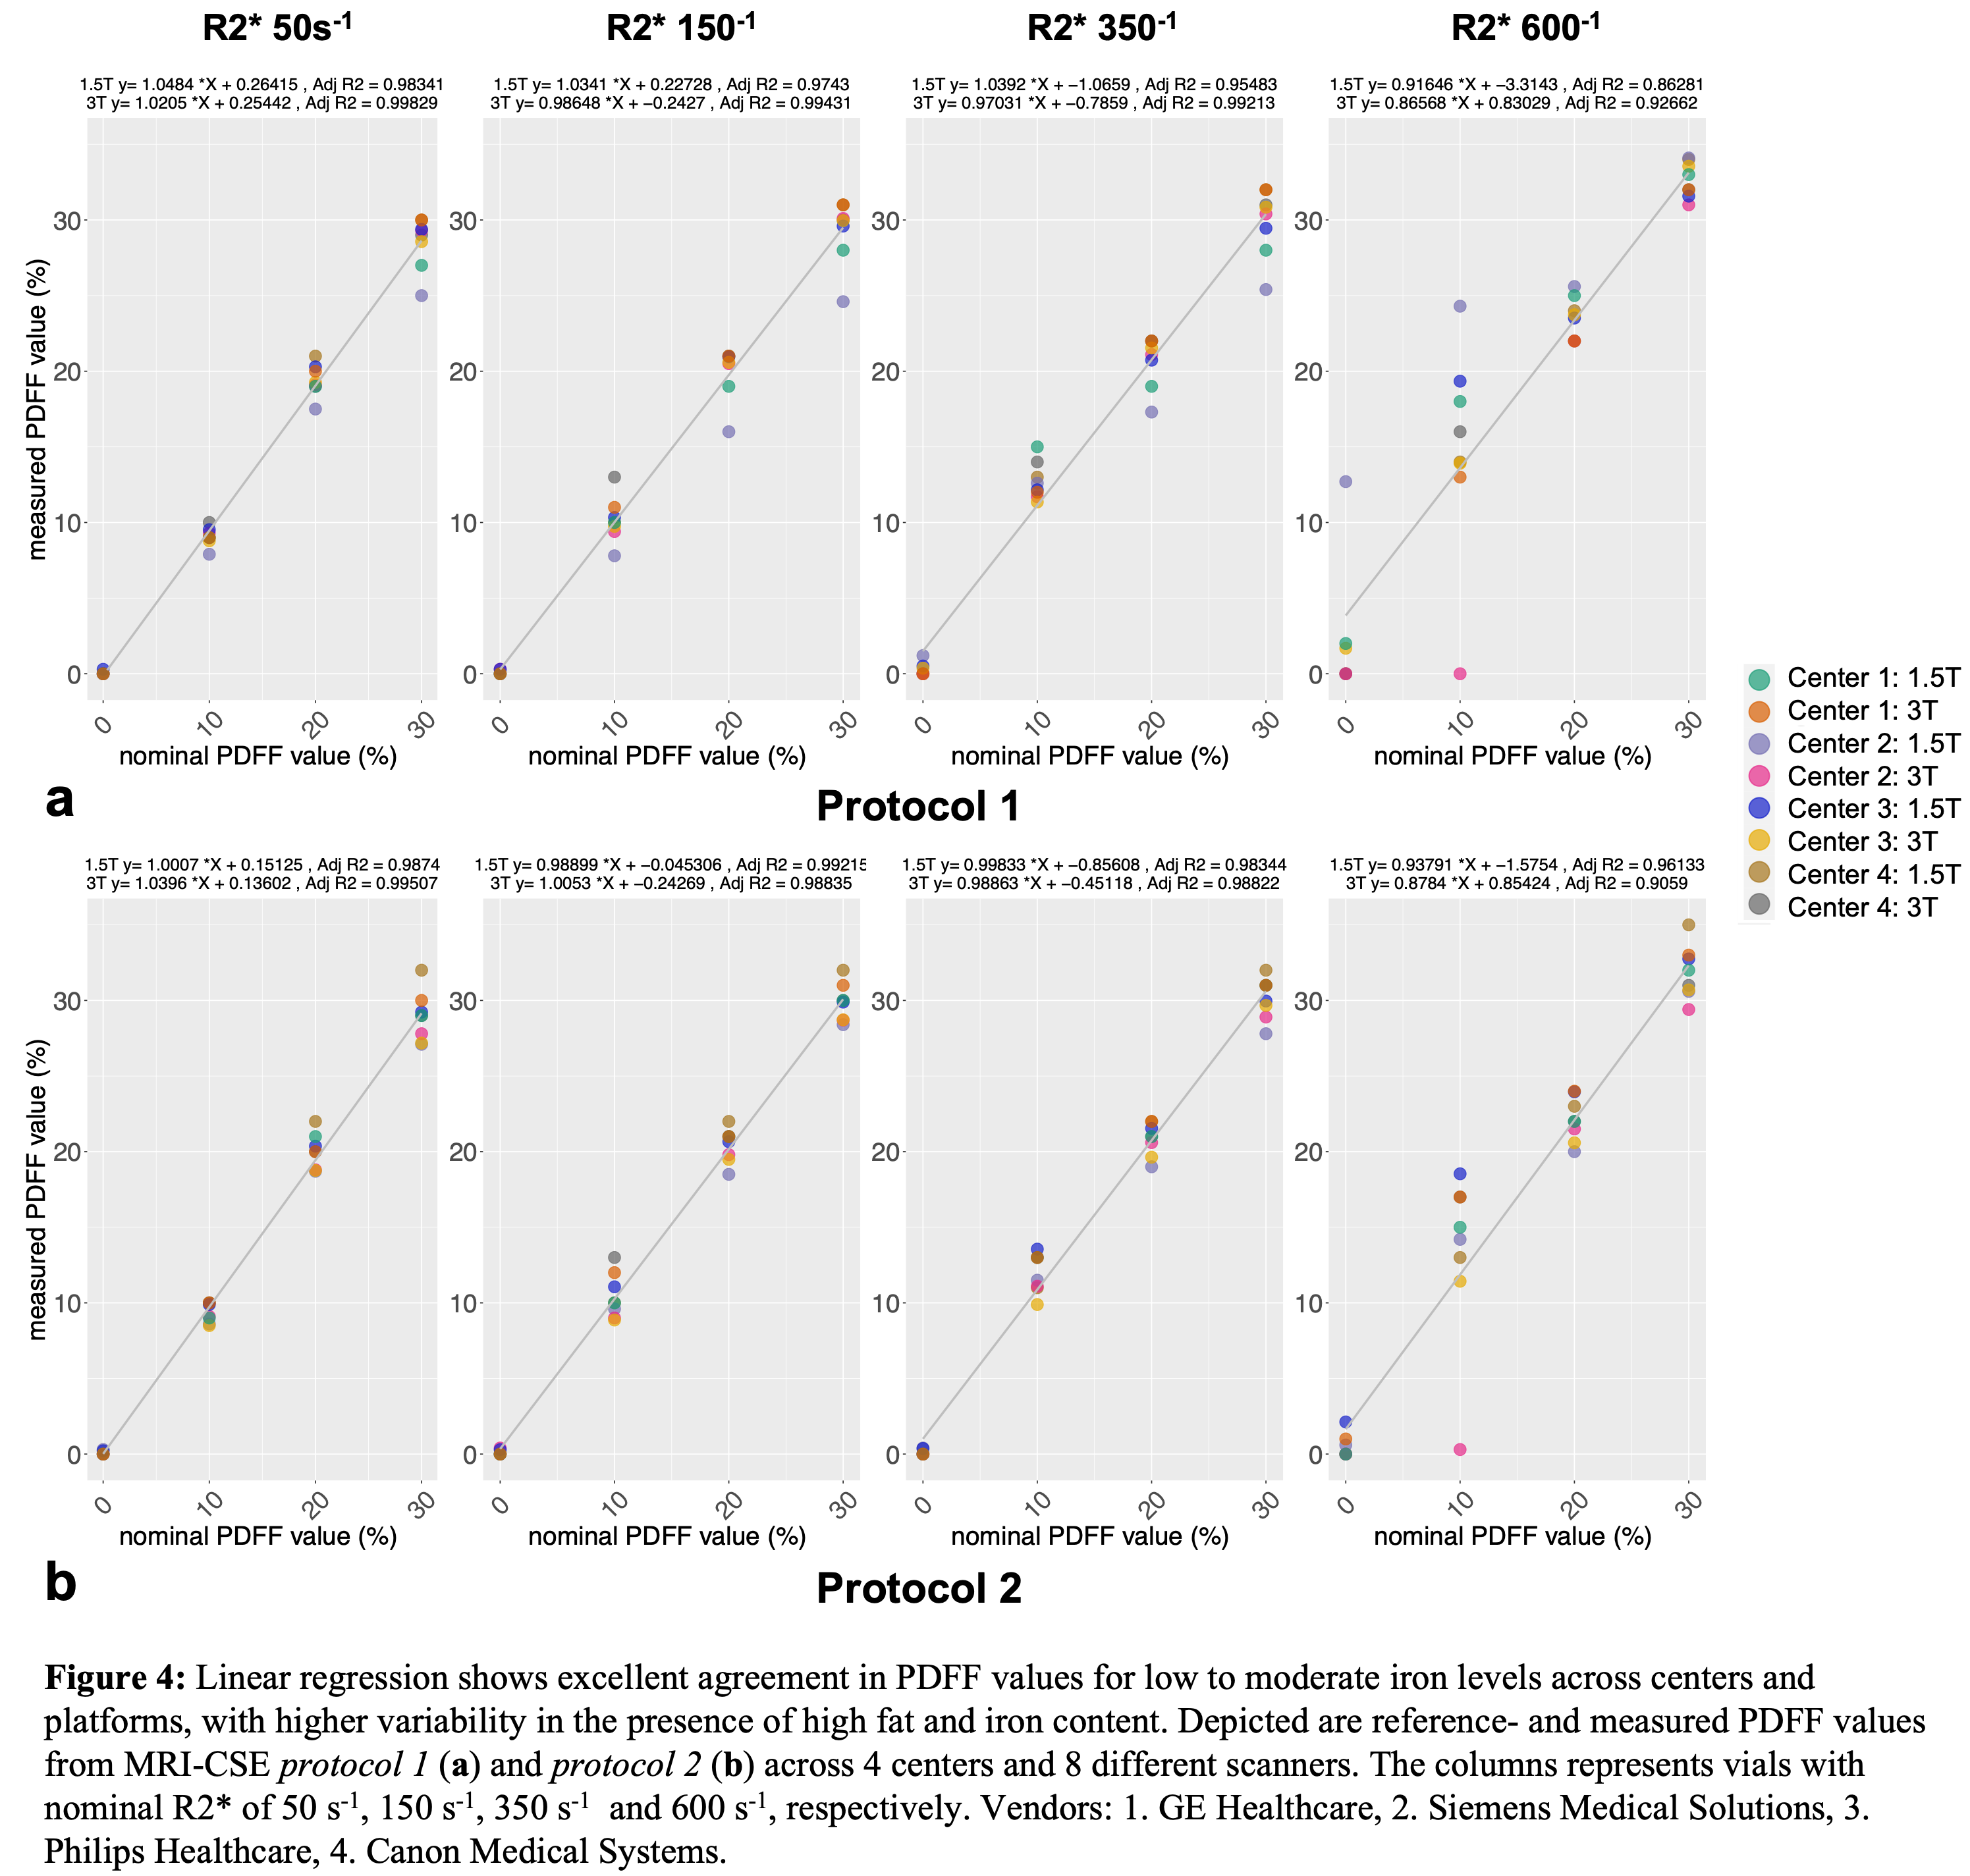
Some spread of the R2* values were observed in the vials with higher PDFF or R2* (Figure 3). More variation was observed in PDFF values across the centers and vendors with increasing PDFF and especially with increasing R2* (Figure 4). There were a few outliers in PDFF measurements detected for high iron concentration vials in both protocols (Figure 4).
Phantom stability: phantom and all vials were inspected upon return, and no signs of damage were detected. Excellent agreement was observed between initial and interim scan measurements at center 1, ICC=1.0 [CI 95% 1,1] for R2*, ICC=0.992 [CI 95%, 0.979,0.997] for PDFF.
Discussion
This work demonstrates excellent multi-center, multi-vendor reproducibility of fat and iron quantification at both 1.5T and 3T, using a quantitative phantom with simultaneous variation of both fat and iron concentrations. The reproducibility decreases with increasing fat-iron content, with the worst reproducibility observed for PDFF measurements in the presence of high R2*. Further analysis is needed to determine whether the outliers observed at high iron concentration can be explained by lower SNR (acquisition) or differences in map reconstruction.Conclusion
Overall, there is an excellent reproducibility for PDFF and R2* mapping across multiple centers, vendors, protocols, and field strengths. These results may advance the utilization of PDFF and R2* as reproducible quantitative biomarkers in patients with concomitant abnormal liver fat and iron accumulation.Acknowledgements
The authors acknowledge support from the NIH (R44-EB025729, R01-DK117354, R01-EB031886). The authors also acknowledge support from GE Healthcare and Bracco Diagnostics who provide research support to the University of Wisconsin, Siemens Healthineers who provides research support to CHOP, Philips Healthcare who provides research support to UTSW, and Canon Medical Systems who provides research support to UCSD. Dr. Reeder is the Fred Lee Sr. Endowed Chair of Radiology.The authors also wish to acknowledge Calimetrix for providing the phantom used in this study.References
1. Starekova J, Hernando D, Pickhardt PJ, Reeder SB. Quantification of Liver Fat Content with CT and MRI: State of the Art. Radiology. 2021;301(2):250-262. doi:10.1148/radiol.2021204288
2. Kühn JP, Meffert P, Heske C, et al. Prevalence of Fatty Liver Disease and Hepatic Iron Overload in a Northeastern German Population by Using Quantitative MR Imaging. Radiology. 2017;284(3):706-716. doi:10.1148/radiol.2017161228
3. Starekova J, Reeder SB. Liver fat quantification: where do we stand? Abdom Radiol. Published online October 6, 2020. doi:10.1007/s00261-020-02783-1
4. Yokoo T, Serai SD, Pirasteh A, et al. Linearity, Bias, and Precision of Hepatic Proton Density Fat Fraction Measurements by Using MR Imaging: A Meta-Analysis. Radiology. 2018;286(2):486-498. doi:10.1148/radiol.2017170550
5. Weingärtner S, Desmond KL, Obuchowski NA, et al. Development, validation, qualification, and dissemination of quantitative MR methods: Overview and recommendations by the ISMRM quantitative MR study group. Magnetic Resonance in Med. 2022;87(3):1184-1206. doi:10.1002/mrm.29084
Figures