1049
Probing underlying biophysical mechanisms of electrical properties change by pathogenesis at the microscopic cellular level1School of Biomedical Engineering, Anhui Medical University, Hefei, China, 2School of Information Technology and Electrical Engineering, University of Queensland, Brisbane, Australia, 3Department of Anatomy, Anhui Medical University, Hefei, China
Synopsis
Keywords: Electromagnetic Tissue Properties, Liver
Magnetic resonance electrical properties tomography provides a non-invasive approach to extracting pixel-wise electrical properties by B1 field mapping. However, there is a void in our understanding of the underlying biophysical mechanism of electrical properties changes accompanied by pathogenesis at the microscopic cellular level. In this work, we build a microscopic tissue model to study fatty liver disease, which focuses on exploring the relationship between fat fraction and electrical properties. Our findings could bridge microscopic lesions and pixel-wise EPT images and may offer a novel strategy for retrieving electrical properties via fat quantification techniques such as Dixon directly.Introduction
As a pair of promising biophysical markers, the electrical properties (EPs), including conductivity and relative permittivity, could be applied in disease detection [1]. Magnetic resonance electrical properties tomography (EPT) provides a non-invasive approach to extracting pixel-wise EPs values by B1 field mapping [2]. However, there is a void in our understanding of the underlying biophysical mechanism of EPs change accompanied by pathogenesis at the microscopic cellular level. We are unclear about the link between the microscopic lesion and pixel-wise EPs quantization and also have less knowledge of the B1 field modifications due to pathological changes in the MRI-EPT reconstruction procedure. In this work, we build a microscopic tissue model to study fatty liver disease, which focuses on exploring the relationship between fat fraction (FF) [3] and EPs. In our study, the B1 field responding to 0~25% FFs at 1.5 T, 3T, and 7 T was investigated.Methods
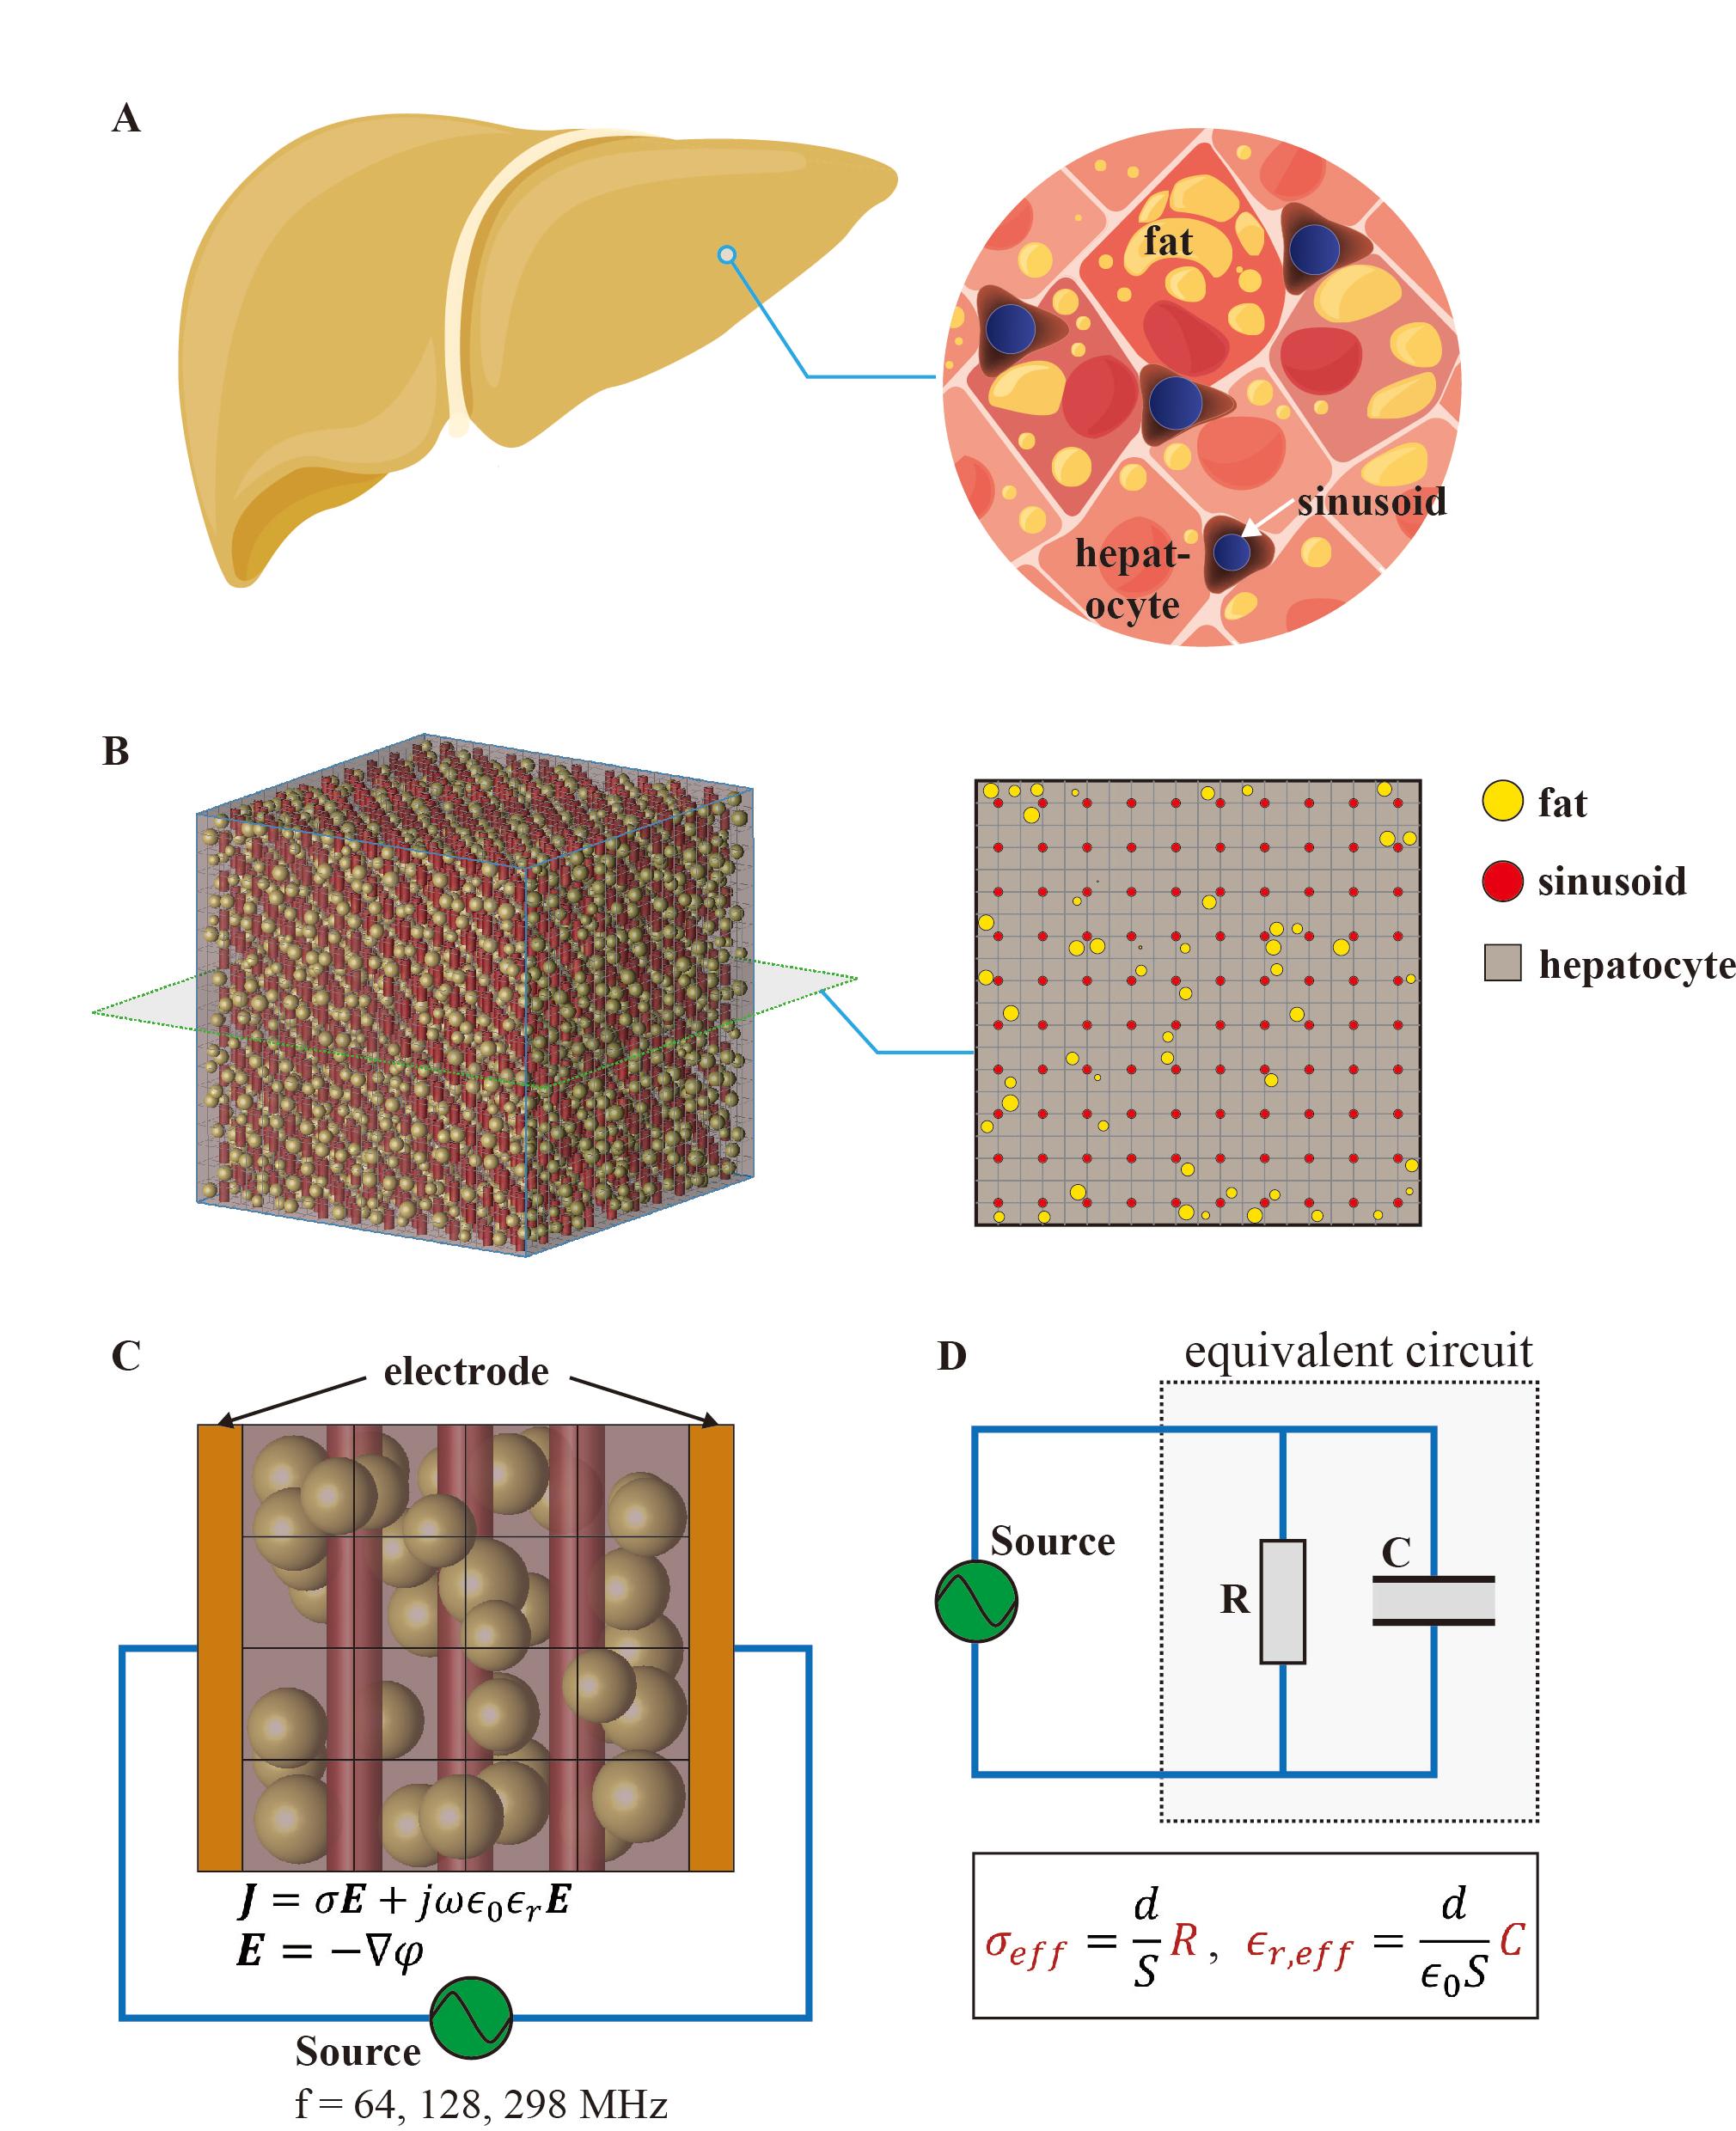
Referring to the real fatty liver structure (Fig1A), the cuboidal liver model was created, including three primary compartments: hepatocytes, sinusoid, and fat [4] (Fig1B). Hepatocytes were simulated as cubes, each with a dimension of 20 μm. We mimic sinusoids with cylinders with a radius/height of 5/20 μm at the intersection of adjacent hepatocytes. Microsphere-simulated fat particles were randomly added to the model, the radius of which follows a normal distribution N (7.78 μm, 1 μm). A total number of fat particles were controlled by specified FF with a range of 0~25%.To estimate the correlation of FF and EPs, we placed a pair of parallel-plane electrodes on both sides of the constructed model. Those electrodes were excited by a voltage source with a frequency of 64, 128, and 298 MHz corresponding to 1.5 T, 3T, and 7 T (Fig1C). Since our model size is noticeably smaller than the estimated wavelength, we conducted the quasi-static field computation with the following control functions:
$$\boldsymbol{J}=\sigma \boldsymbol{E}+j \omega \varepsilon_{0} \varepsilon_{r} \boldsymbol{E}$$
$$\boldsymbol{E}=-\nabla \varphi$$
Where conductivity σ and relative permittivity εr were assigned values according to Ref. [5]. Based on the calculated electric potential φ, we employed the equivalent RC circuit model to retrieve the effective conductivity σeff and relative permittivity εr,eff of the entire fatty live model (Fig1D). Considering a random location and size of fat particles in a fatty liver model, the simulation was repeated 500 times using COMSOL Multiphysics (v5.6, COMSOL, Stockholm, Sweden) and MATLAB (v9.10, MathWorks, Natick, MA, USA).
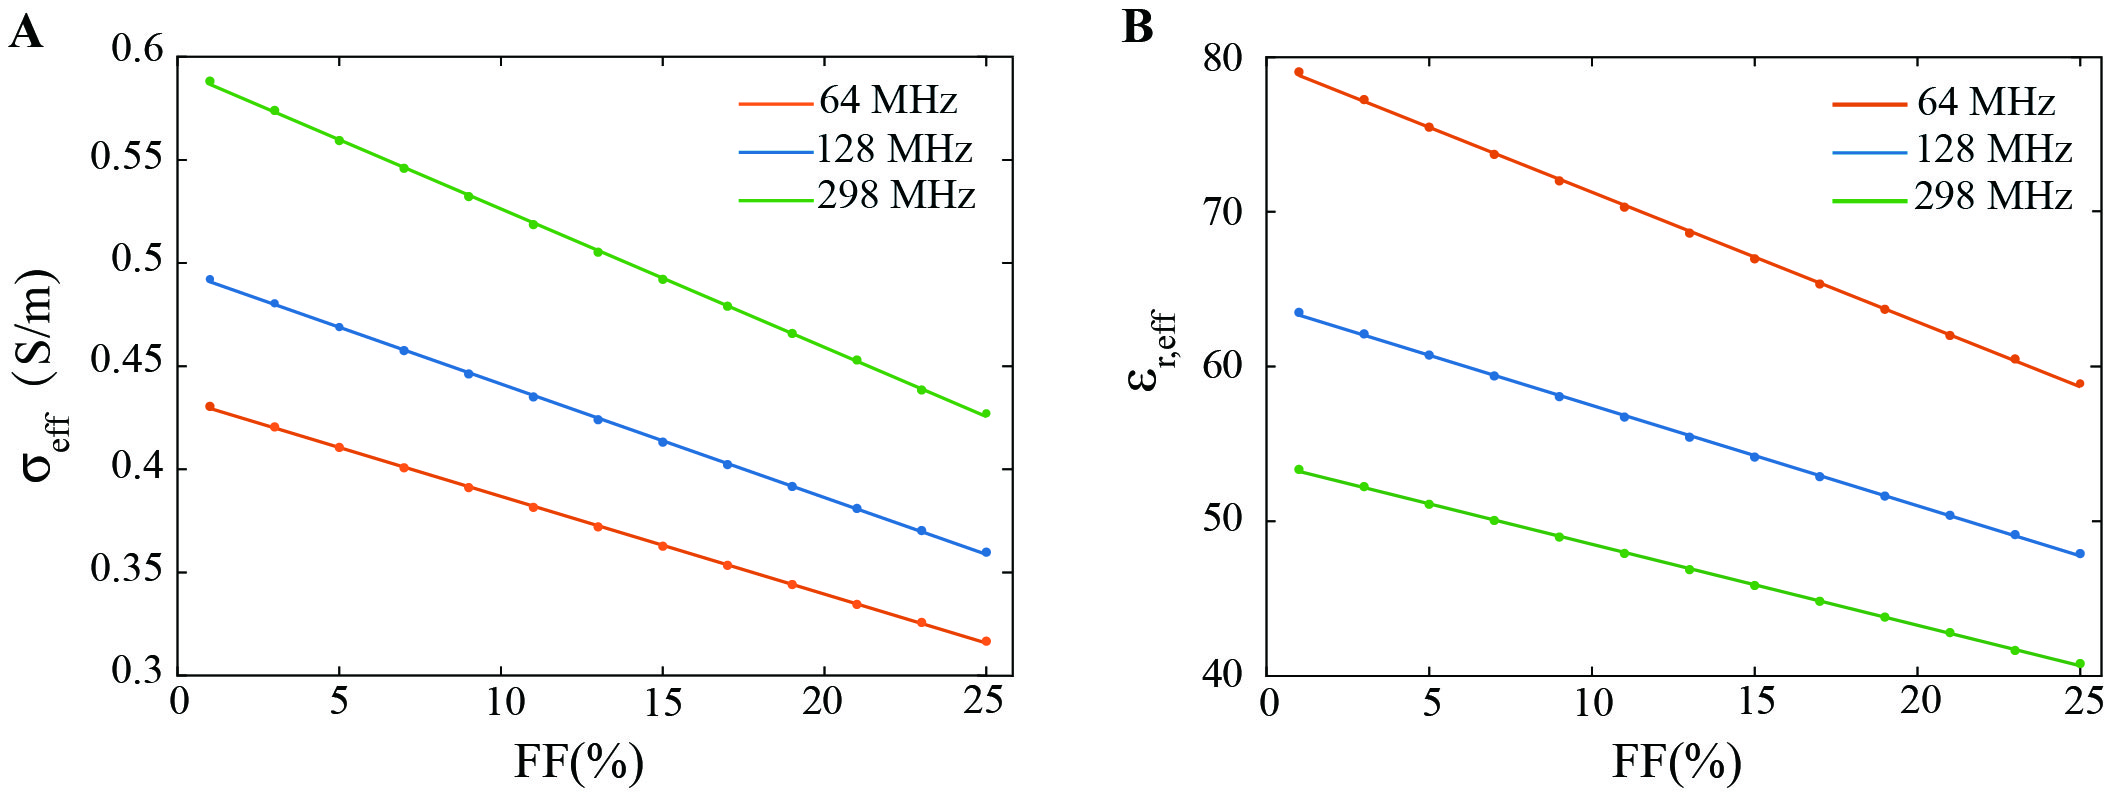
To establish the numerical relationship between FF and EPs, we perform the linear fitting upon the collected effective conductivity and relative permittivity, respectively.
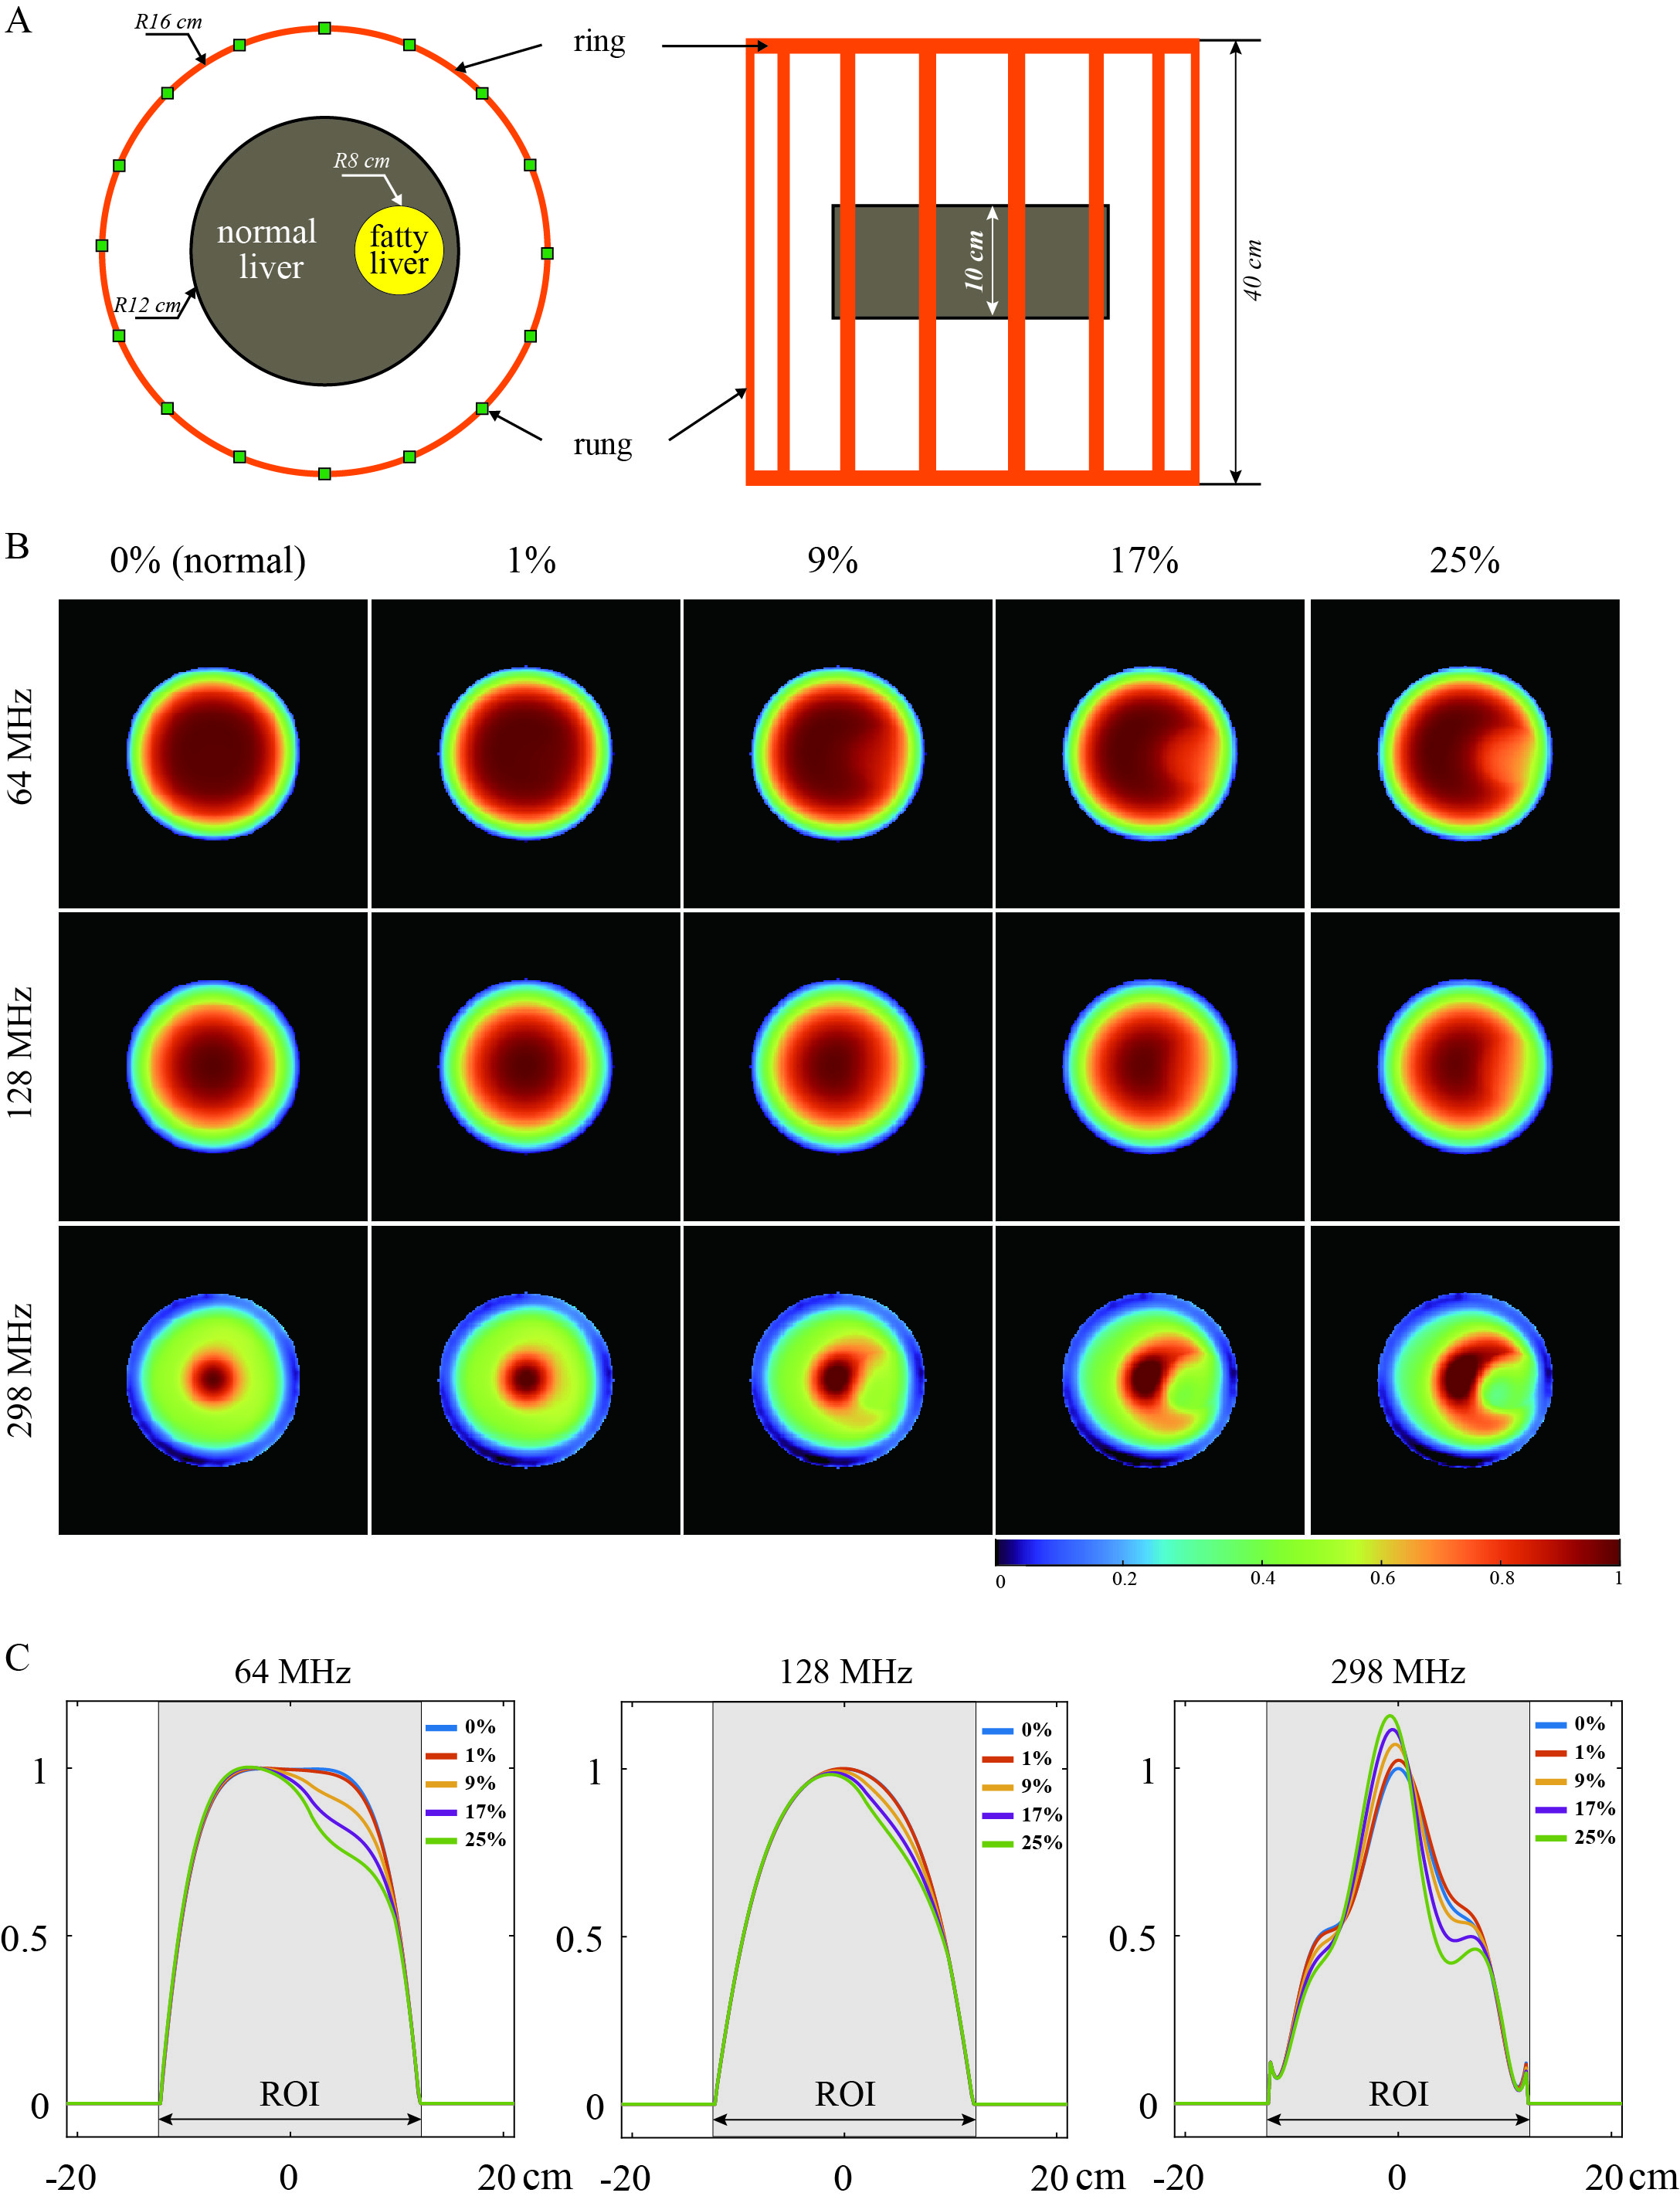
Further, the liver phantom and birdcage coil model [6] were constructed to investigate B1 field responding to the estimated FF (Fig5A). The phantom consisted of normal and fatty components; the latter EPs were assigned according to our fitting results. Three frequencies, i.e. ,64, 128, and 298 MHz, were evaluated. The B1 field was calculated using the full-wave FDTD method with XFDTD (v7.3, Rem com, PA, USA).
Results
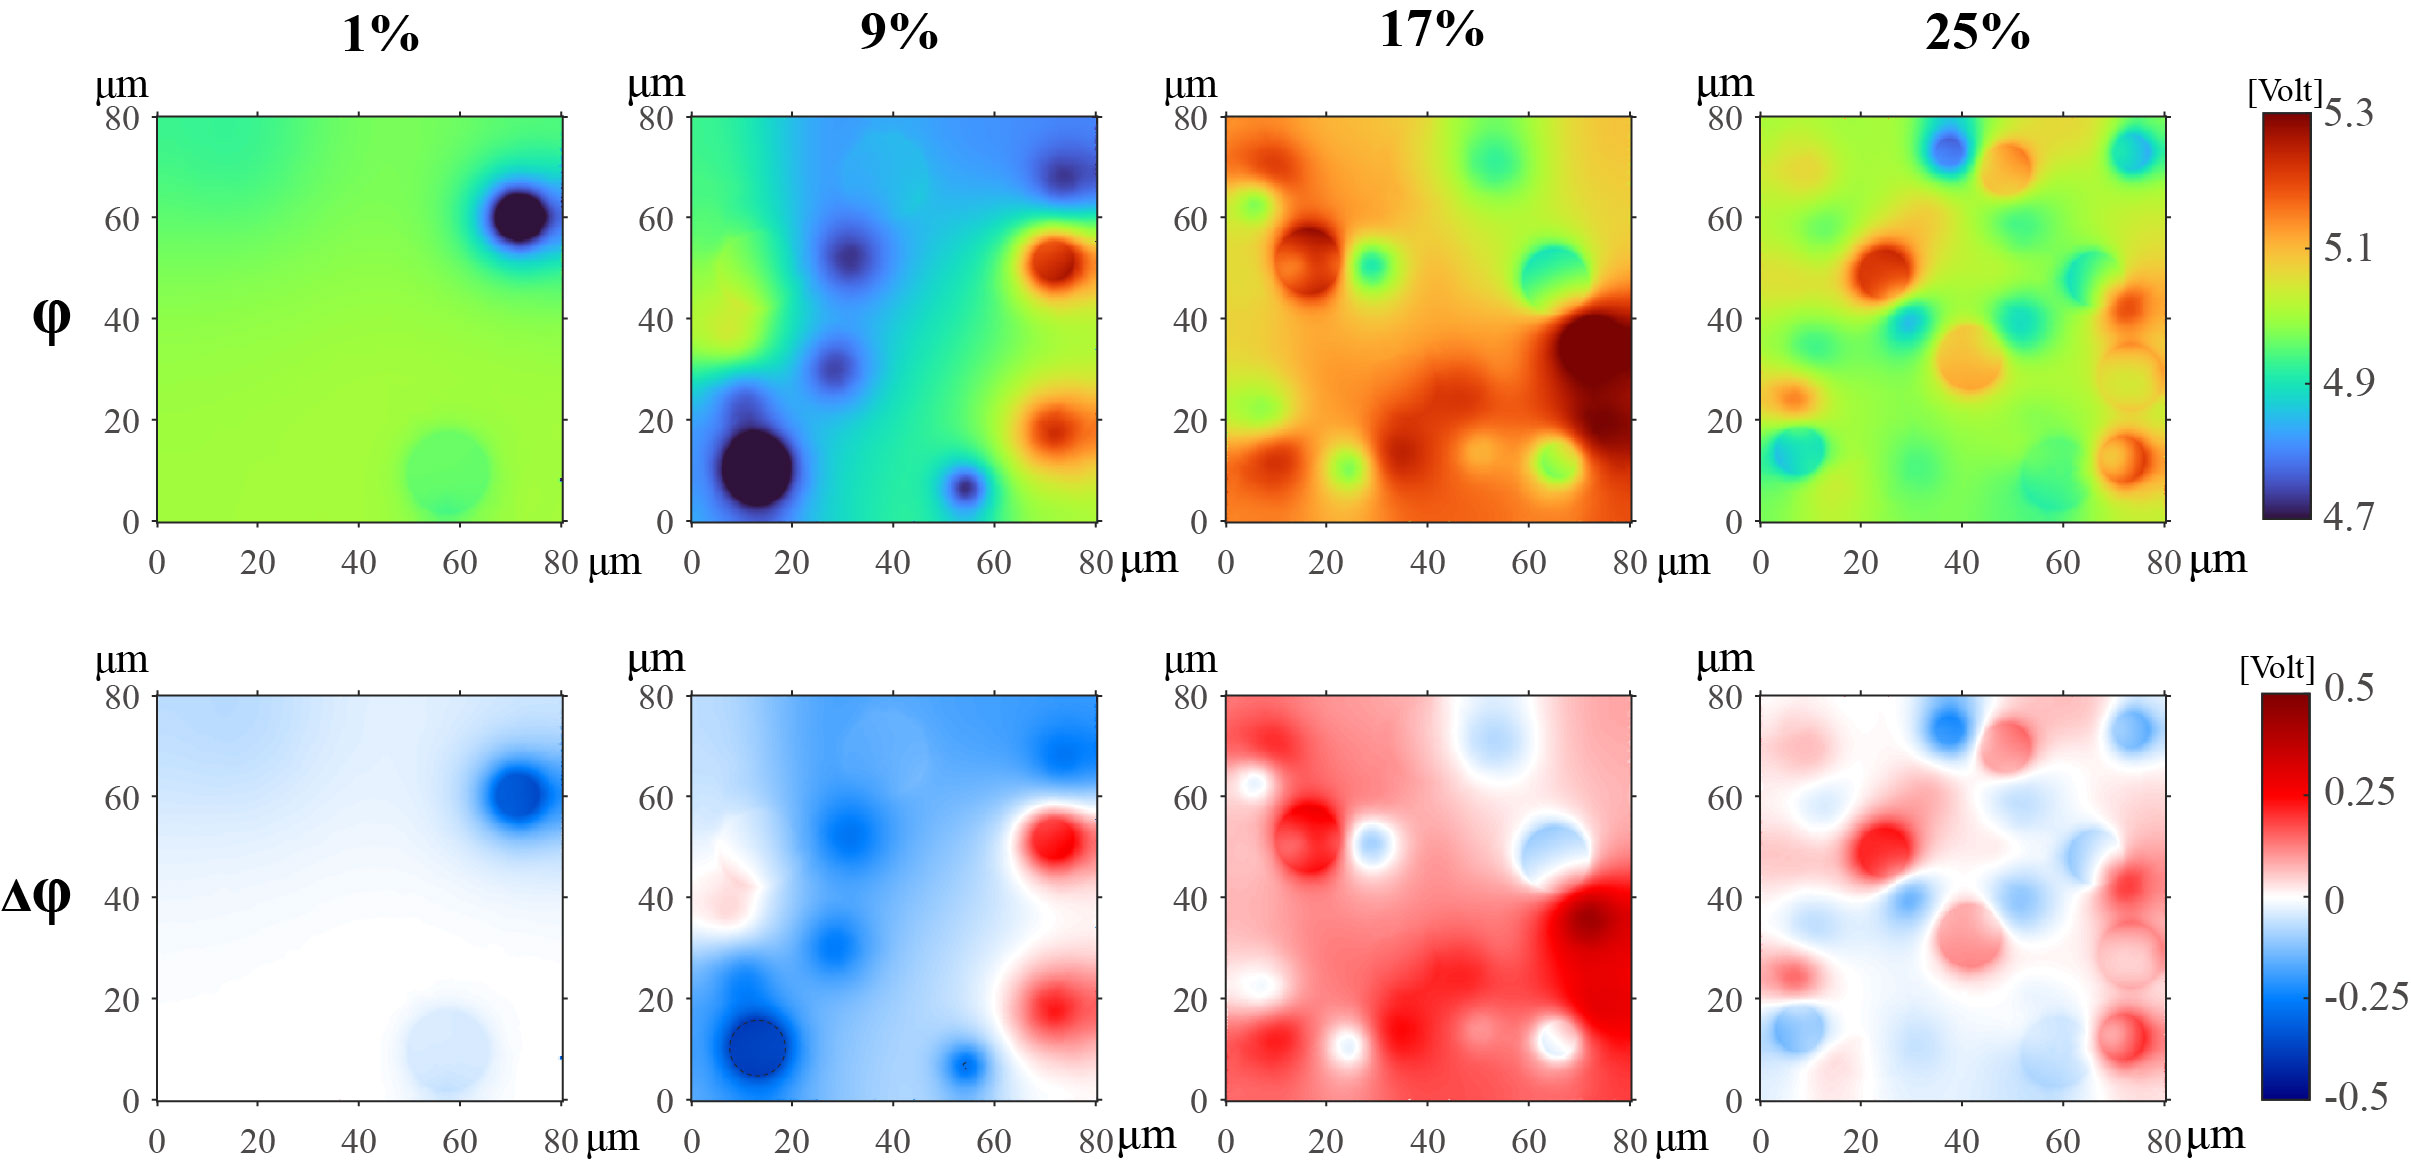
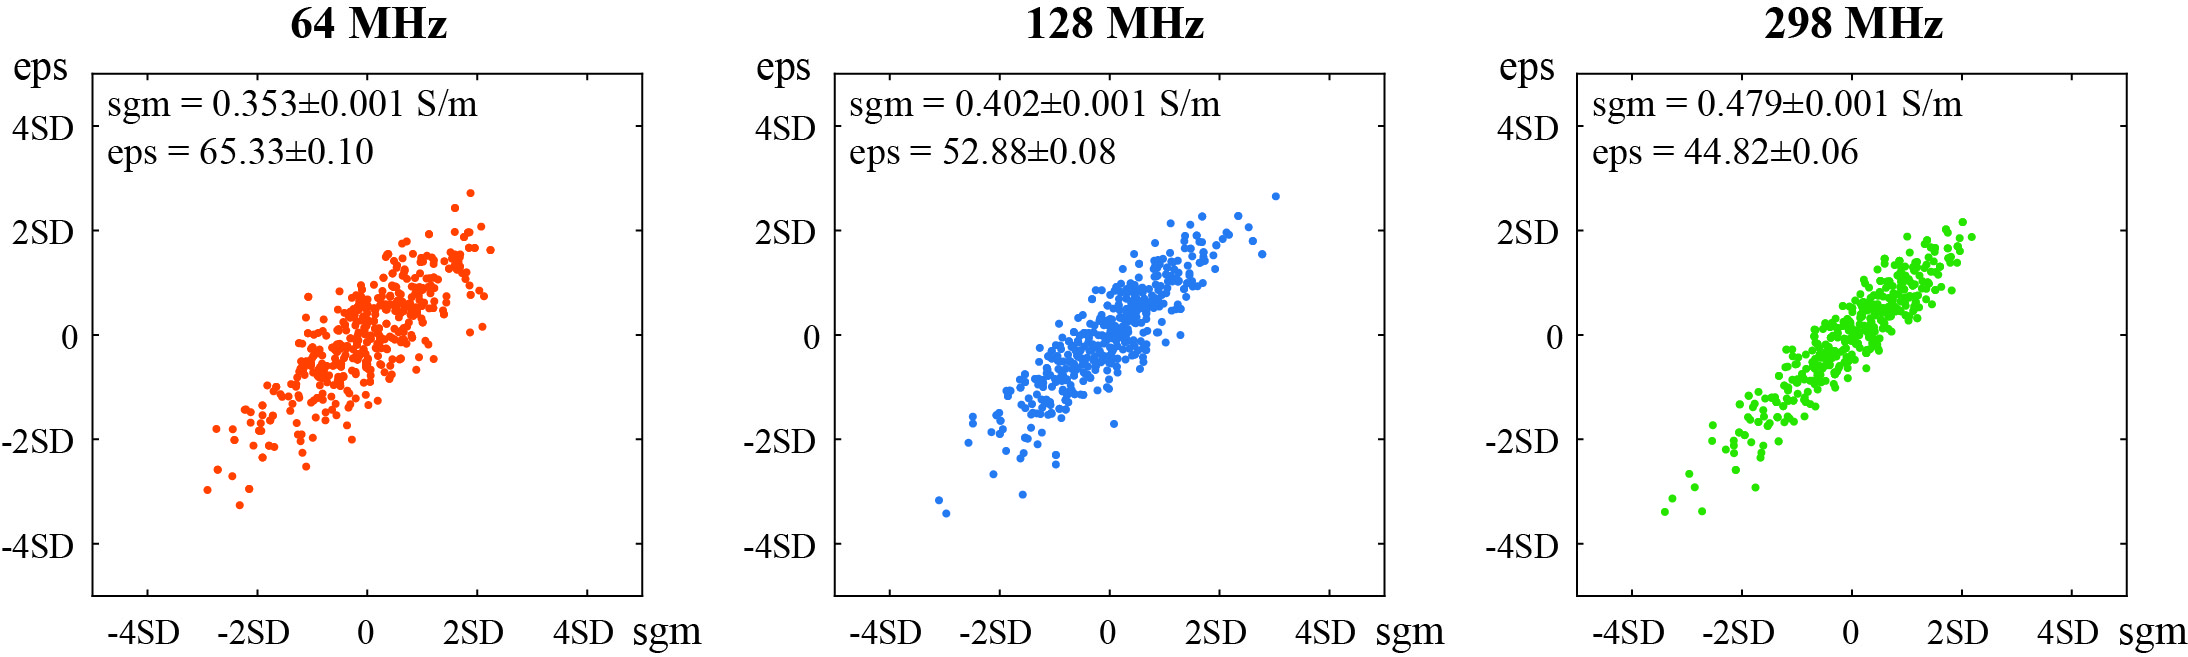
The spatial distribution of electric potential excited by a 128 MHz voltage source is shown on the top row of Fig2. Four columns represent those distributions with respect to 1%, 9%, 17%, and 25% FFs, respectively. The difference of electric potential between four sets of FFs and 0% FF (i.e., normal liver) is shown in the bottom row of Fig2.Fig3 exhibits the calculated effective conductivity and relative permittivity from 500 times simulations at 17% FF. For 64, 128, and 298 MHz, the average values are 0.353±0.001, 0.402±0.001, 0.479±0.001 S/m for effective conductivity, and 65.33±0.10, 52.88±0.08, 44.82±0.06 for effective relative permittivity. The fitting results at three frequencies are shown in Fig4. At three estimated frequencies, the regression slope-intercept vectors are [0.0047, 0.4343], [0.0055, 0.4964], [0.0067, 0.5934] for effective conductivity, and [0.8386, 79.66], [0.6485, 63.97], [0.5235, 53.74] for effective relative permittivity. r2 > 0.99 for all fittings.
B1 field maps at 64, 128, and 298 MHz are displayed in Fig5B. Five columns correspond to 0%, 1%, 9%, 17%, and 25% FFs. To illuminate in detail the distinct response of the B1 field to different FFs, the B1 field values on the horizontal centerline of the phantom are shown in Fig5C.
Discussion / Conclusion
In this study, we investigated the relationship between fat FF and EPs by constructing the microscopic fatty liver model. Such a realistic model could bridge microscopic lesions and pixel-wise EPT images. It provides new insight into the biophysical mechanism of EPs change accompanied by pathogenesis. Although only fatty liver was discussed in this work, the proposed approach can be generalized to study other diseases (such as cancers) by modifying the corresponding model. Moreover, a significant linear correlation between FF and EPs is found. This finding may offer a novel strategy for retrieving EPs via fat quantification techniques such as Dixon [7] directly.Acknowledgements
This work is supported by the National Natural Science Foundation of China (Grant No. 62271007, 82102742). The numerical calculations in this work have been done on the Medical Big Data Supercomputing Center System of Anhui Medical University.References
[1] O’ rourke A P, Lazebnik M, Bertram J M, et al. Dielectric properties of human normal, malignant and cirrhotic liver tissue: in vivo and ex vivo measurements from 0.5 to 20 GHz using a precision open-ended coaxial probe[J]. Physics in medicine & biology, 2007, 52(15): 4707.
[2] Katscher U, Voigt T, Findeklee C, et al. Determination of electric conductivity and local SAR via B1 mapping[J]. IEEE transactions on medical imaging, 2009, 28(9): 1365-1374.
[3] Tang A, Tan J, Sun M, et al. Nonalcoholic fatty liver disease: MR imaging of liver proton density fat fraction to assess hepatic steatosis[J]. Radiology, 2013, 267(2): 422.
[4] Wang C, Reeder S B, Hernando D. Relativity‐iron calibration in hepatic iron overload: Reproducibility and extension of a Monte Carlo model[J]. NMR in Biomedicine, 2021, 34(12): e4604.
[5] Gabriel S, Lau R, Gabriel C. The dielectric properties of biological tissues: III. Parametric models for the dielectric spectrum of tissues[J]. Physics in medicine & biology, 1996, 41(11): 2271.
[6] Collins C M, Smith M B. Signal‐to‐noise ratio and absorbed power as functions of main magnetic field strength, and definition of "90°" RF pulse for the head in the birdcage coil[J]. Magnetic Resonance in Medicine: An Official Journal of the International Society for Magnetic Resonance in Medicine, 2001, 45(4): 684-691.
[7] Kim H, Taksali S E, Dufour S, et al. Comparative MR study of hepatic fat quantification using single‐voxel proton spectroscopy, two‐point Dixon and three‐point IDEAL[J]. Magnetic Resonance in Medicine: An Official Journal of the International Society for Magnetic Resonance in Medicine, 2008, 59(3): 521-527.
Figures