1047
A Deep learning informed Polynomial Fitting Approach for Electrical Properties Tomography1Department of Electrical and Electronic Engineering, Yonsei University, Seoul, Korea, Republic of, 2Department of Radiotherapy, UMC Utrecht, Utrecht, Netherlands, 3Computational Imaging Group for MR Therapy and Diagnostics, UMC Utrecht, Utrecht, Netherlands, 4Department of Radiology, Gangnam Severance Hospital, Yonsei University College of Medicine, Seoul, Korea, Republic of
Synopsis
Keywords: Electromagnetic Tissue Properties, Electromagnetic Tissue Properties
This work presents a neural network informed fitting approach for conductivity reconstructions in MR-Electrical Properties Tomography. First, an artificial neural network is used to predict weights from T2-weighted images. These weights are used in a weighted fitting approach to calculate polynomial coefficients that parametrize the phase map. The conductivity is finally reconstructed from these coefficients. The reconstruction approach is tested on simulated data and in-vivo data and shows more accurate results than conventional fitting methods.Introduction
In Electrical Properties Tomography, tissue conductivity (σ) is reconstructed from MRI measurements non-invasively. The conductivity can be calculated directly from the measured transceive phase using physics-based or deep learning methods1.Physics-based approaches, based on spatial derivatives, such as Helmholtz reconstruction are very sensitive to noise and boundary artifacts2. Fitting-based methods mitigate noise and boundary artifact, but these methods require different kernel sizes and shapes to get accurate results or only work in homogeneous regions, which are usually approximated by applying MR contrast or tissue segmentation information3.
Deep learning (DL)-based methods are more robust to these problems4,5. However, they require an extensive amount of training data for proper generalization and in vivo verification is difficult6. A solution for these problems is to combine DL with physics-based methods.
In this work, we present a DL-informed fitting reconstruction method that uses a neural network to predict weights for an optimal weighted fitting approach for conductivity reconstructions.
Methods
The phase-based Helmholtz relation relates the curvature of the measured phase to the tissue conductivity:$$\sigma=\frac{\triangledown^{2}\phi}{\mu_{0}\omega}[1]$$
Instead of direct calculation, the phase can be parametrized by a second order polynomial 7:
$$P = M\beta [2]$$
Here P is a matrix with the phase values, M is the so called Vandermonde matrix, representing polynomial values at different locations, and β are the polynomial coefficients (for 1,x,y,xy,x2,y2), for in-plane fitting. β can be estimated with a weighted least squares fitting using the following normal equation, where β represents the best linear unbiased estimator, assuming noise is uncorrelated:
$$(M^{T}WM)^{-1}M^{T}WP = \widehat{\beta} [3]$$
Here W is a diagonal matrix with fitting weights. Similarly to eq. 1, the conductivity is proportional to the second order derivative of the polynomial, which here corresponds to a summation of the polynomial coefficients of the second order terms:
$$\sigma=\frac{2}{\mu_{0}\omega}\sum_{i=5,6}\widehat{\beta}_{i} [4]$$
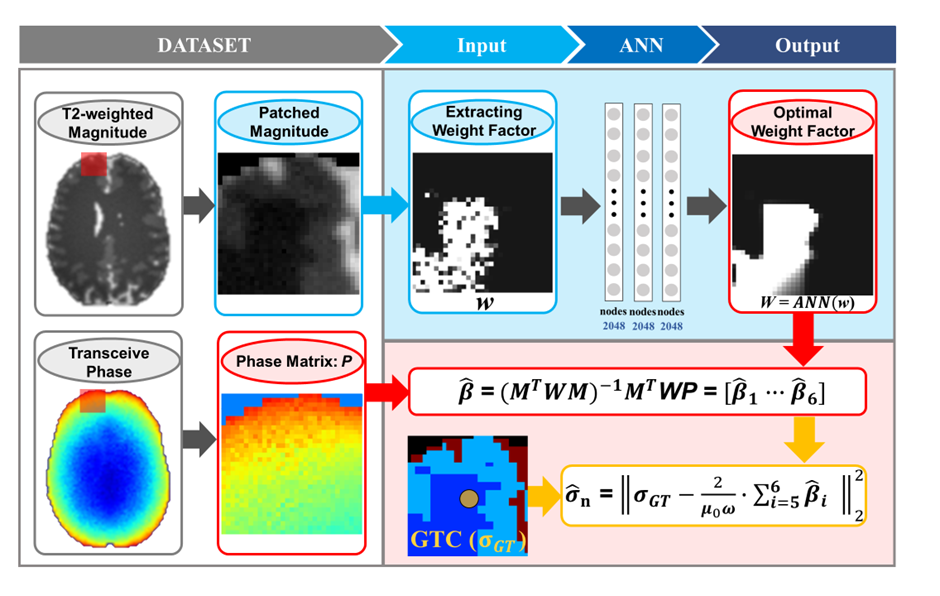
Conductivity reconstruction is done per voxel with a 2D patch of 31x31 voxels. The weights for the fitting are obtained using DL, after which equations 3 and 4 are used to calculate the conductivity.
To estimate W, an artificial neural network (ANN) with three hidden layers and 2048 nodes each is used. The input for the neural network is a patch that contains the weighting factors for the phase fitting approach based on the T2w signal intensity8. The output of the network is the same patch with an optimized set of weights used for the phase fitting, from which conductivity maps are computed as of eq. 4. The complete reconstruction pipeline is visualized in Fig. 1.
To train the ANN-Fit network for the optimization of the W-weights, 15 different brain models with realistic EP values (different for each model), with and without tumor inclusion, simulated in Sim4Life (ZMT, Zurich, Switzerland), were used. Gaussian noise (SNR=20) was added to both the T2w magnitude and phase data. The ANN-Fit network was then trained to optimize the fitting weights (W) by minimizing an L2-loss between the ground truth conductivity and the predicted conductivity obtained through the fitting procedure as of eqs. 3 and 4. Training the network was done on a GeForce TX 1080 Ti , for 10000 epochs (training time was about 4.5 hours).
Testing was performed on: two additional simulated brain models (noiseless and with noise, SNR=20), a healthy volunteer (3 T, Tim Trio, Siemens Healthineers), and a brain tumor patient (3 T , MR750, GE).
Results and discussion
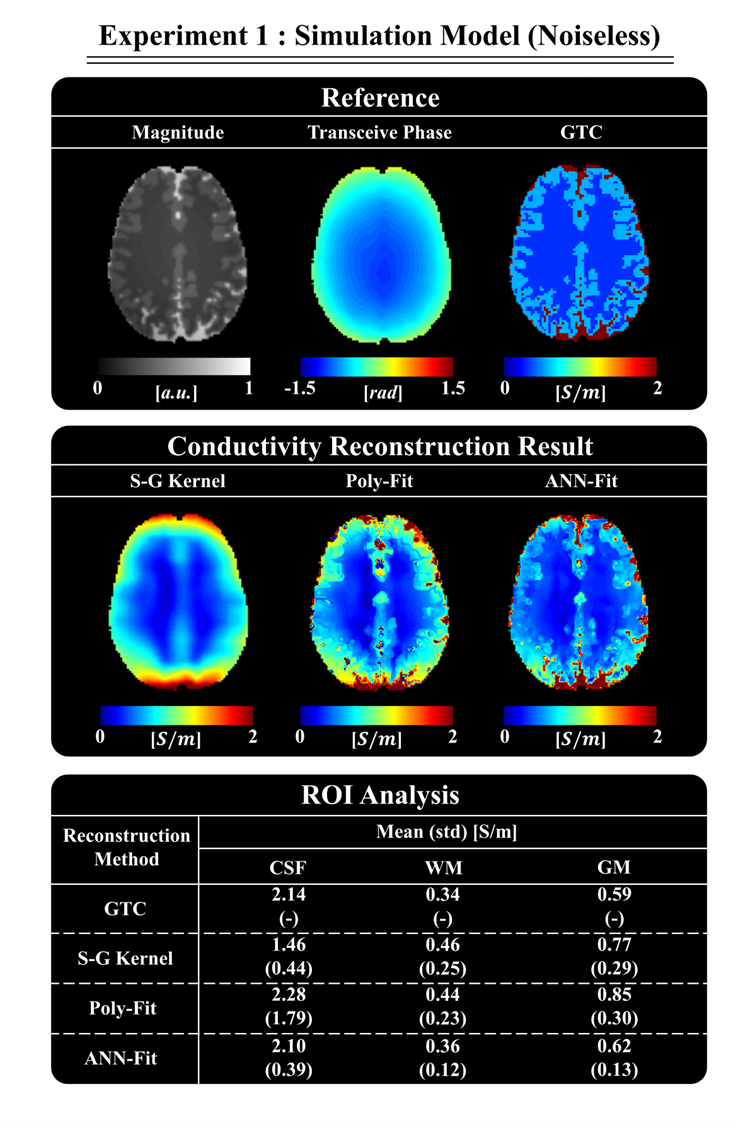
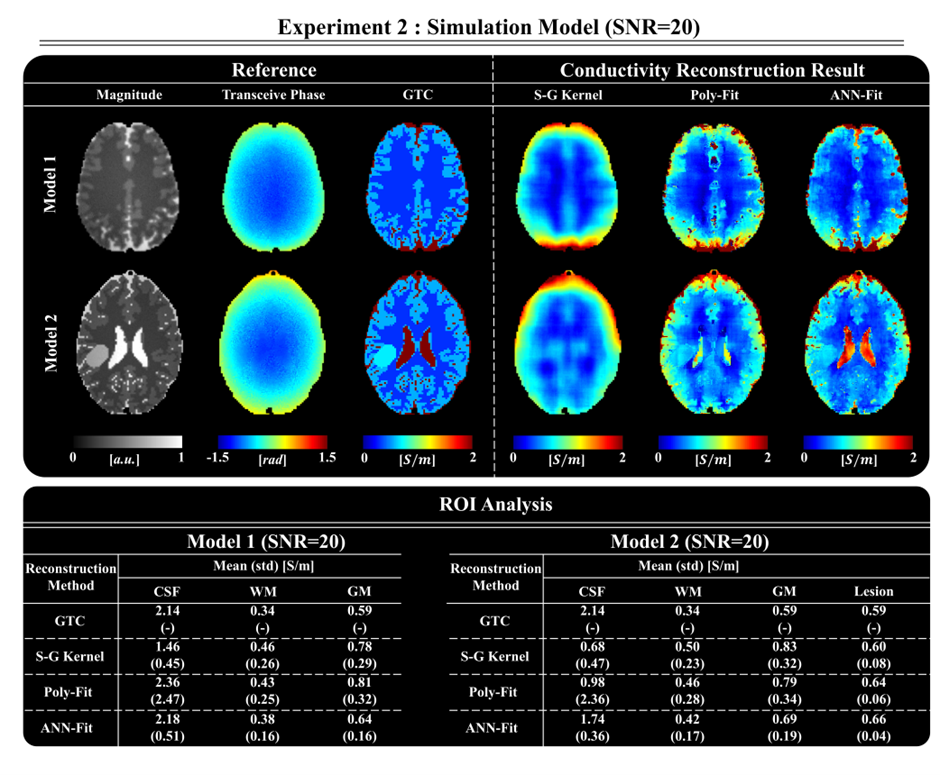
In Fig. 2, the results of the ANN-Fit reconstruction are shown for a brain model without noise. These are compared to the results obtained with a Savitsky-Golay (S-G) fitting kernel without and with magnitude weighting (here called Poly-Fit)7. The ANN-Fit method shows higher accuracy and precision compared to the other reference methods (see ROI analysis in Fig. 2).In Fig. 3, reconstructions on a simulated brain model with and without pathology inclusion and SNR=20 are shown. The ANN-Fit method consistently shows higher accuracy and precision compared to the reference methods. The tumor inclusion is also visible in the reconstructed conductivity map with the ANN-Fit method and shows better homogeneity compared to the Poly-Fit method.
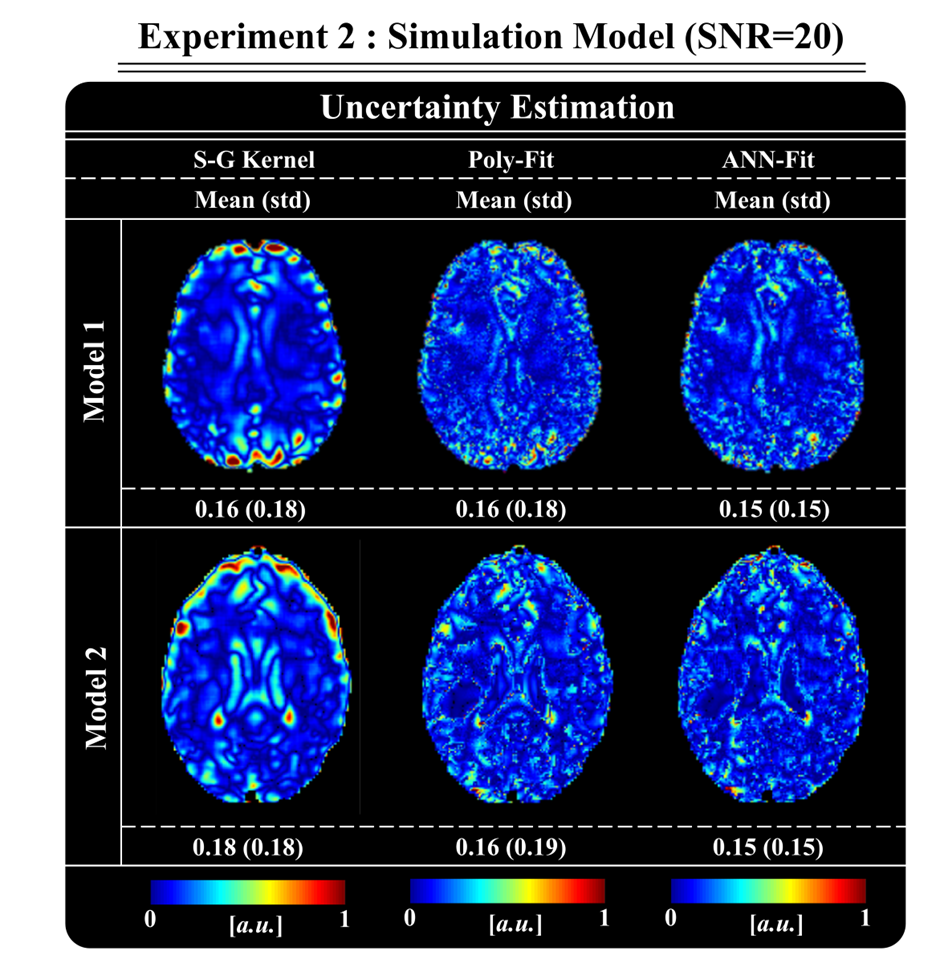
An important advantage of this method is that only the fitting weights (W) are influenced by the network. As a result, the conductivity calculation itself is physics-based, which makes validation easier compared to direct deep learning methods. Furthermore, the computation of the difference between the input (measured) phase and the phase obtained using the beta parameters (after masking a patch using the corresponding weighted mask) can be used as an uncertainty estimate for the reconstructed conductivity, which is shown in Fig.4. Note the higher mean absolute error and standard deviation values for Poly-Fit compared to ANN-Fit.
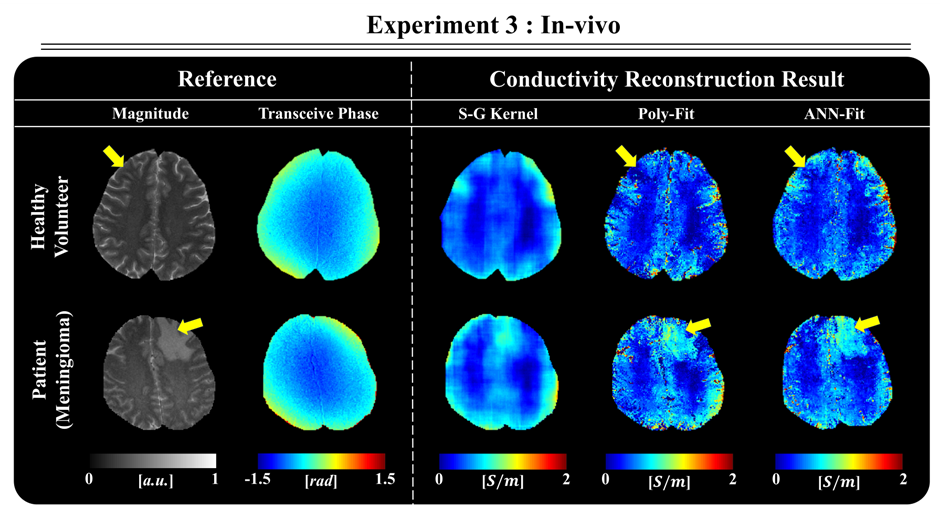
Finally, Fig. 5 shows that the ANN-Fit method also generates realistic results in vivo, that show higher quality and better lesion reconstruction compared to the reference methods.
At this point, only limited training data is used. Therefore further tests and training with a more extensive dataset need to be done to investigate how well the results generalize.
Conclusion
We presented a DL informed fitting method for EPT reconstruction. This physics-based method improves the prediction of conventional fitting approaches by using DL to compute optimal weights for the fitting procedure.Acknowledgements
Thierry G. Meerbothe and Kyu-Jin Jung share first authorship, while Dong-Hyun Kim and Stefano Mandija share last authorship. S.M. received funding from Netherlands Organisation for Scientific Research (NWO), grant number: 18078.
K-J. J., C.C., J.Y., and D-H. K.: This research was supported by the MSIT(Ministry of Science and ICT), Korea, under the ITRC(Information Technology Research Center) support program(IITP-2020-2020-0-01461) supervised by the IITP(Institute for Information & communications Technology Planning & Evaluation)
References
[1] Leijsen, R., Brink, W., van den Berg, C., Webb, A., & Remis, R. (2021). Electrical properties tomography: A methodological review. Diagnostics, 11(2), 176.
[2] Mandija, S., Sbrizzi, A., Katscher, U., Luijten, P. R., & van den Berg, C. A. (2018). Error analysis of helmholtz‐based MR‐electrical properties tomography. Magnetic resonance in medicine, 80(1), 90-100.
[3] Karsa, A., & Shmueli, K. New Approaches for Simultaneous Noise Suppression and Edge Preservation to Achieve Accurate Quantitative Conductivity Mapping in Noisy Images. ISMRM 29th Annual Meeting, 15-20 May 2021
[4] Mandija, S., Meliadò, E. F., Huttinga, N. R., Luijten, P. R., & van den Berg, C. A. (2019). Opening a new window on MR-based electrical properties tomography with deep learning. Scientific reports, 9(1), 1-9.
[5] Jung, K. J., Mandija, S., Kim, J. H., Cui, C., Choi, S., Yi, J., ... & Kim, D. H. Feasibility study for conductivity reconstructions from spin-echo images using artificial neural network with simulation data in 3T MR system. ISMRM 30th Annual Meeting, 7-12 May 2022
[6] Hampe, N., Katscher, U., Van den Berg, C. A., Tha, K. K., & Mandija, S. (2020). Investigating the challenges and generalizability of deep learning brain conductivity mapping. Physics in Medicine & Biology, 65(13), 135001.
[7] Katscher, U., Djamshidi, K., Voigt, T., Ivancevic, M., Abe, H., Newstead, G., & Keupp, J.. Estimation of Breast Tumor Conductivity Using Parabolic Phase Fitting. ISMRM 2012: 3482.
[8] Lee J, et al. MR‐based conductivity imaging using multiple receiver coils. Magnetic Resonance in Medicine, 2016;76(2):530-539.
Figures