1046
Fast Submillimeter QSM for Simultaneous QSM/MRSI of the Brain at 7T1Siemens Medical Solutions USA, Inc., Urbana, IL, United States, 2Beckman Institute for Advanced Science and Technology, University of Illinois at Urbana-Champaign, Urbana, IL, United States, 3National Center for Supercomputing Applications, University of Illinois at Urbana-Champaign, Urbana, IL, United States, 4Department of Electrical and Computer Engineering, University of Illinois at Urbana-Champaign, Urbana, IL, United States, 5Imaging Institute, Cleveland Clinic, Cleveland, OH, United States, 6School of Biomedical Engineering, Shanghai Jiao Tong University, Shanghai, China, 7Department of Bioengineering, University of Illinois at Urbana-Champaign, Urbana, IL, United States, 8Carle Illinois College of Medicine, University of Illinois at Urbana-Champaign, Urbana, IL, United States
Synopsis
Keywords: Susceptibility, Quantitative Susceptibility mapping
The feasibility of simultaneous QSM and MRSI has been recently demonstrated using SPICE. But the resolution of QSM obtained by SPICE at 7T is limited to only 3 mm due to bandwidth requirements. To overcome the resolution limitation, this work proposes a fast acquisition sequence for high-resolution encoding, and a model-based method to reconstruct from sparse sampling. As a result, submillimeter QSM can be achieved within only 1 minute, which enables simultaneous QSM (at 0.8 mm) and MRSI (at 3.0 mm) in an 8-minute scan at 7T.Introduction
QSM and MRSI can provide complementary information of the brain1,2 and the SPICE technique provides a unique imaging platform for simultaneous QSM and MRSI at 3T.3,4 Recently, SPICE has been implemented at 7T to utilize the SNR benefits brought by ultrahigh field to enhance the imaging capability of MRSI. However, using the same acquisition strategy as 3T, SPICE at 7T can only provide a QSM with a resolution of 3.0 mm in readout direction due to the bandwidth limitation.5 This resolution is much lower than typical QSM (usually higher than 1 mm), thus suffering from strong partial volume effects. This work proposes a fast acquisition sequence to break the readout limitation of original SPICE method at 7T and achieve QSM at isotropic 0.8 mm resolution within only one additional minute. A reconstruction method integrating generalized-series (GS) modeling, parallel imaging, and field modeling is developed to solve the sparse sampling issue. As a result, the proposed method can provide simultaneous QSM (at 0.8 mm) and metabolite maps (at 3.0 mm) in 8 minutes at 7T.Methods
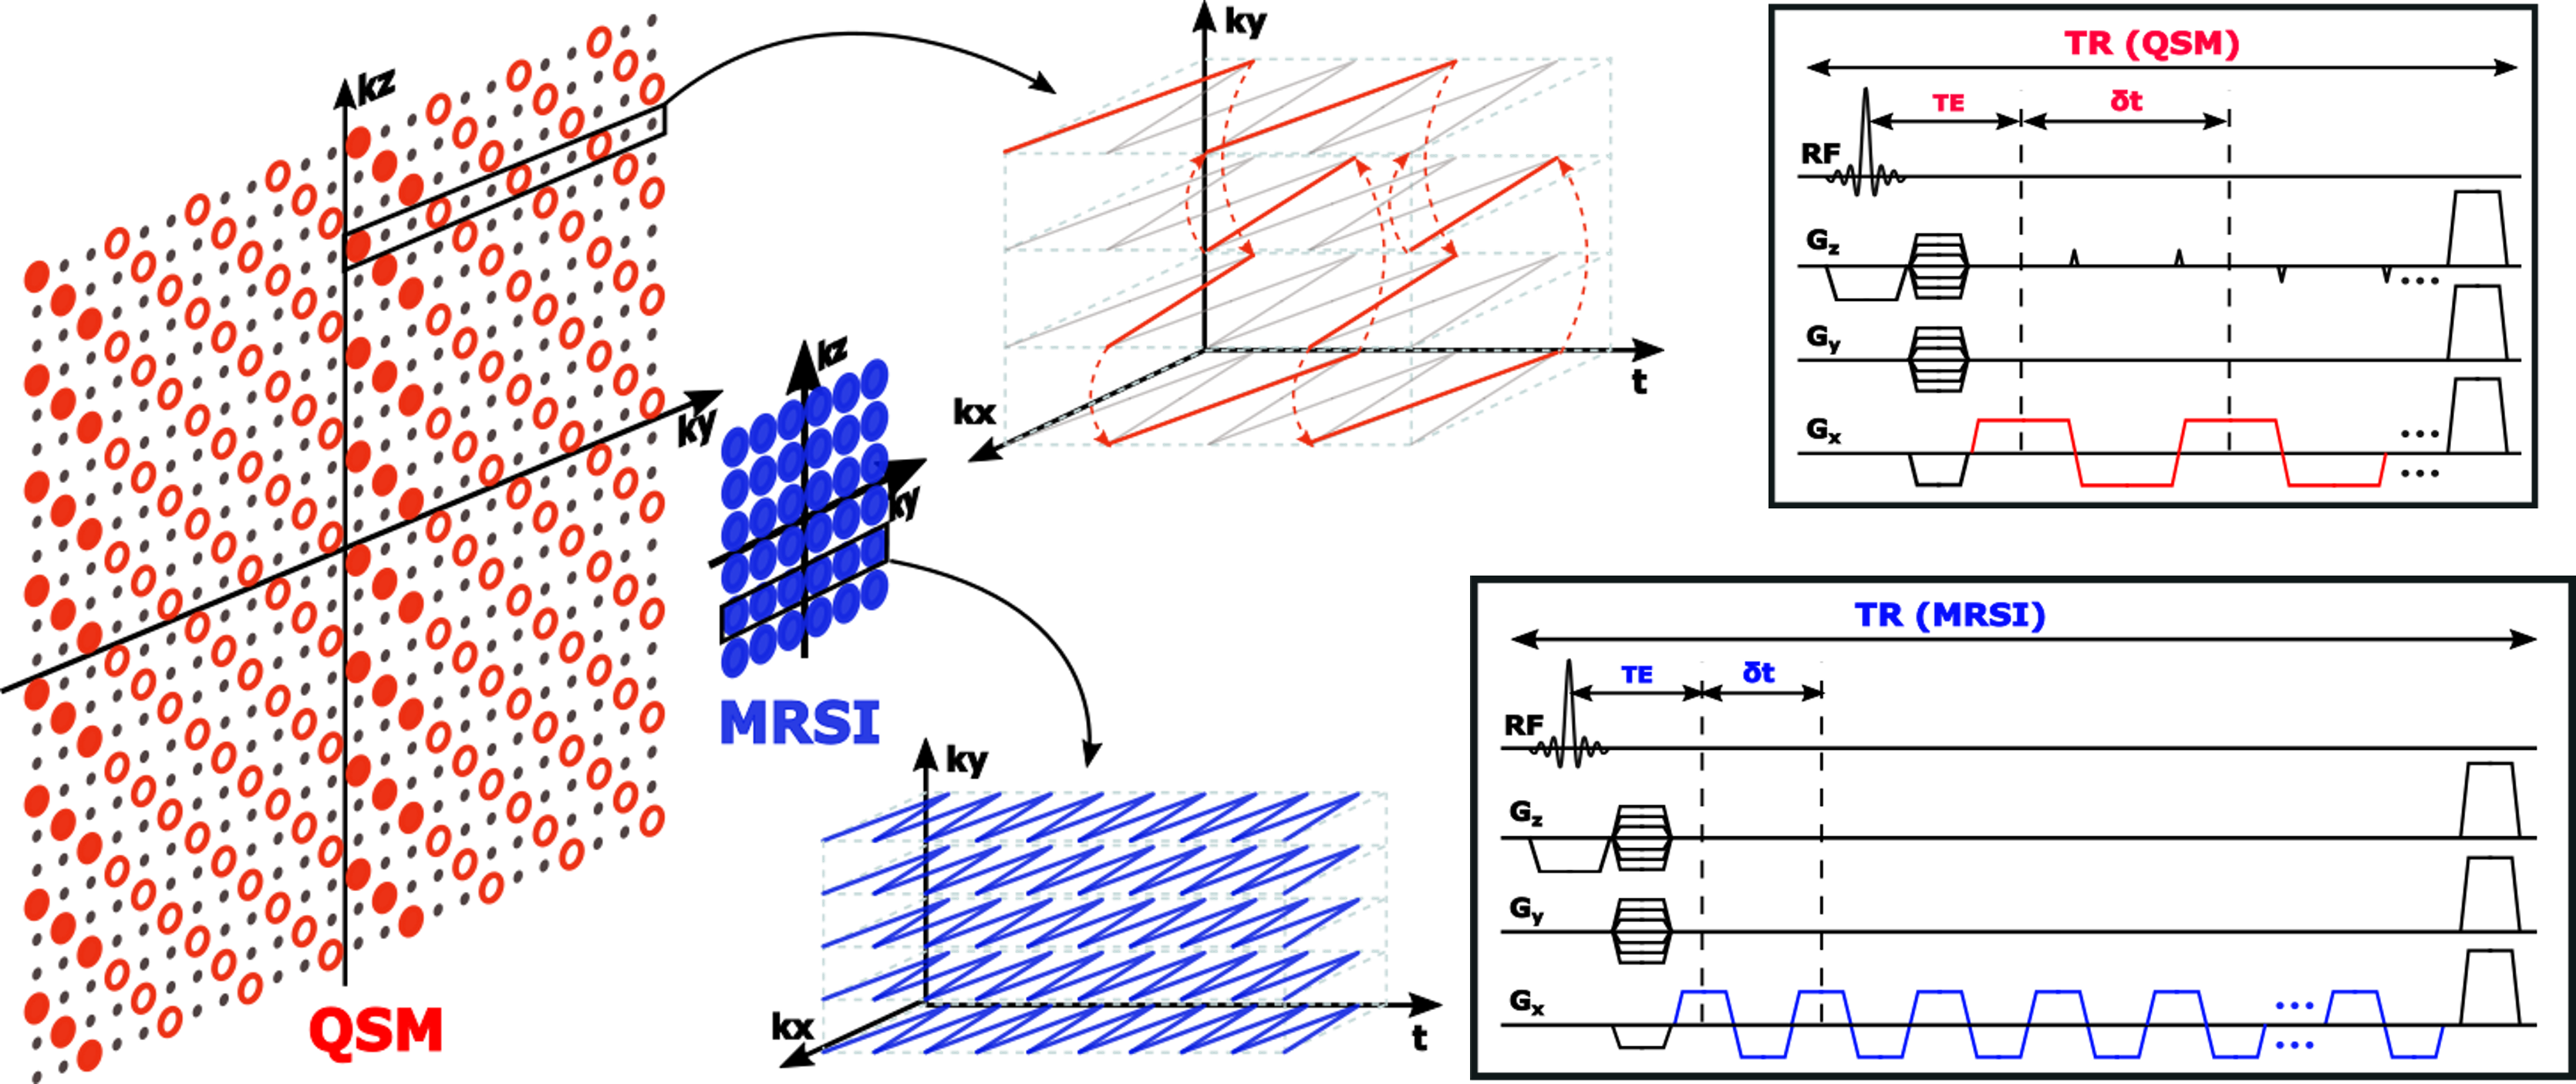
Data Acquisition:Figure 1 shows the proposed acquisition scheme for simultaneous MRSI and QSM at 7T. The MRSI acquisition keeps the basic features of SPICE sequence, including (a) no-water-suppression, (b) FID-based acquisition, (c) ultrashort TE (1.6 ms), (d) short TR (160 ms), and (e) EPSI trajectories.4 To satisfy the bandwidth requirement for spectroscopic signals at 7T, the readout resolution of the SPICE sequence is only 3.0 mm.5 The proposed QSM acquisition is built on SPICE sequence but developed with several unique features to overcome this limitation, including (a) longer readout for high resolution (0.8 mm), (b) shorter TR (62 ms) for fast acquisition, and (c) sparse sampling of (k, t)-space using spatiotemporal CAIPIRINHA trajectories.6 More specifically, the MRSI acquisition covers the central k-space densely for 3.0 mm resolution, while the QSM acquisition covers much larger k-space sparsely for 0.8 mm resolution, with an effective acceleration factor of 30. As a result, the scan time for QSM acquisition is only 1 minute and for MRSI acquisition is 7 minutes, in total as 8 minutes for both (FOV: 240×240×72 mm3).
Image Reconstruction:
To overcome the sparse sampling in QSM acquisition, we propose a model-based reconstruction method which effectively utilizes the water signals in MRSI acquisition. Given the acquisition sequence, the differences between the water signals in QSM acquisition and MRSI acquisition are only resolution and T1 weighting. Therefore, the relationship between the MRSI signals ($$$\rho_r(x,t)$$$) and QSM signals ($$$\rho_g(x,t)$$$) can be expressed using a low-order GS model:7
$$\rho_g(\textbf{x},t)=\rho_r(\textbf{x},t)\sum_{n=-N/2}^{N/2}c_n(\textbf{x})e^{i2{\pi}nt/ΔT}$$
where $$$N$$$ denotes the model order, $$$c_n(\textbf{x})$$$ the GS coefficients capturing the variations on signal intensities caused by resolution and T1 weighting. The reconstruction from sparse data (denoted as $$$d$$$) can be done by solving the optimization problem:
$$ \hat{c}=\arg\min_{c}{\parallel}d-{\Omega}FS(G(\rho_r)c){\parallel}_2^2+R(c)$$
where $$$c$$$ and $$$\rho_r$$$ are the vector forms of $$${c_n(\textbf{x})}$$$ and $$$\rho_r(x,t)$$$, $$$\Omega,F,S,G,R$$$ are operators representing k-space sampling, Fourier transform, coil sensitivity, GS modeling and regularization, respectively. Then, the reconstructed signal can be generated via $$$\hat{\rho}_g=G(ρ_r)\hat{c}$$$.
However, since $$$\rho_r$$$ is in only low-resolution, the field variation caused by resolution cannot be well captured in $$$\hat{\rho}_g$$$. Therefore, another field-adjustment model is proposed to represent the signal with high-resolution field ($$$\rho_q(x,t)$$$) using $$$\hat{\rho}_g(x,t)$$$:
$$\rho_q(\textbf{x},t)=\hat{\rho}_g(x,t)e^{i2{\pi}{\Delta}f(\textbf{x})t}{\sim}\hat{\rho}_g(\textbf{x},t)(1+i2\pi{\Delta}f(\textbf{x})t)$$
$$${\Delta}f(\textbf{x})$$$ is the field difference between the low-resolution and high-resolution signals, which is expected to be small, so the model can be formulated into its linear approximation. Then the reconstruction can be implemented by:
$${\Delta}\hat{f}=\arg\min_{{\Delta}f}{\parallel}d-ΩFS(\hat{\rho}_g(1+i2{\pi}{\Delta}ft))\parallel_2^2$$
With $$${\Delta}\hat{f}$$$ determined, the reconstructed signals can be generated via $$$\rho_q=\hat{\rho}_ge^{i2{\pi}{\Delta}\hat{f}(x)t}$$$. After that, the calculation of QSM follows the typical QSM pipeline,1 and the generation of metabolite maps from MRSI signals follows the existing SPICE methods.8-11
Results
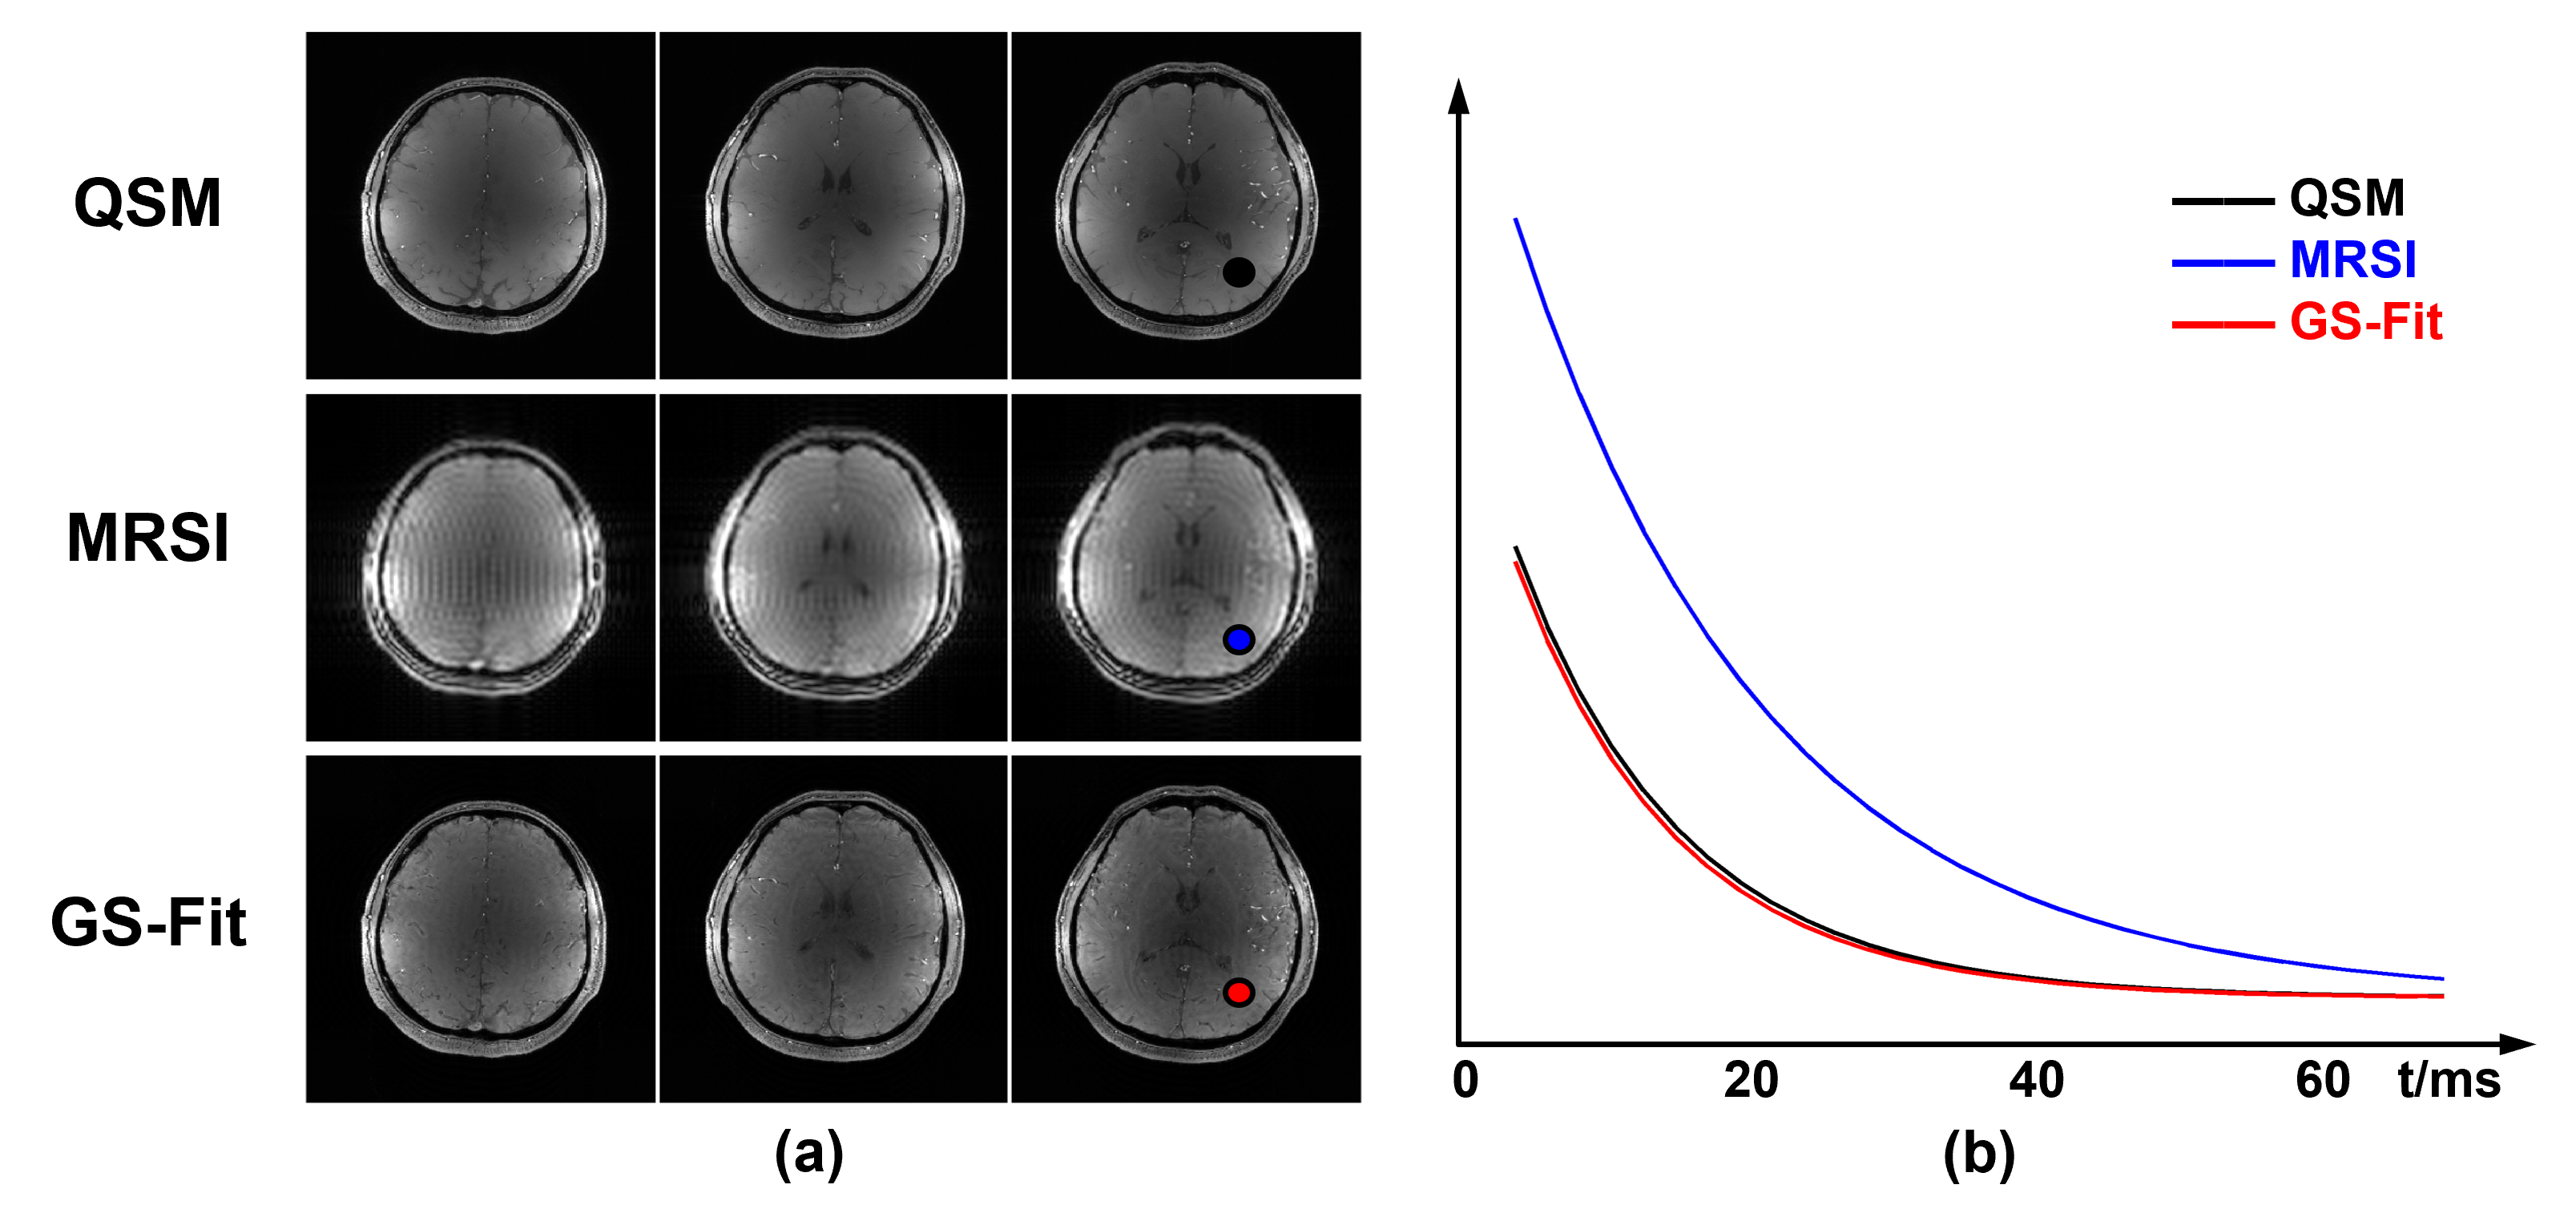
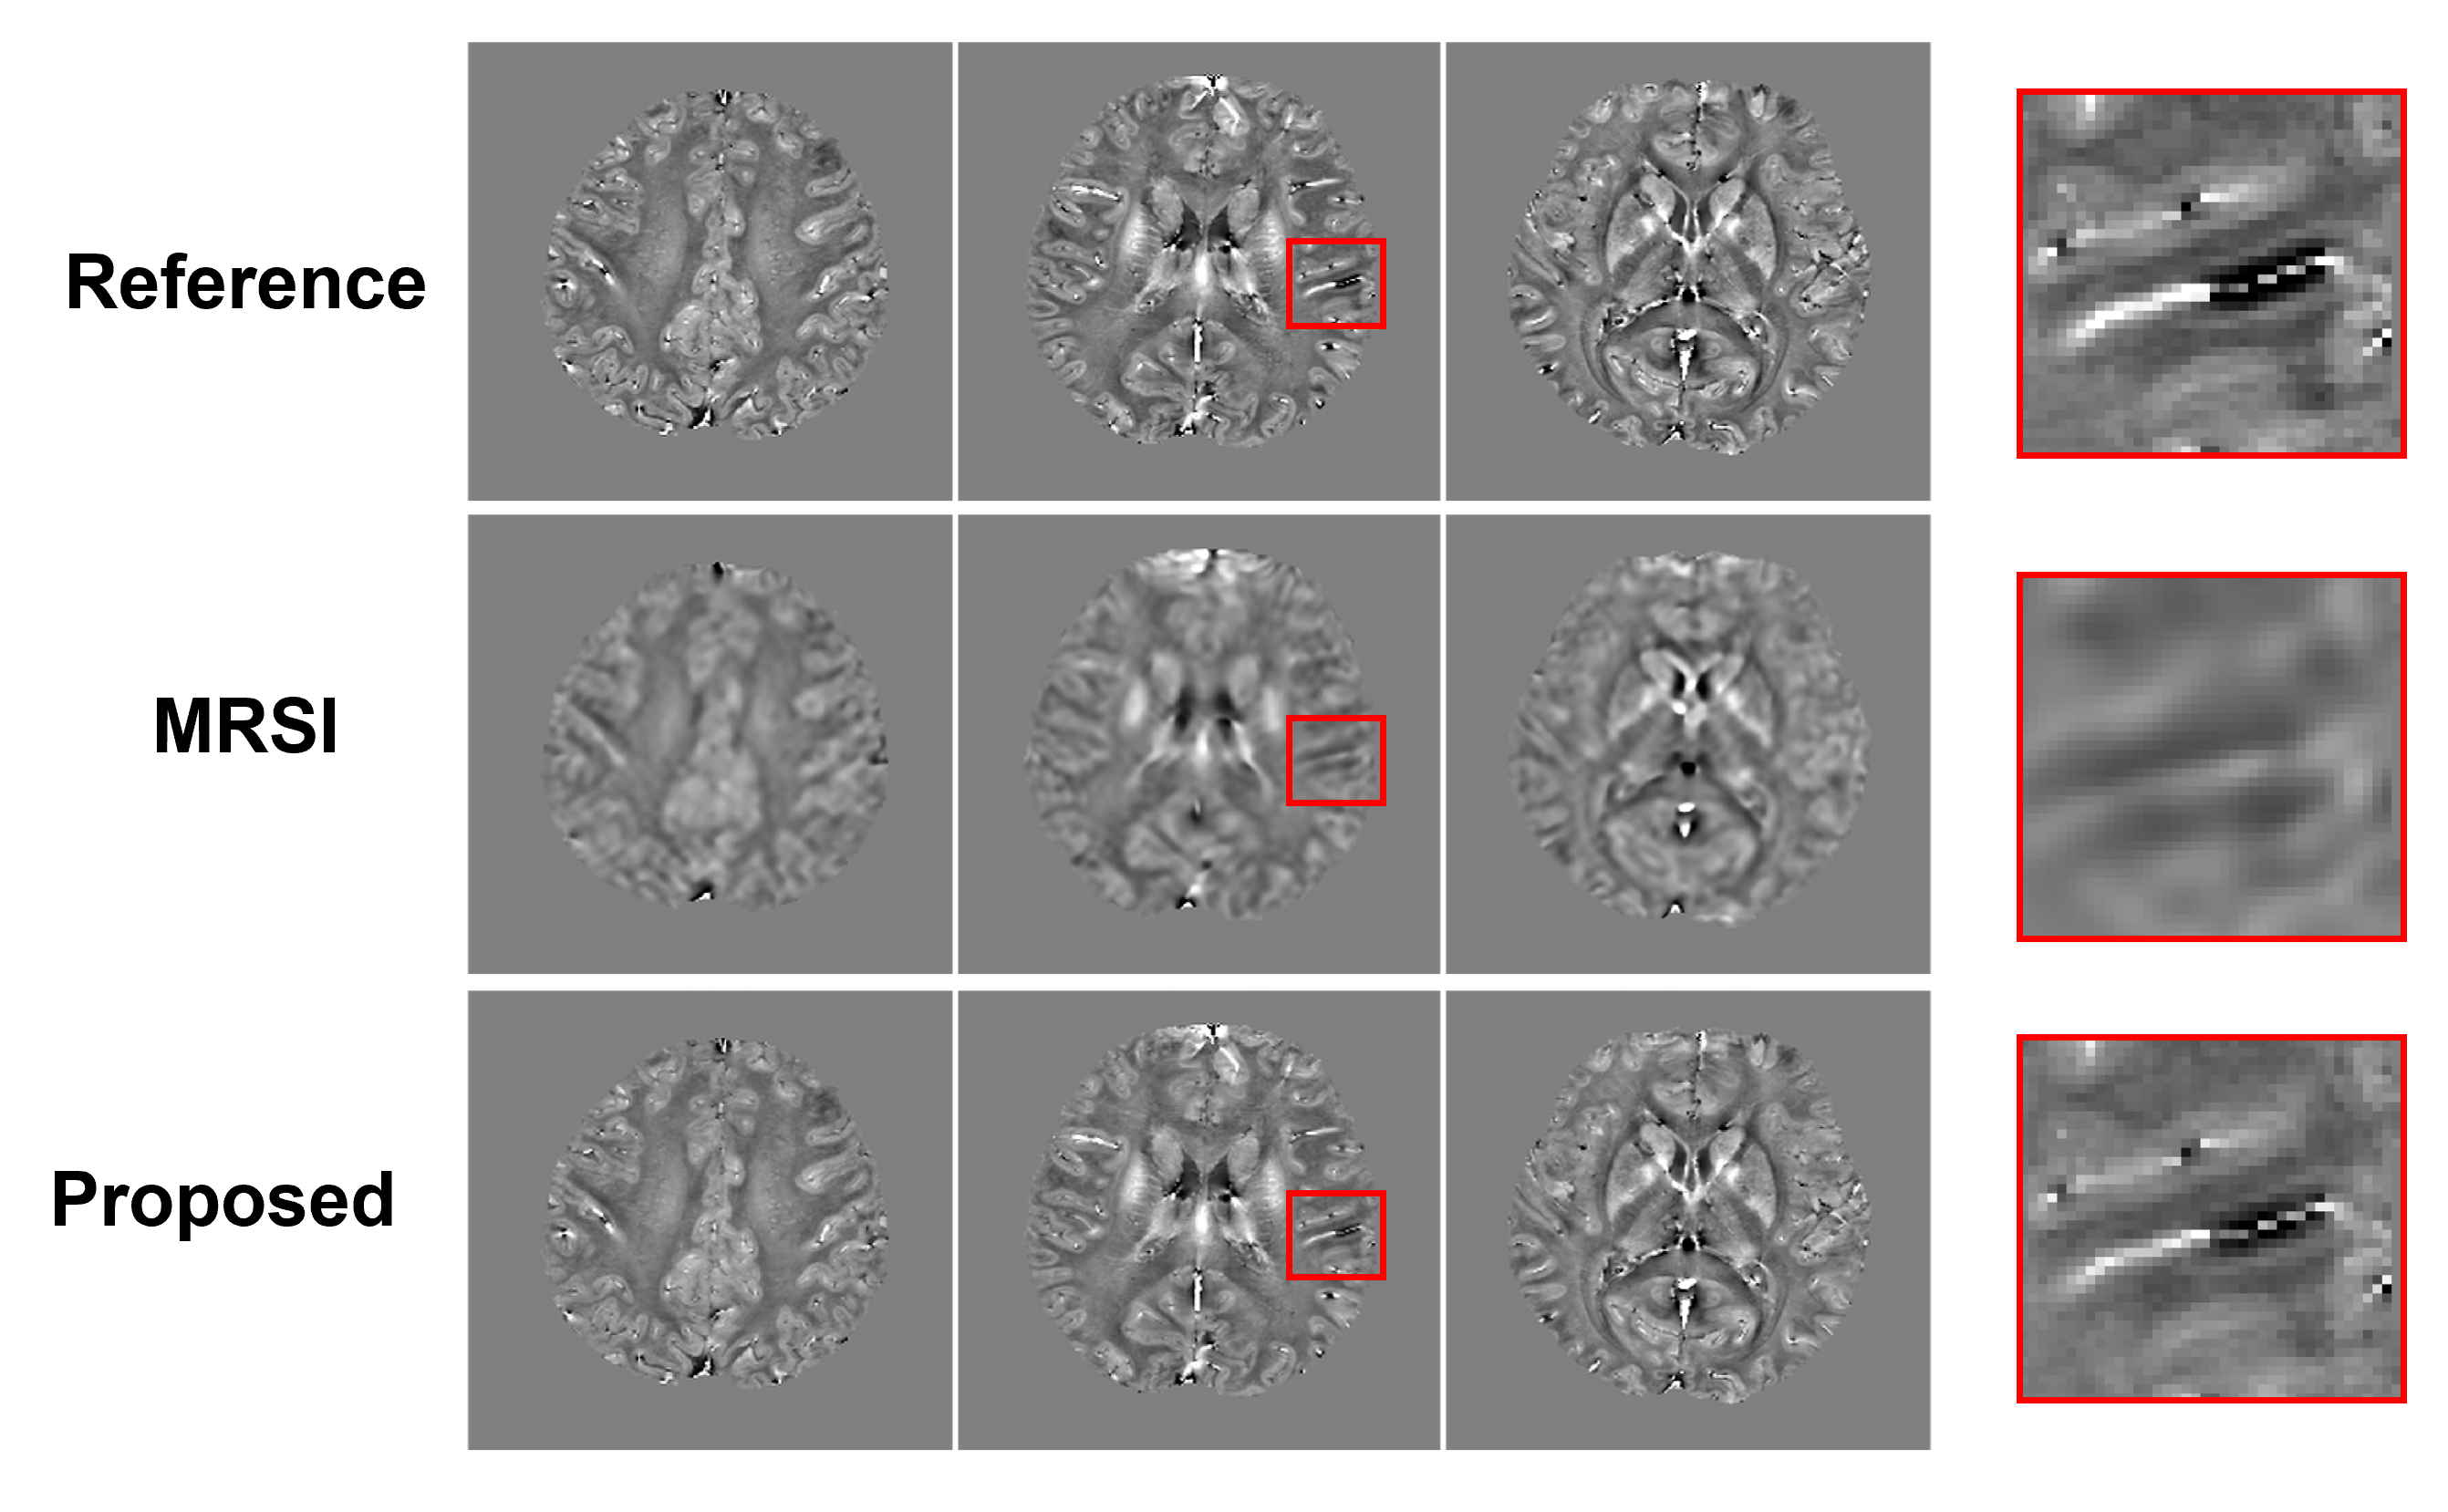
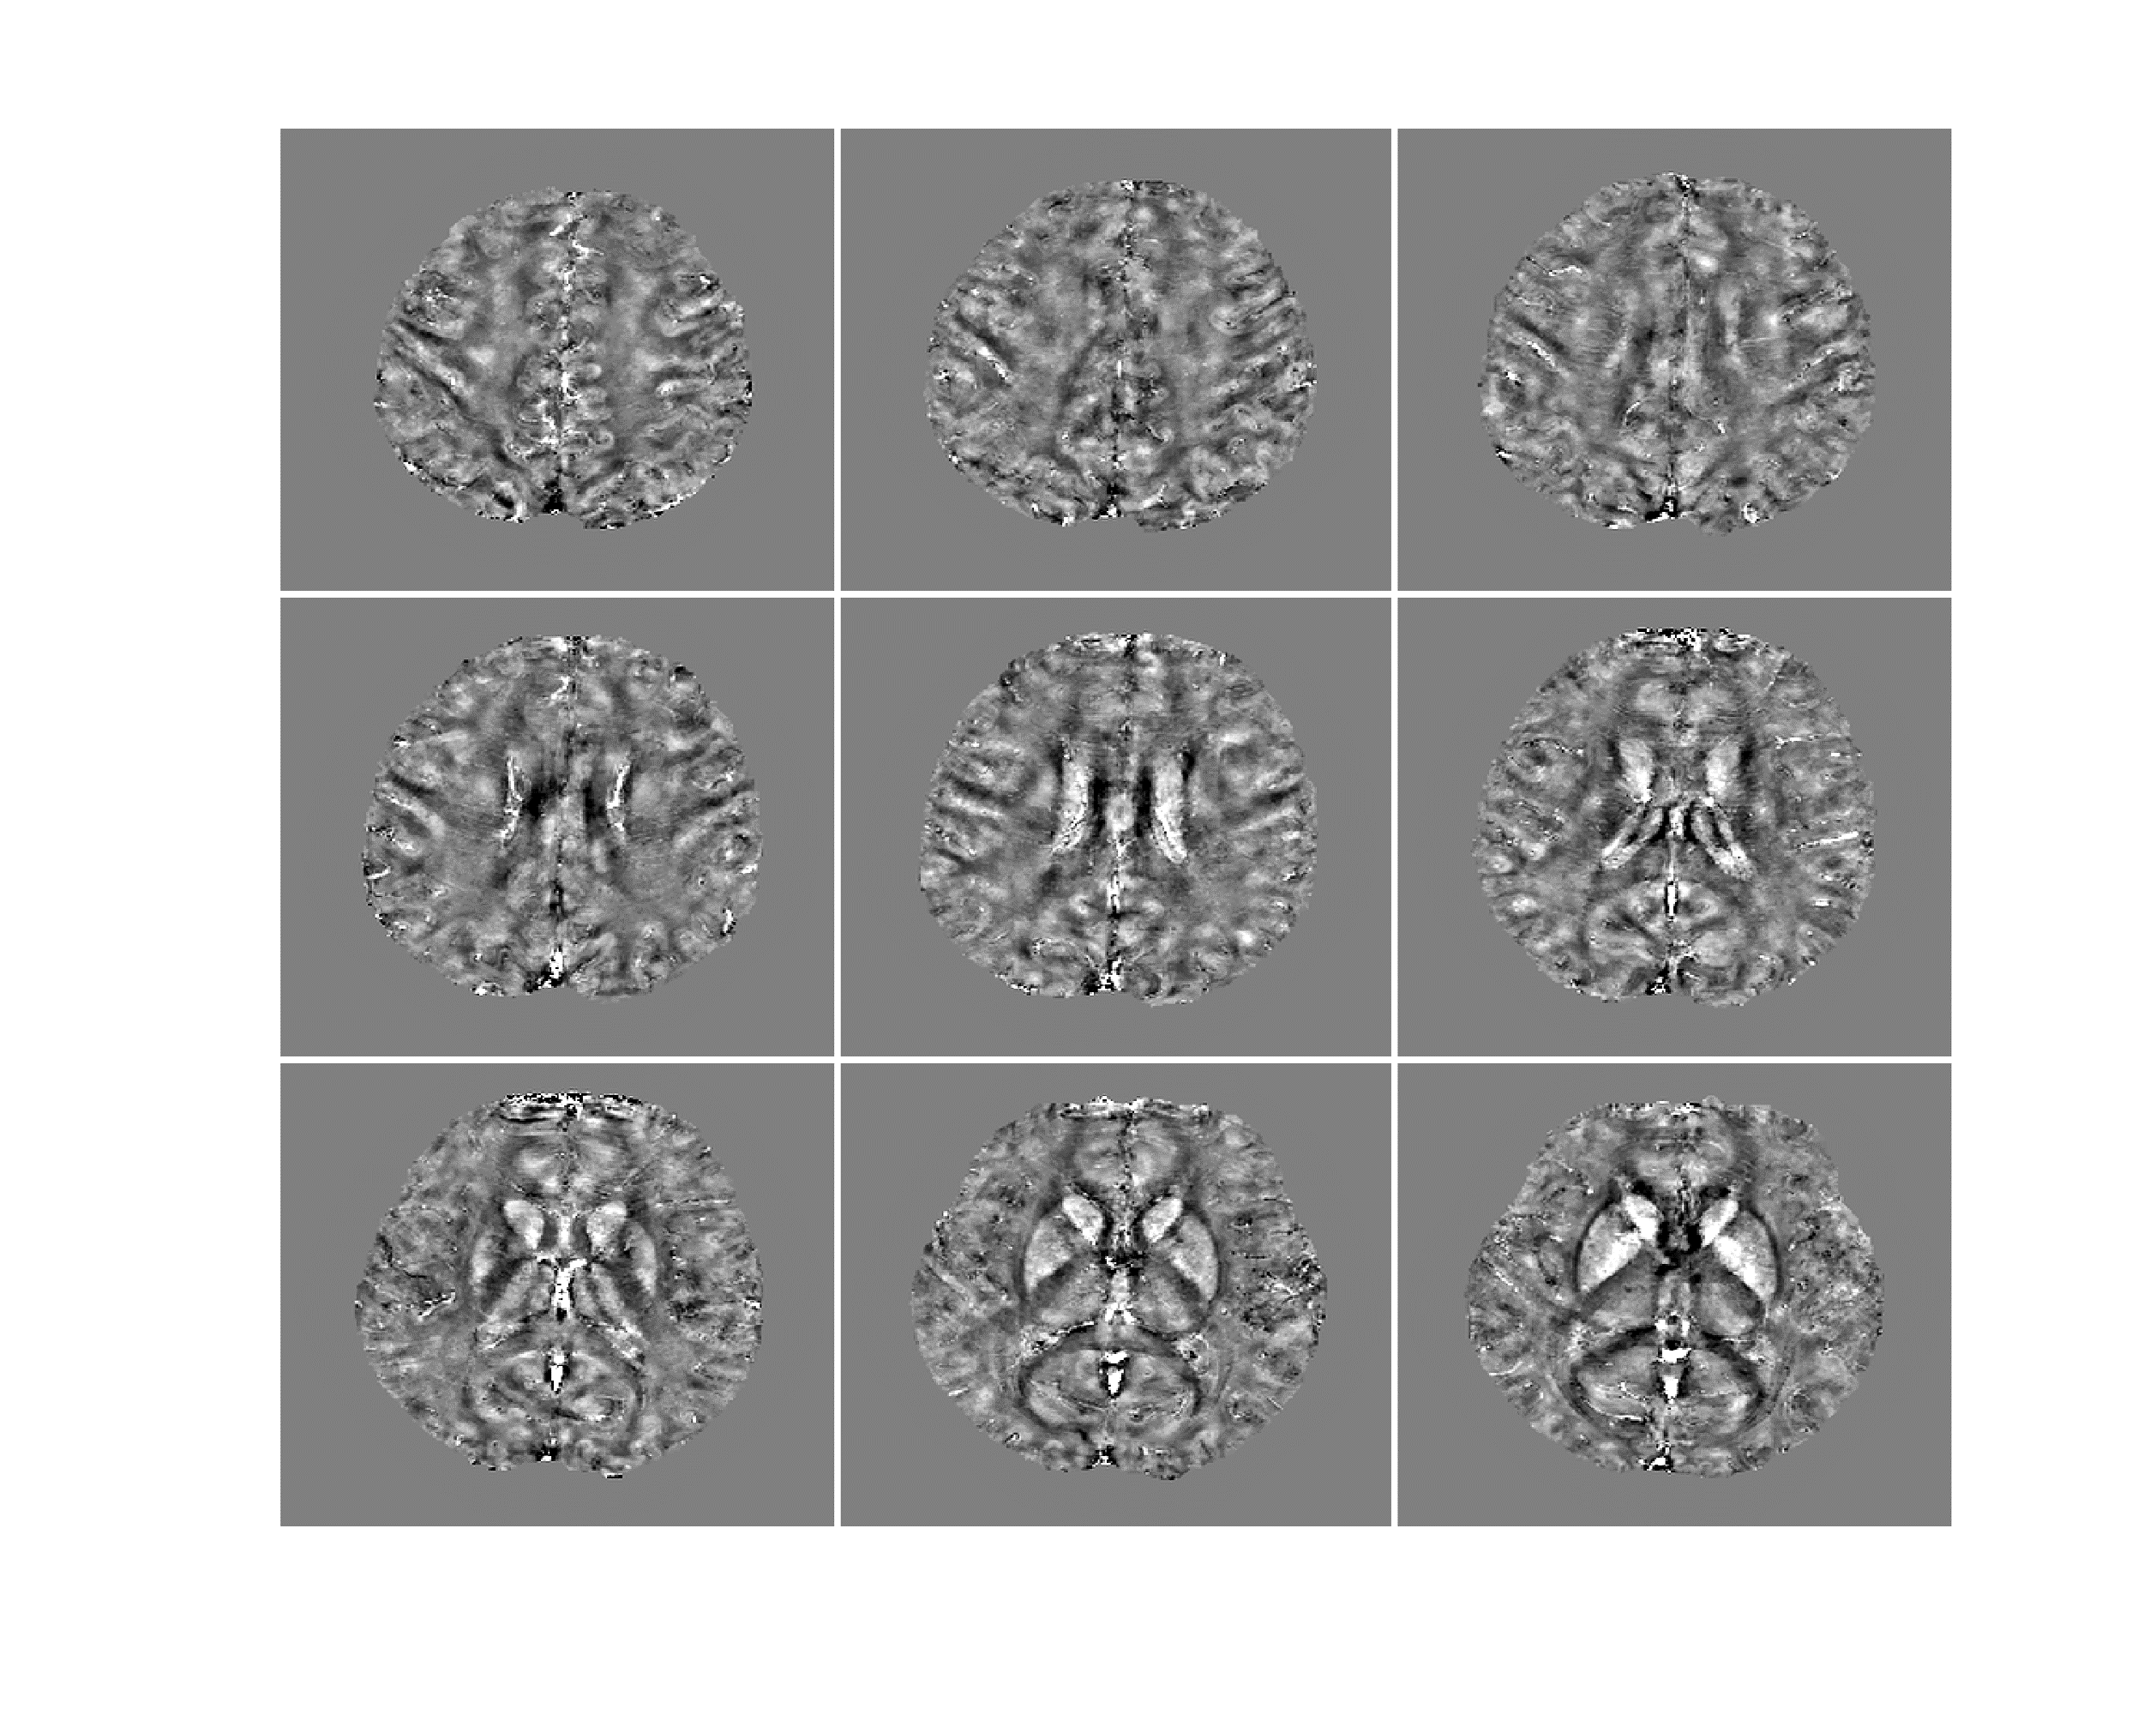
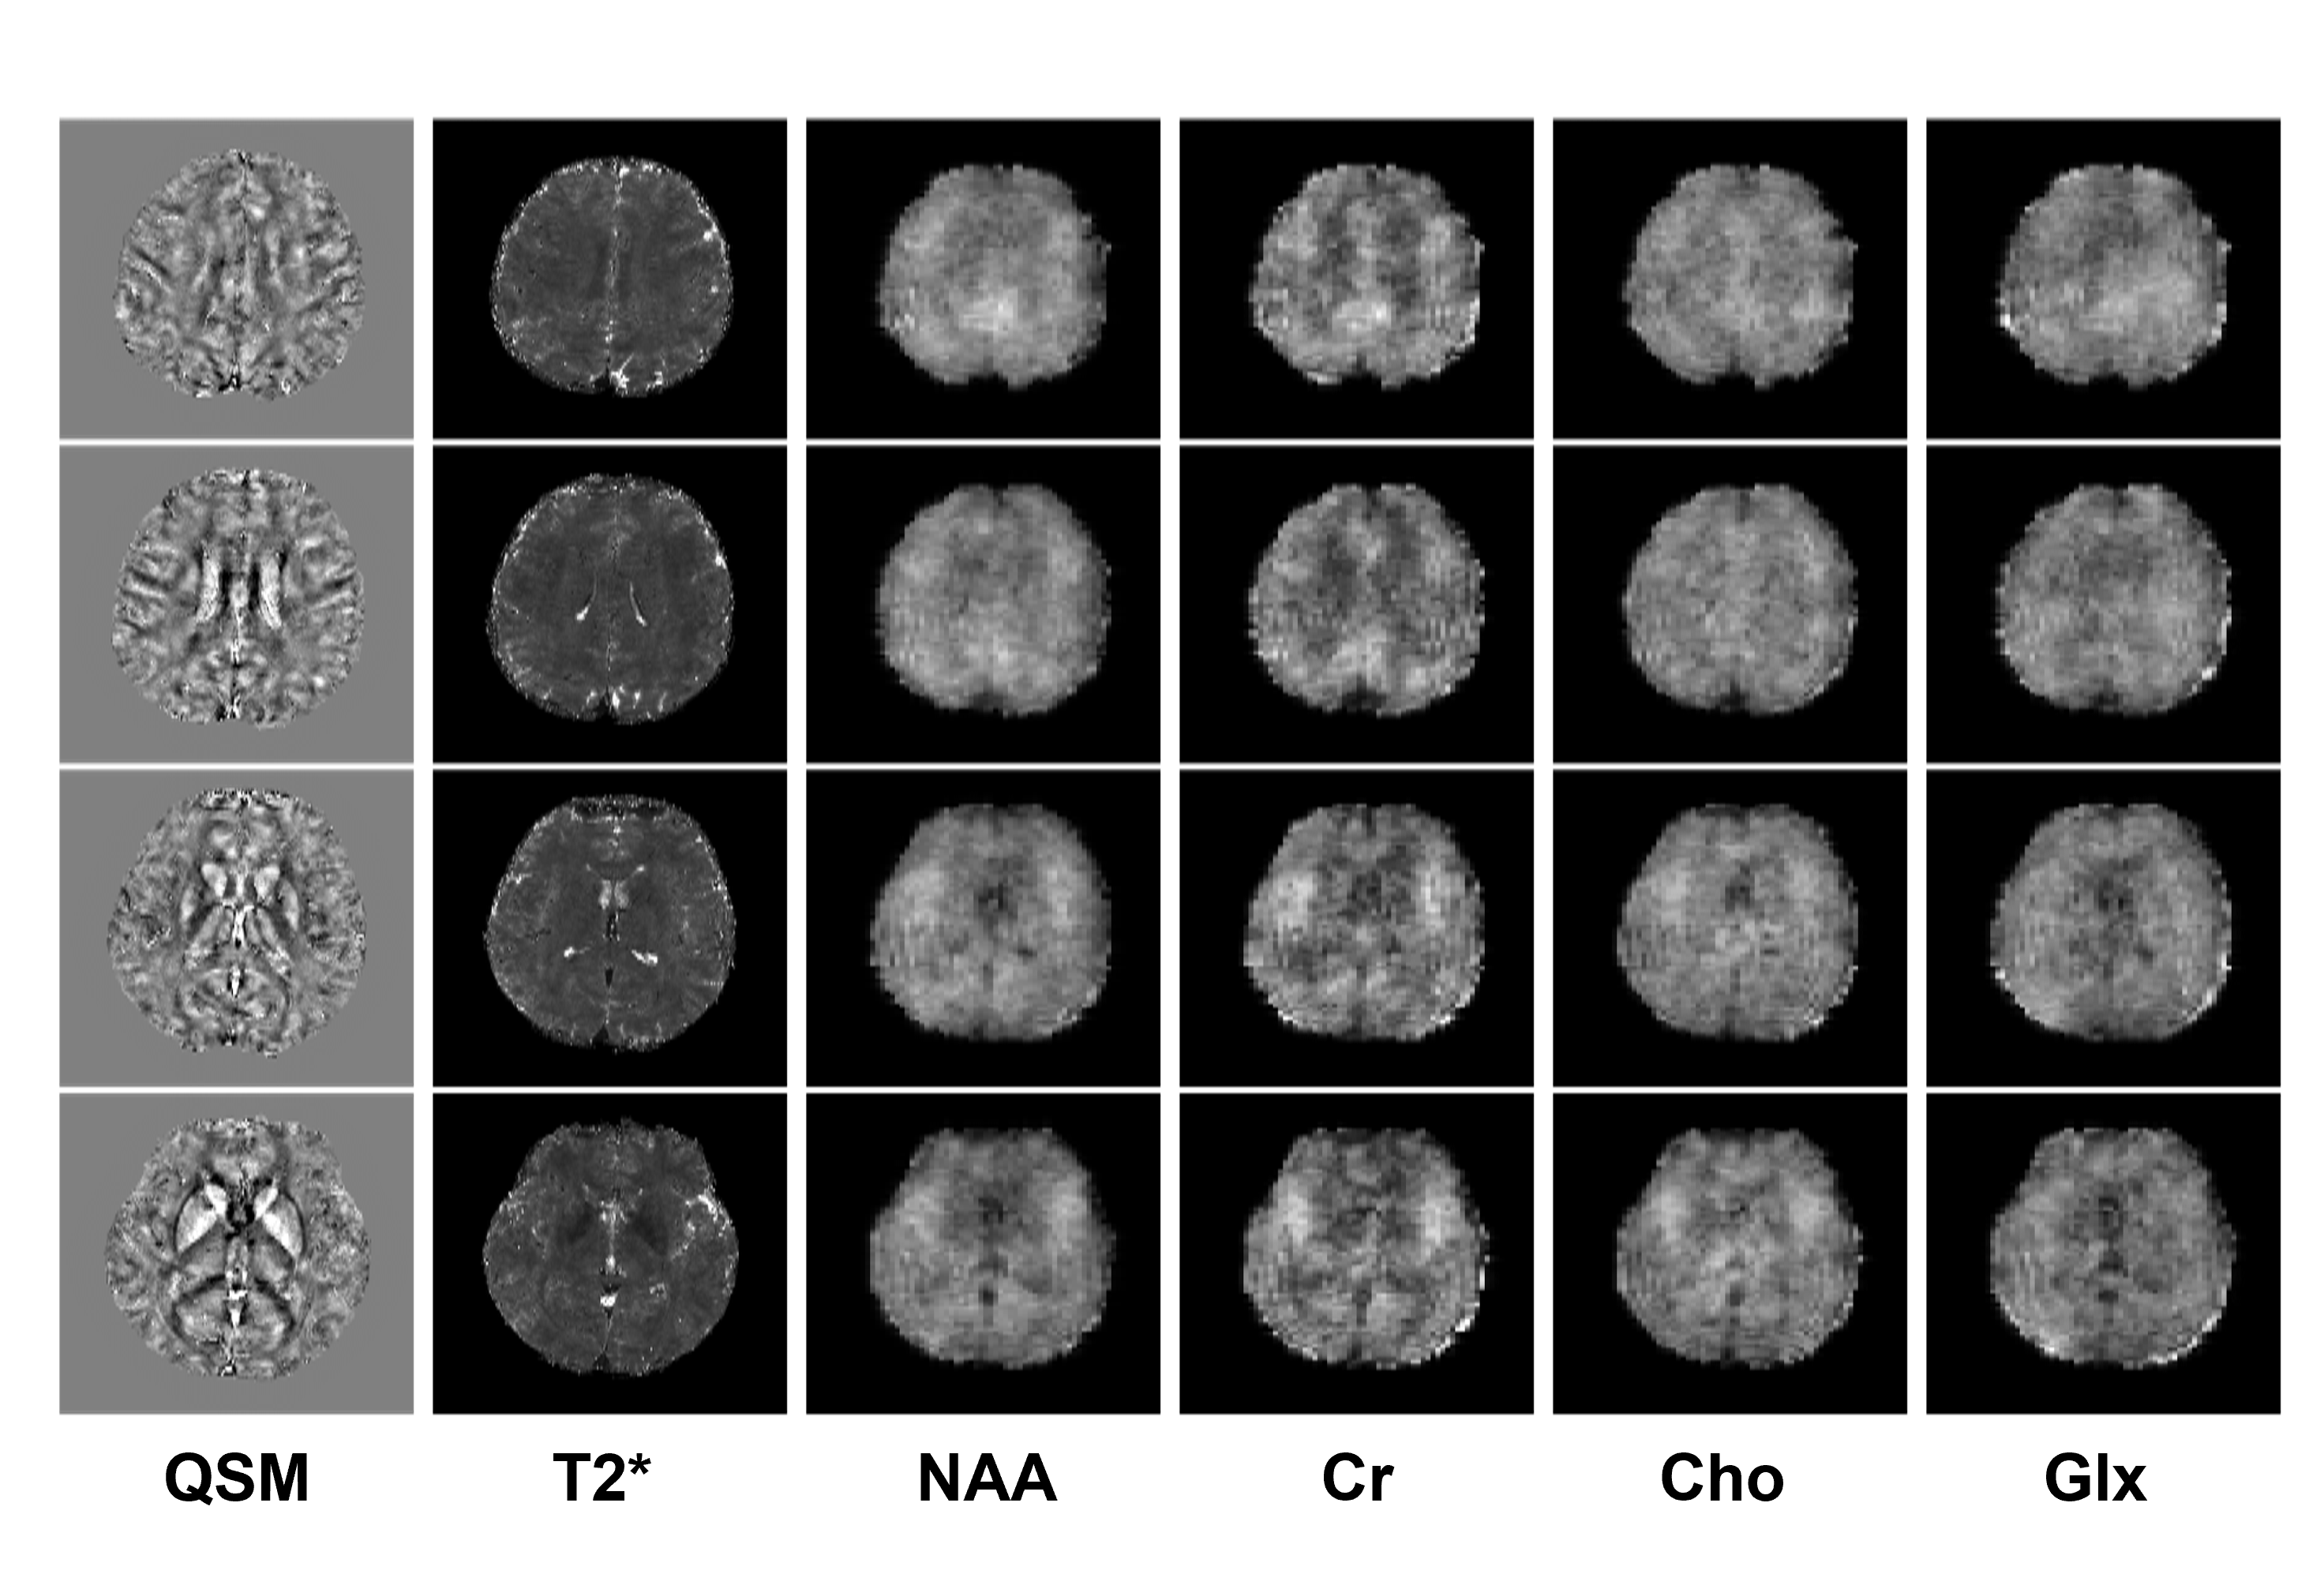
To demonstrate the feasibility of the proposed method, in vivo experiments were carried out on healthy volunteers on a 7T system (MAGNETOM Terra, Siemens Healthcare, Erlangen, Germany). Besides the proposed acquisition sequence, one QSM acquisition with only parallel imaging (0.8 mm, R = 3, 15 minutes) was acquired as reference. Figure 2 shows an illustration of the GS modeling in capturing the differences between the QSM signals and MRSI signals. As we can see, the variations on signal intensities caused by resolution and T1 weighting were significantly reduced after fitting to the GS model. Figure 3 displays the tissue field maps (after removal of the background field) from the reference scan, MRSI acquisition, and the proposed method. Some fine details like vein structures were lost in the tissue field from MRSI signals but were captured very well in the proposed method. One set of representative high-resolution QSM maps is displayed in Figure 4, demonstrating high image quality from the 1-minute QSM acquisition. Figure 5 presents a complete set of results from the total 8-minute scan, including QSM and T2* maps at 0.8 mm resolution and metabolite maps (NAA, Cr, Cho, and Glx) at 3.0 mm resolution.Conclusion
The proposed method integrates a fast acquisition sequence and a model-based reconstruction method to achieve fast submillimeter QSM in simultaneous MRSI/QSM experiments at 7T. As a result, QSM at 0.8 mm resolution and metabolite maps at 3.0 mm resolution were successfully obtained in an 8-minute scan.Acknowledgements
No acknowledgement found.References
1. Wang Y, Tian L. Quantitative susceptibility mapping (QSM): Decoding MRI data for a tissue magnetic biomarker. Magn Reson Med. 2015;73(1):82-101.
2. Posse S, Otazo R, Dager S, et al. MR spectroscopic imaging: principles and recent advances. J Magn Reson Imaging. 2013;37(6):1301-1325.
3. Peng X, Lam F, Li Y, et al. Simultaneous QSM and metabolic imaging of the brain using SPICE. Magn Reson Med. 2018;79(4):13-21.
4. Guo R, Zhao Y, Li Y, et al. Simultaneous QSM and metabolic imaging of the brain using SPICE: Further improvements in data acquisition and processing. Magn Reson Med. 2021;85(2):970-977.
5. Guo R, Zhao Y, Li Y, et al. Fast high-resolution 1H-MRSI of the human brain at 7T. Proc. Intl. Soc. Magn. Reson. Med. 2021;1354.
6. Breuer FA, Blaimer M, Mueller MF, et al. Controlled aliasing in volumetric parallel imaging (2D CAIPIRINHA). Magn Reson Med. 2006;55(3):549-556.
7. Liang ZP, Lauterbur PC. A Generalized Series Approach to MR Spectroscopic Imaging. IEEE Trans Med Imaging. 1991;10(2):132-137.
8. Lam F, Ma C, Clifford B, Johnson CL, Liang ZP. High-resolution 1H-MRSI of the brain using SPICE: Data acquisition and image reconstruction. Magn Reson Med. 2016;76(4):1059-1070.
9. Ma C, Lam F, Johnson CL, et al. Removal of nuisance signals from limited and sparse 1H MRSI data using a union‐of‐subspaces model. Magn Reson Med. 2016;75(2):488-497.
10. Li Y, Lam F, Clifford B, et al. A subspace approach to spectral quantification for MR spectroscopic imaging. IEEE Trans Biomed Eng. 2017;64(10):2486-2489.
11. Lam F, Li Y, Guo R, et al. Ultrafast magnetic resonance spectroscopic imaging using SPICE with learned subspaces. Magn Reson Med. 2020;83(2):377-390.
Figures