1045
In-vivo delineation of fine structures in the human brain using high resolution deep learning-powered chi-separation1Department of Electrical Computer Engineering, Seoul National University, Seoul, Korea, Republic of, 2Department of Radiology, Johns Hopkins University School of Medicine, Baltimore, MD, United States, 3F.M. Kirby Research Center for Functional Brain Imaging, Kennedy Krieger Institute, Baltimore, MD, United States
Synopsis
Keywords: Susceptibility, Data Processing
Fine structures in the human brain are delineated in the positive and negative susceptibility maps reconstructed in less than 25 min of scan time. The reconstruction pipeline consists of four deep learning networks, each of which performs multi-echo denoising, QSM reconstruction, χ-separation, and super-resolution. The reconstructed maps delineate two laminar structures within globus pallidus, the fibers of internal capsule, and nigrosome structures in the substantia nigra.Introduction
$$$\chi$$$-separation,1 a method to separate positive and negative susceptibility sources, demonstrated exquisite anatomical details in ex-vivo brain, suggesting a path toward in-vivo histology.2 However, the need for multiple orientation data for high quality reconstruction, and long scan time for high SNR along with high resolution limits the in-vivo application. In this work, we delineated fine structures in positive ($$$\chi_{pos}$$$) and negative ($$$\chi_{neg}$$$) susceptibility maps in human brain in vivo by cascading four deep-learning networks. The results display the laminar structures in globus pallidus,3 the fibers of internal capsule, and nigrosome structures in the substantia nigra in less than 25 min of scan time.Methods
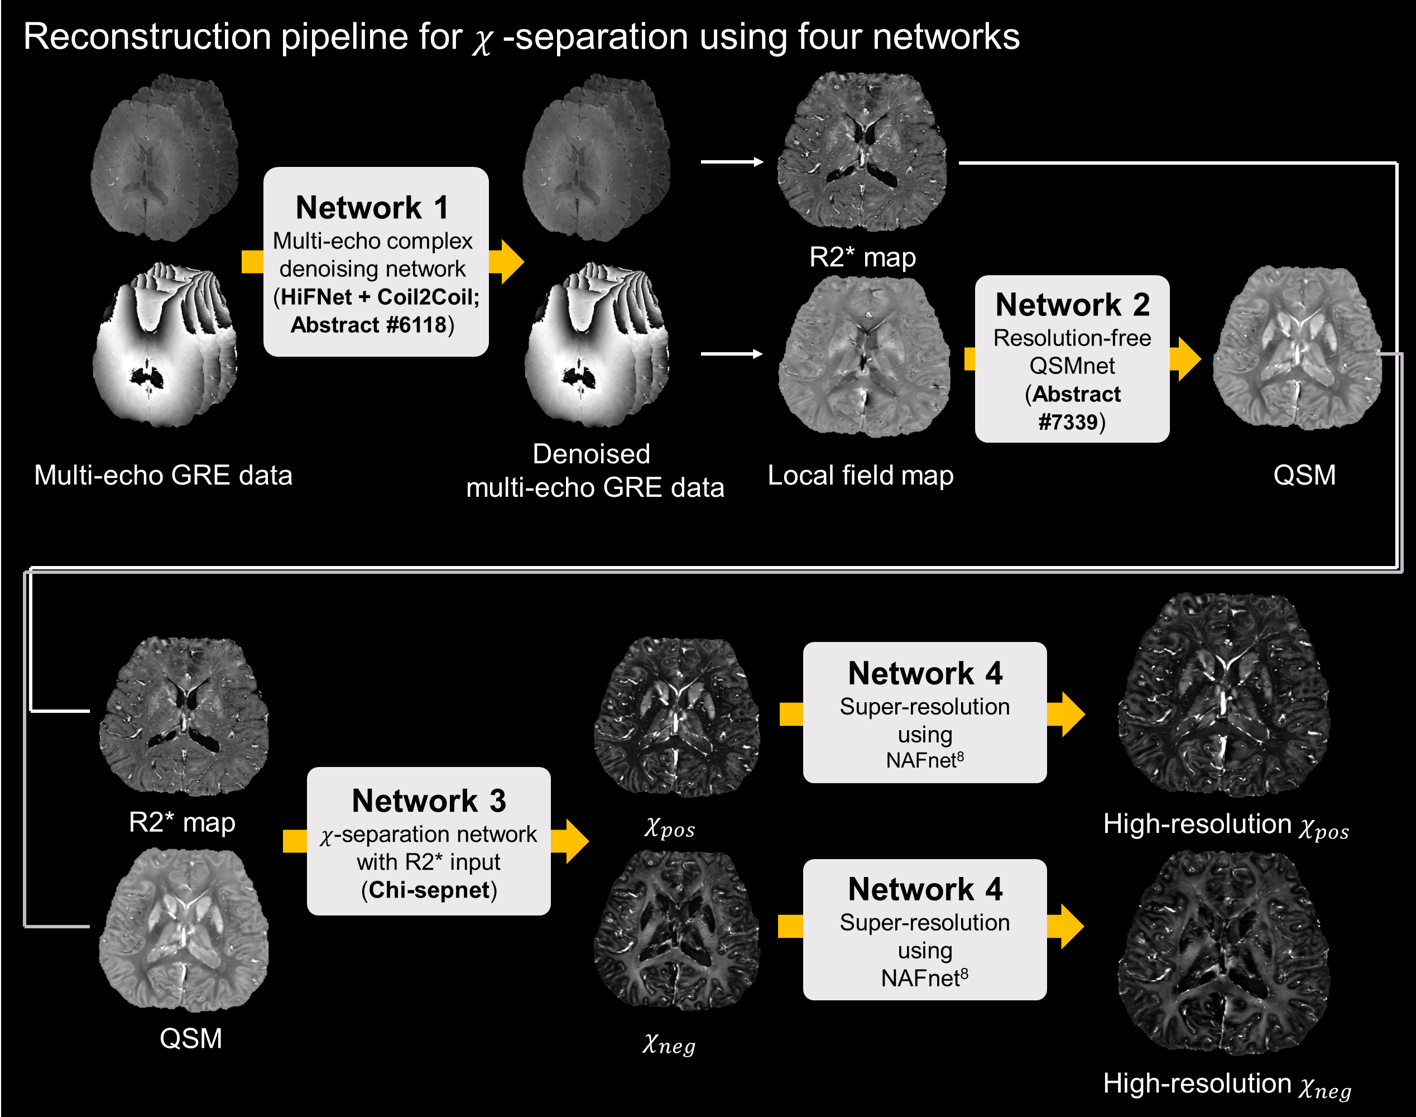
Data acquisition Two 3D multi-echo GRE data were acquired (IRB approved): one from a 7T scanner (Magnetom Terra, Siemens, Erlangen, Germany) and one from a 3T scanner (Tim Trio, Siemens, Erlangen, Germany). The scan parameters for the 7T scan were: TR = 38 ms, TE = 9.3:8.7:26.7 ms, FOV: 185×228×106 mm3, voxel size: 0.6×0.6×0.6 mm3, phase partial Fourier = 6/8, slice partial Fourier = 6/8, and acquisition time = 21 min 11 s. The scan parameters for the 3T scan were: TR = 40 ms, TE = 4.5:6.1:28.9 ms, FOV: 152×180×146 mm3, voxel size: 0.7×0.7×0.7 mm3, and acquisition time = 23 min 34 s.The reconstruction process consisted of four steps as depicted in Figure 1. Four networks were cascaded in order to reconstruct high-quality positive and negative susceptibility maps from the two multi-echo GRE data.
Multiecho denoising HiFNet (submitted; abstract #6118), a network for multi-echo GRE denoising, which shares network features hierarchically from first to last echo, was used. The network utilized Coil2Coil algorithm4 for training, a self-supervised denoising method that applied Noise2Noise5 by generating a pair of noisy images from phased-array coil images.
QSMnet QSMnet6 was trained at 1.0 mm3 isotropic resolution using the QSMnet dataset. A pipeline to reconstruct multiple resolution data using a QSM network trained at a single resolution (submitted; abstract #7339) was used to reconstruct QSM at the input data resolution.
Chi-sepnet Chi-sepnet,7 which produces multi-orientation quality chi-separation maps using single orientation GRE data, was modified to take only R2* and QSM as input to reduce the resolution dependency of the network. Other training details were same as the original Chi-sepnet.
Super-resolution NAFnet, a state-of-the-art network for super-resolution, was utilized.8 FastMRI dataset was utilized for training. For input, image resolution was reduced by a factor of 2×2 in the in-plane direction by cropping the k-space, and the corresponding full k-space image was used as label for training.
Results
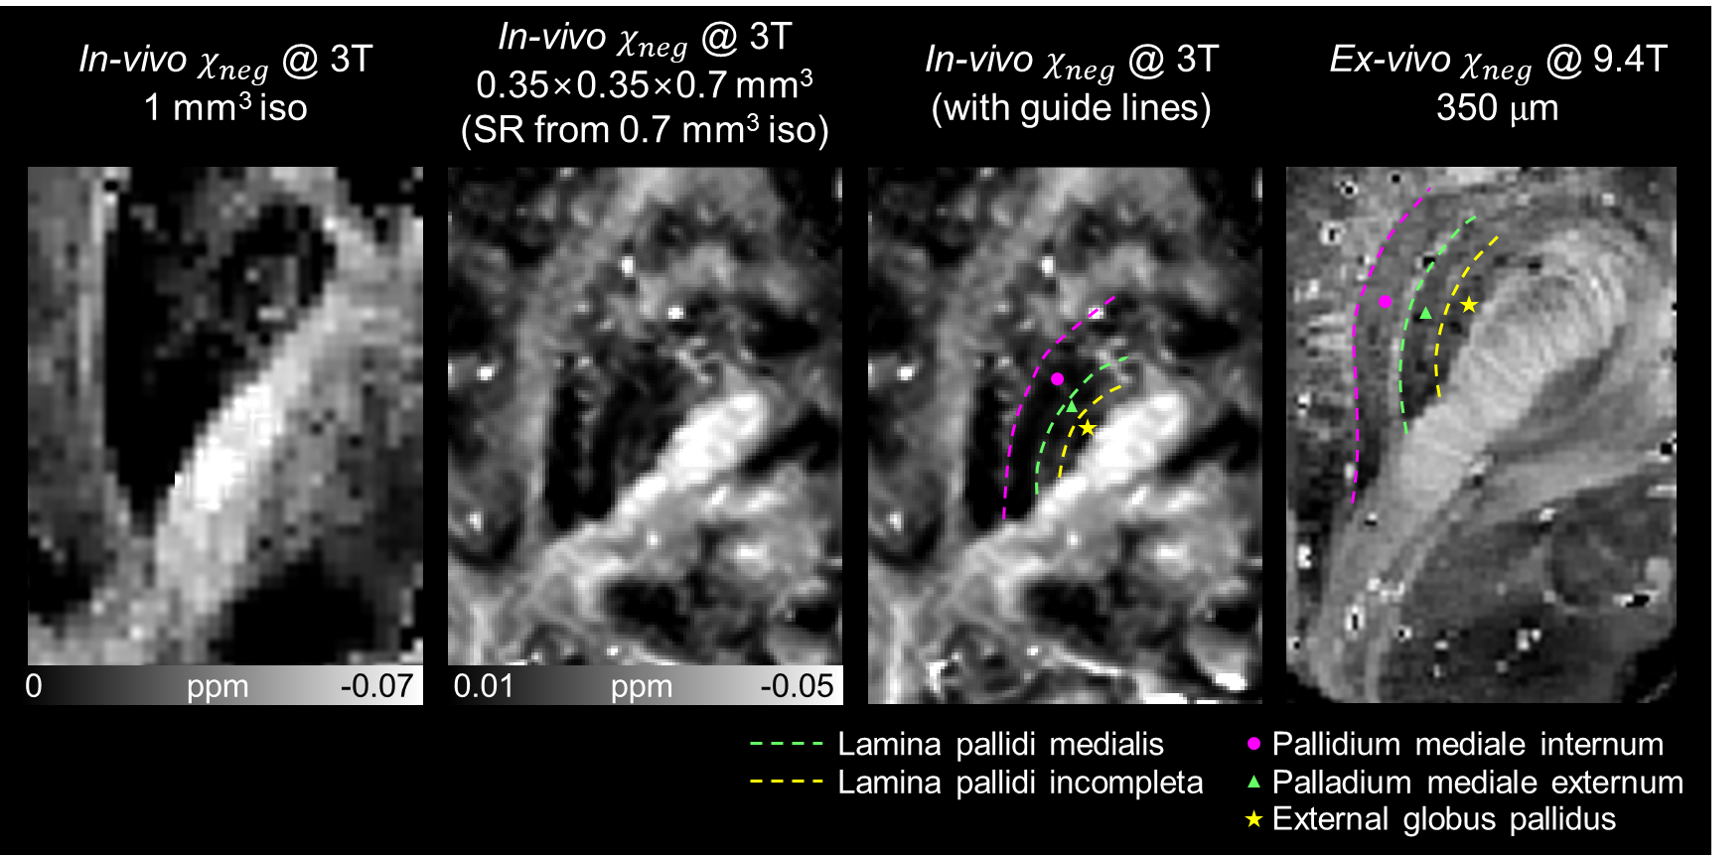
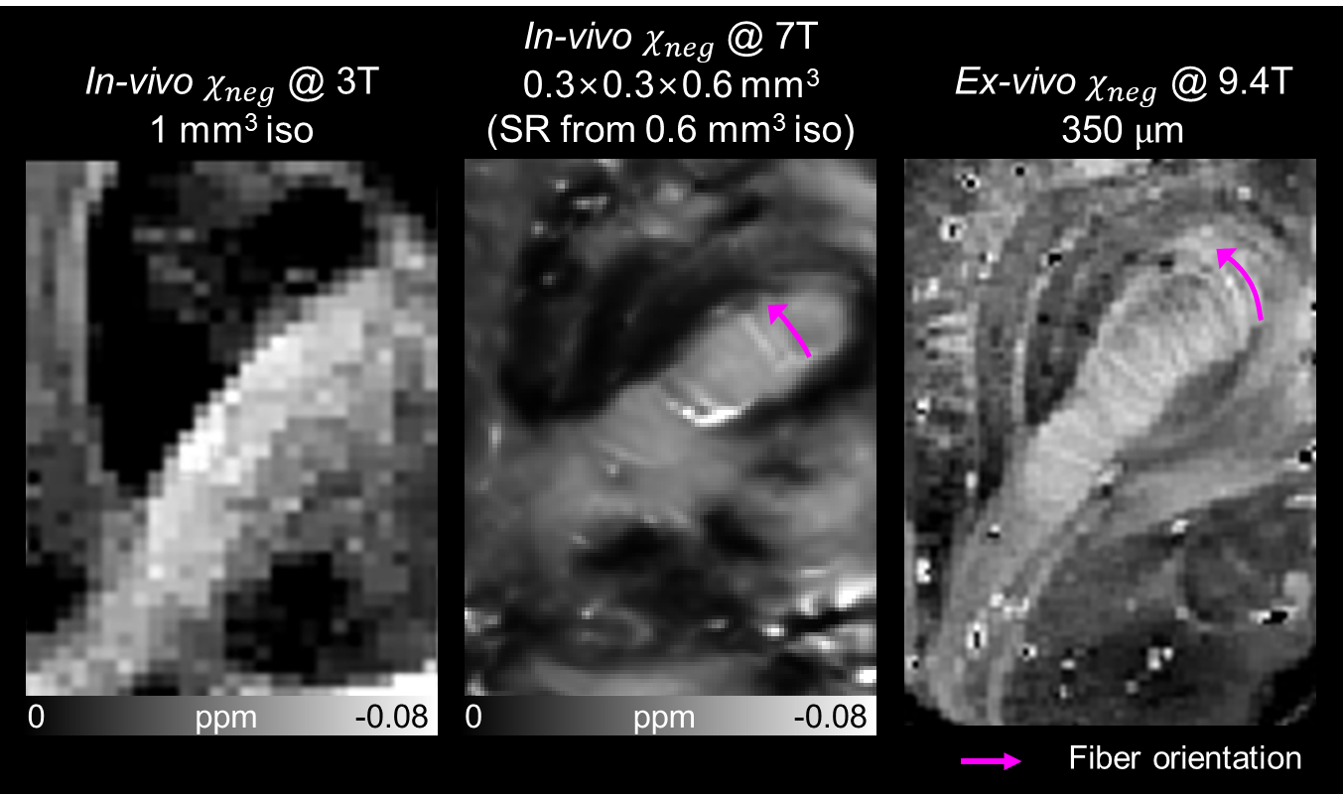
When the in-vivo $$$\chi_{neg}$$$ maps acquired using the 3T scanner is visually assessed, we can observe the fine laminar structures in the globus pallidus (Figure 2).3 In the in-vivo $$$\chi_{neg}$$$ map at 1 mm3 isotropic resolution, the structures in the globus pallidus is obscure. When the $$$\chi_{neg}$$$ map at 0.35×0.35×0.7 mm3 (super-resolution from 0.7 mm3 isotropic) is assessed, the two myelin-dense layers in the globus pallidus, lamina pallidi medialis (green dashed lines) and lamina pallidi incompleta (yellow dashed lines), are delineated. The same structures are observed in the ex-vivo $$$\chi_{neg}$$$ map,2 which required long scan time using a 9.4T scanner.Using a higher resolution at 7T, the fiber orientation of the internal capsule is observed (Figure 3). In the in-vivo $$$\chi_{neg}$$$ map at 1 mm3, orientation of the fibers in the internal capsule is not prominent. On the other hand, the $$$\chi_{neg}$$$ map at 0.3×0.3×0.6 mm3 (super-resolution from 0.6 mm3 isotropic) clearly displays the fiber orientation similar to that in the ex-vivo $$$\chi_{neg}$$$ map (magenta arrows).
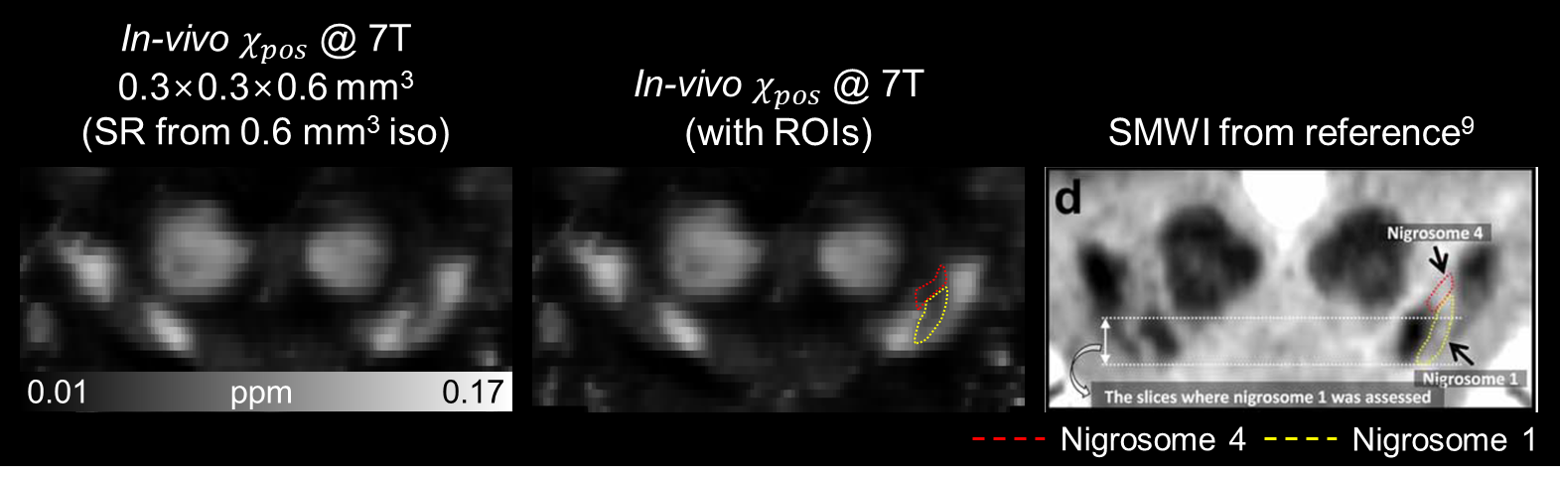
Furthermore, in a coronal slice of the in-vivo $$$\chi_{pos}$$$ map at 0.3×0.3×0.6 mm3, nigrosome 4 (Figure 4; red dashed ROI) and nigrosome 1 (Figure 4; yellow dashed ROI) structures are delineated, similar to that noticed in the susceptibility map weighted images reported in a previous work.9
Discussion and Conclusion
Although the super-resolution provides perceptually good images, the method cannot generate structures that are not visible in the original low-resolution image. In Figure 2, while the reconstructed in-plane resolution of in-vivo $$$\chi_{neg}$$$ is same as the ex-vivo $$$\chi_{neg}$$$ (0.35×0.35 mm2), the fibers of the internal capsule is not noticeable. When the images are acquired at a higher resolution (Figure 3), the fibers start to appear.In conclusion, high-resolution $$$\chi$$$-separation maps were reconstructed using four cascaded networks, delineating fine structures of human brain in vivo. The in-vivo $$$\chi_{neg}$$$ maps displayed similar detailed structures compared to ex-vivo $$$\chi_{neg}$$$ map which requires hours long scan time, and both nigrosome 1 and nigrosome 4 structures were distinguished in the in-vivo $$$\chi_{pos}$$$ map.
Acknowledgements
This work was supported by Heuron Co. Ltd., and the BK21 FOUR program of the Education and Research Program for Future ICT Pioneers, Seoul National University in 2022.References
1. Shin, H.-G. et al. χ-separation: Magnetic susceptibility source separation toward iron and myelin mapping in the brain. Neuroimage 240, 118371 (2021).
2. Shin, H.-G. et al. chi-separation using multi-orientation data in invivo and exvivo brains: Visualization of histology up to the resolution of 350 μm. in Proceedings of the 30th Annual ISMRM Meeting (2022).
3. Maruyama, S., Fukunaga, M., Fautz, H.-P., Heidemann, R. & Sadato, N. Comparison of 3T and 7T MRI for the visualization of globus pallidus sub-segments. Sci Rep-uk 9, 18357 (2019).
4. Park, J. et al. Coil2Coil: Self-supervised MR image denoising using phased-array coil images. Arxiv (2022) doi:10.48550/arxiv.2208.07552.
5. Lehtinen, J. et al. Noise2Noise: Learning Image Restoration without Clean Data. Arxiv (2018) doi:10.48550/arxiv.1803.04189.
6. Yoon, J. et al. Quantitative susceptibility mapping using deep neural network: QSMnet. Neuroimage 179, 199–206 (2018).
7. Kim, M. et al. Chi-sepnet: Susceptibility source separation using deep neural network. in Proceedings of the 30th Annual ISMRM Meeting (2022).
8. Chen, L., Chu, X., Zhang, X. & Sun, J. Simple Baselines for Image Restoration. Arxiv (2022) doi:10.48550/arxiv.2204.04676.
9. Sung, Y. H. et al. Differential involvement of nigral subregions in idiopathic parkinson's disease. Hum. Brain Mapp. 39, 542–553 (2018).
Figures