1044
Region-of-Interest Based Statistical Analysis of the 2019 QSM Challenge
Patrick Fuchs1, Carlos Milovic2, and Karin Shmueli1
1Medical Physics and Biomedical Engineering, University College London, London, United Kingdom, 2School of Electrical Engineering, Pontificia Universidad Catolica de Valparaiso, Valparaiso, Chile
1Medical Physics and Biomedical Engineering, University College London, London, United Kingdom, 2School of Electrical Engineering, Pontificia Universidad Catolica de Valparaiso, Valparaiso, Chile
Synopsis
Keywords: Susceptibility, Quantitative Susceptibility mapping
Since its inception, the most recent QSM challenge and corresponding dataset have helped to improve dipole-inversion algorithms. To date, only global metrics have been used to evaluate performance of these algorithms. Typically, in clinical applications of QSM, the susceptibility value in a specific brain region or structure is of interest. Therefore, we compared the accuracy of QSM algorithms in 28 regions in several ways including regional metrics and median differences, which is important to facilitate clinical translation of QSM. We found that, according to regional metrics, some direct QSM methods are surprisingly accurate considering their low global scores.Introduction
In 2019, a second quantitative susceptibility mapping (QSM) reconstruction challenge was launched to determine which reconstruction algorithms perform best in reconstructing magnetic susceptibility maps from a given local field map synthesised from a ground truth numerical susceptibility phantom1. Submitted algorithms were scored based on visual and numerical error metrics calculated throughout the whole brain mask. As each metric provided only one global score per submitted algorithm, it was easy to rank their performance. However, for QSM in a clinical setting, we are often only interested in specific brain areas, and not the overall structure throughout the brain. For clinical applications, a region-of-interest (ROI) based analysis may provide better insight into which reconstruction is best (most accurate) for the specific region(s) under investigation. To investigate this, we analysed the 2019 challenge submissions using ROI based metrics. To enable this, the original segmentation used in the challenge was augmented, with a more specific segmentation based on a multi-atlas technique. Specifically, we separated left and right hemisphere ROIs, and subdivided some ROIs, as well as constraining the CSF to the ventricles rather than including CSF throughout the exterior of the brain, which is difficult to reconstruct.Here, we performed a statistical analysis of these ROIs, rather than relying solely on a metric such as mean squared error, to tell us not only how close the reconstructed regional susceptibility is to the ground truth but also whether the error in the reconstructed ROI is significant. This significance is important when comparing ROI susceptibilities across a population, in which reconstructions that introduce regional uncertainty or bias can lead to erroneous study results. Further, this ROI-based statistical analysis provides insight into which ROIs are accurately reconstructed by most algorithms, and which ROIs few algorithms submitted to the challenge reconstruct accurately.
Methods
MRICloud2 was used to obtain new QSM segmentations based on the 2019 QSM challenge ground truth susceptibility map1 combined with an available T1-weighted magnitude map3. This new segmentation contained 28 labels, compared to the 9 original labels. The 28 segments were then morphologically closed (using a spherical kernel of radius 3 voxels) and combined with the original segmentation through intersection to ensure minimal partial volume effects. Finally, for the gray and white matter regions, the original segmentations appeared to be more accurate, and were substituted, and the final CSF segment was manually constrained to the ventricles using morphological operations. Since the distribution of the ground truth susceptibility values within ROIs is not normal due to texturing (verified with Shapiro-wilk test), the reconstructed susceptibility maps are also not expected to follow a normal distribution. Therefore, we used a non-parametric Kruskal Wallis test to test whether the reconstruction is correct within each ROI. A Tukey-Kramer critical value was then computed for the test statistic and the reconstructions were deemed significantly different at a 95% confidence interval. That is, there is a 5% probability that the reconstructed ROI susceptibility is not from the same distribution as the ground truth ROI susceptibility.Additionally, the difference in the medians of the reconstructed and ground truth ROI susceptibilities was computed and normalised by the median absolute deviation, to give insight into how different the reconstructions are from the ground truth. Here, to give an overview, we present a subset of 11 different reconstruction methods submitted to the second stage of the challenge. A full list of these 11 reconstruction methods and a description of their approaches is given in Table 1.
Stage 2 of the challenge was used, where participants could not tune their algorithm against the ground truth. This aimed to remove some human bias in the parameter optimization process. Furthermore, the lower SNR (SNR1) reconstructions are presented, as this data is closer to the SNR usually achieved in a clinical setting.
Results and Discussion
Figures 1 and 2 show the statistical test of ROI similarity and ROI RMSEs, respectively. To help evaluate these results, Figure 3 shows a plot of median differences.The statistical testing (Figure 1) is interesting in that it does not favour iterative methods over deep learning or direct methods as clearly as in the original global analysis. For example, the direct Tikhonov (dirTik) reconstruction correctly reconstructed the susceptibility in 12 ROIs, better than the top (global RMSE) scoring iterative methods (FANSI and L1-QSM, 9 ROIs) with the best method (FINE) reconstructing 16 ROIs correctly. This contrasts with the RMSE metrics (Figure 2) which show better performance by those methods that also have a low global RMSE.
The median differences clearly show that most reconstruction methods underestimate the original values (Figure 3 is mostly blue) and allow identification of which methods provide ROI results relatively close to the ground truth, and which provide less accurate results.
Interestingly, the CSF, which is often used as a reference value4,5,6, shows large discrepancies for all reconstruction methods (Figure 3). Figure 4 showcases the clear increase in the width of the CSF susceptibility distribution.
Conclusion
The ROI-based and statistical metrics investigated here provide an informative alternative to global error metrics for comparing QSM reconstruction methods, especially in the context of clinical and translational research.Acknowledgements
Karin Shmueli and Patrick Fuchs were supported by European Research Council Consolidator Grant DiSCo MRI SFN 770939, and Carlos Milovic was supported by Cancer Research UK Multidisciplinary Award C53545/A24348.References
- QSM Challenge 2.0 Organization Committee, et al., QSM reconstruction challenge 2.0: Design and report of results. Magn Reson Med. 2021, doi: 10.1002/mrm.28754.
- Li, X., et al., Multi-atlas tool for automated segmentation of brain gray matter nuclei and quantification of their magnetic susceptibility, NeuroImage, 2019, doi: 10.1016/j.neuroimage.2019.02.016
- Marques, J.P., et al. QSM reconstruction challenge 2.0: A realistic in silico head phantom for MRI data simulation and evaluation of susceptibility mapping procedures. Magn Reson Med., 2021. doi: 10.1002/mrm.28716
- Liu, Z., et al. MEDI+ 0: Morphology enabled dipole inversion with automatic uniform cerebrospinal fluid zero reference for quantitative susceptibility mapping. Magn Reson Med., 2018, doi: 10.1002/mrm.26946
- Lim, I.A.L., et al. Human brain atlas for automated region of interest selection in quantitative susceptibility mapping: application to determine iron content in deep gray matter structures. Neuroim., 2013, doi: 10.1016/j.neuroimage.2013.05.127
- Straub, S., et al. Suitable reference tissues for quantitative susceptibility mapping of the brain. Magn Reson Med.,2017, doi: 10.1002/mrm.26369
Figures
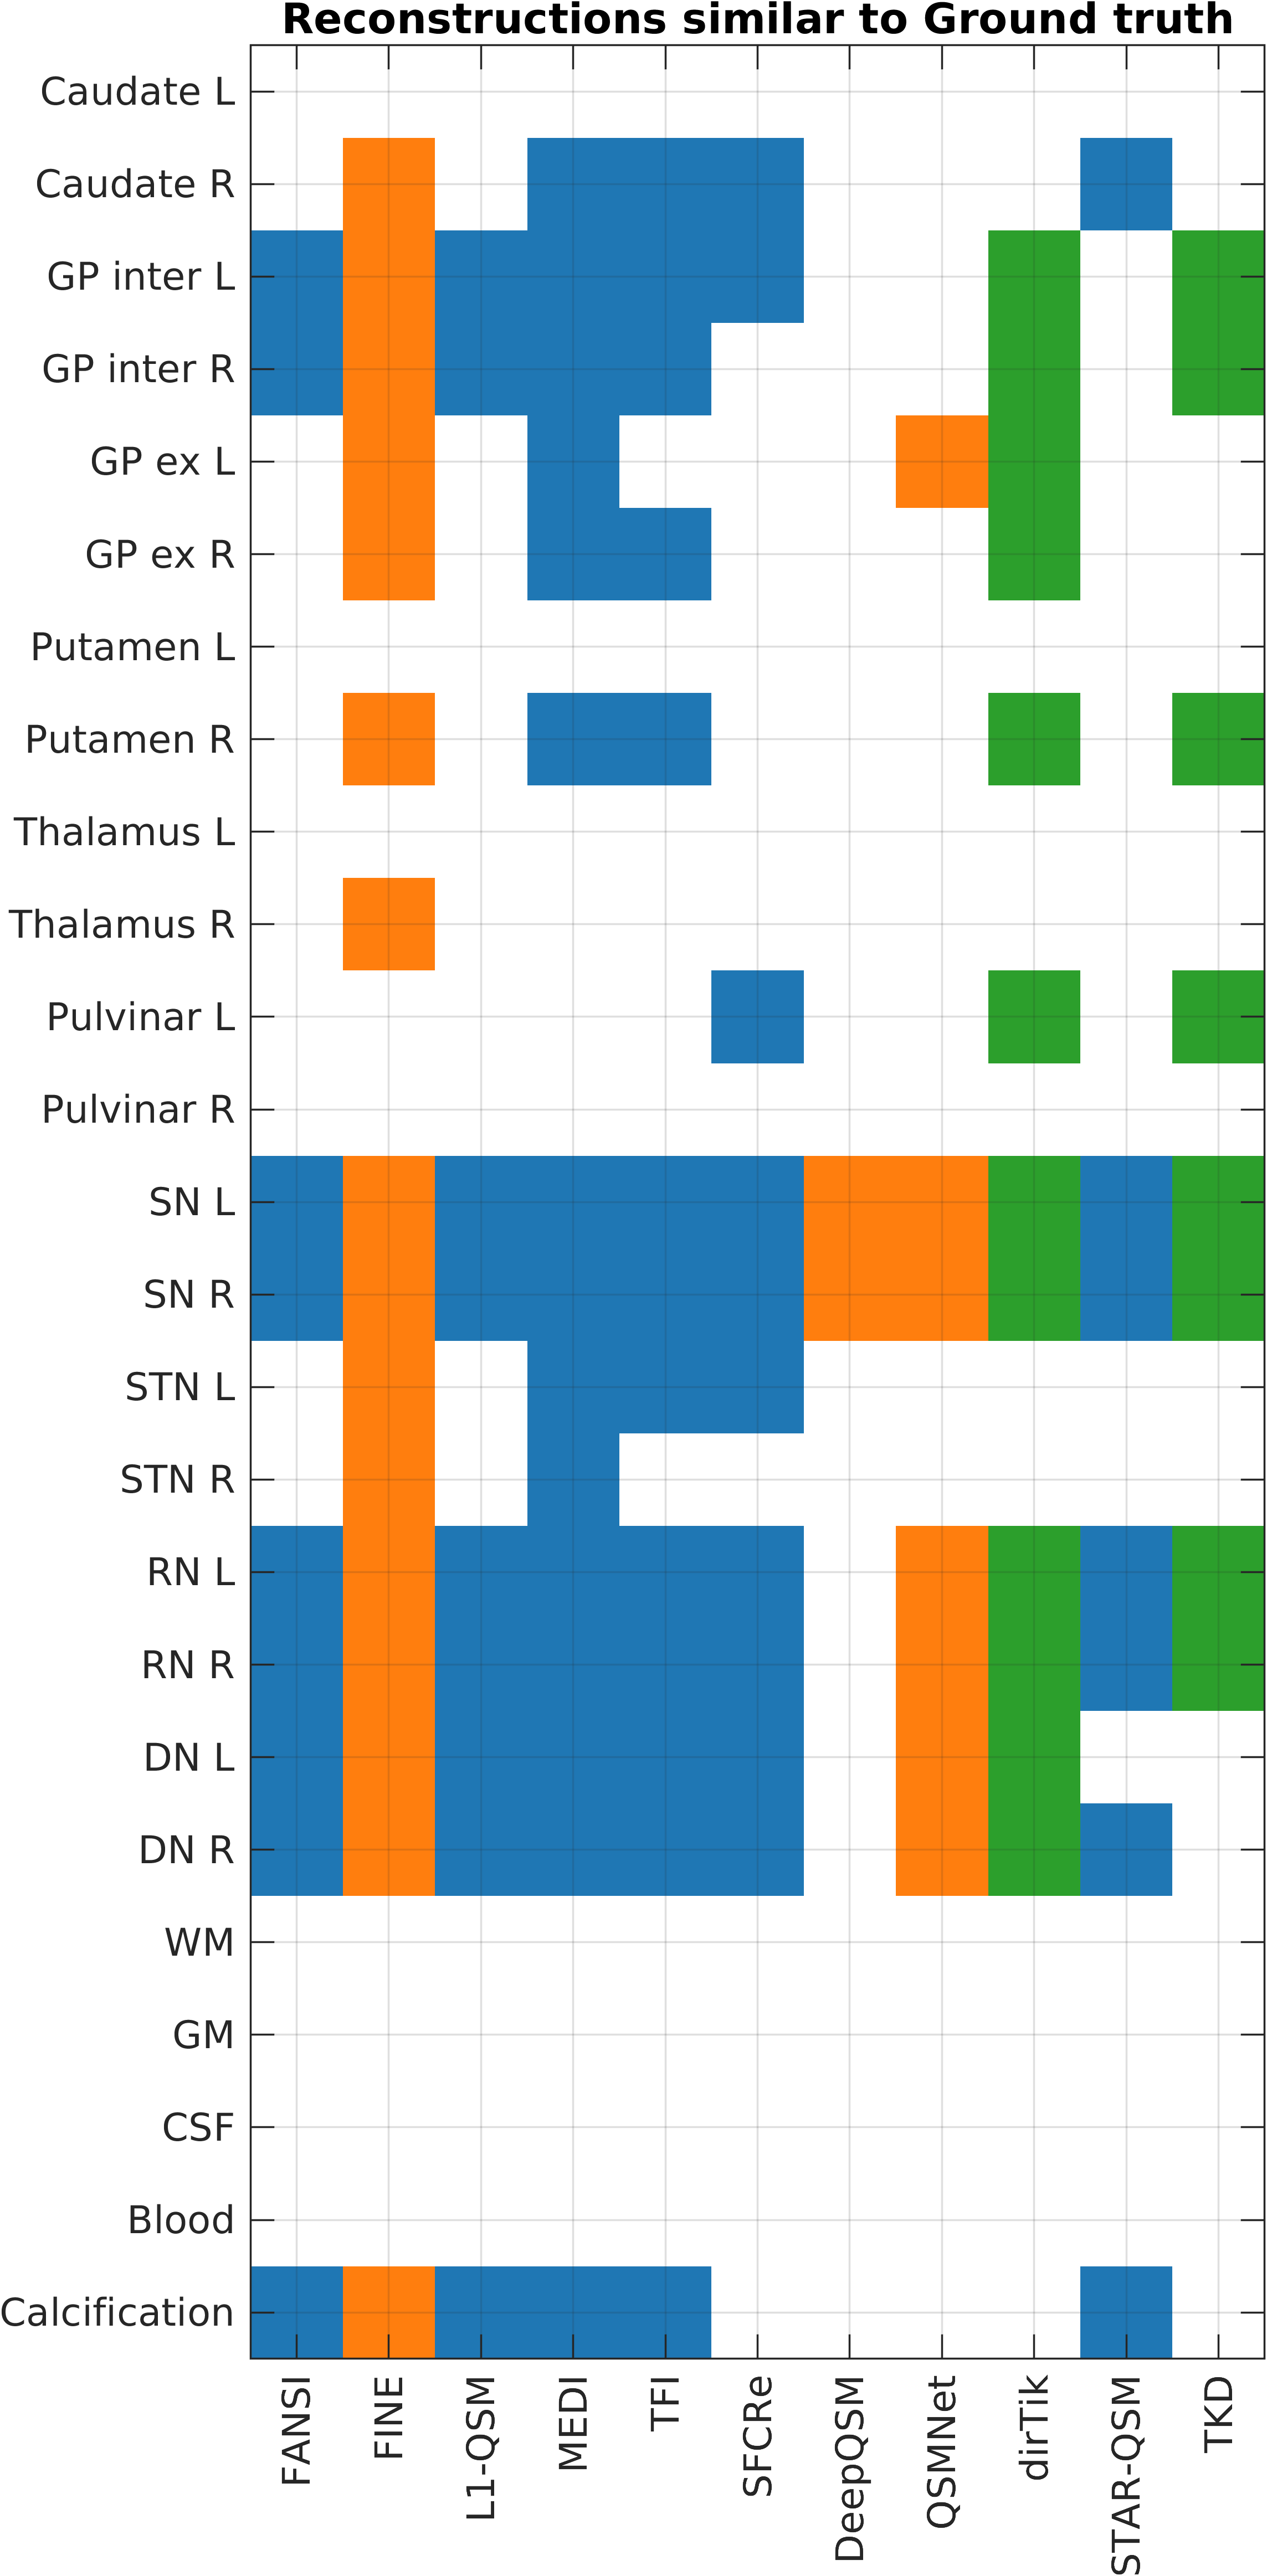
Figure 1.
Overview of statistical test results. Blue reconstructions are
iterative optimisation based, orange are deep learning approaches,
and green are direct solutions. The square is colored in when the
reconstruction was not statistically significantly different from the
ground truth in that ROI. These submissions are ordered according to
ascending (global) RMSE from left to right (this can also be found in
the top row of RMSE plot Figure 2). Fat, air and bone ROIs not shown
for readability.
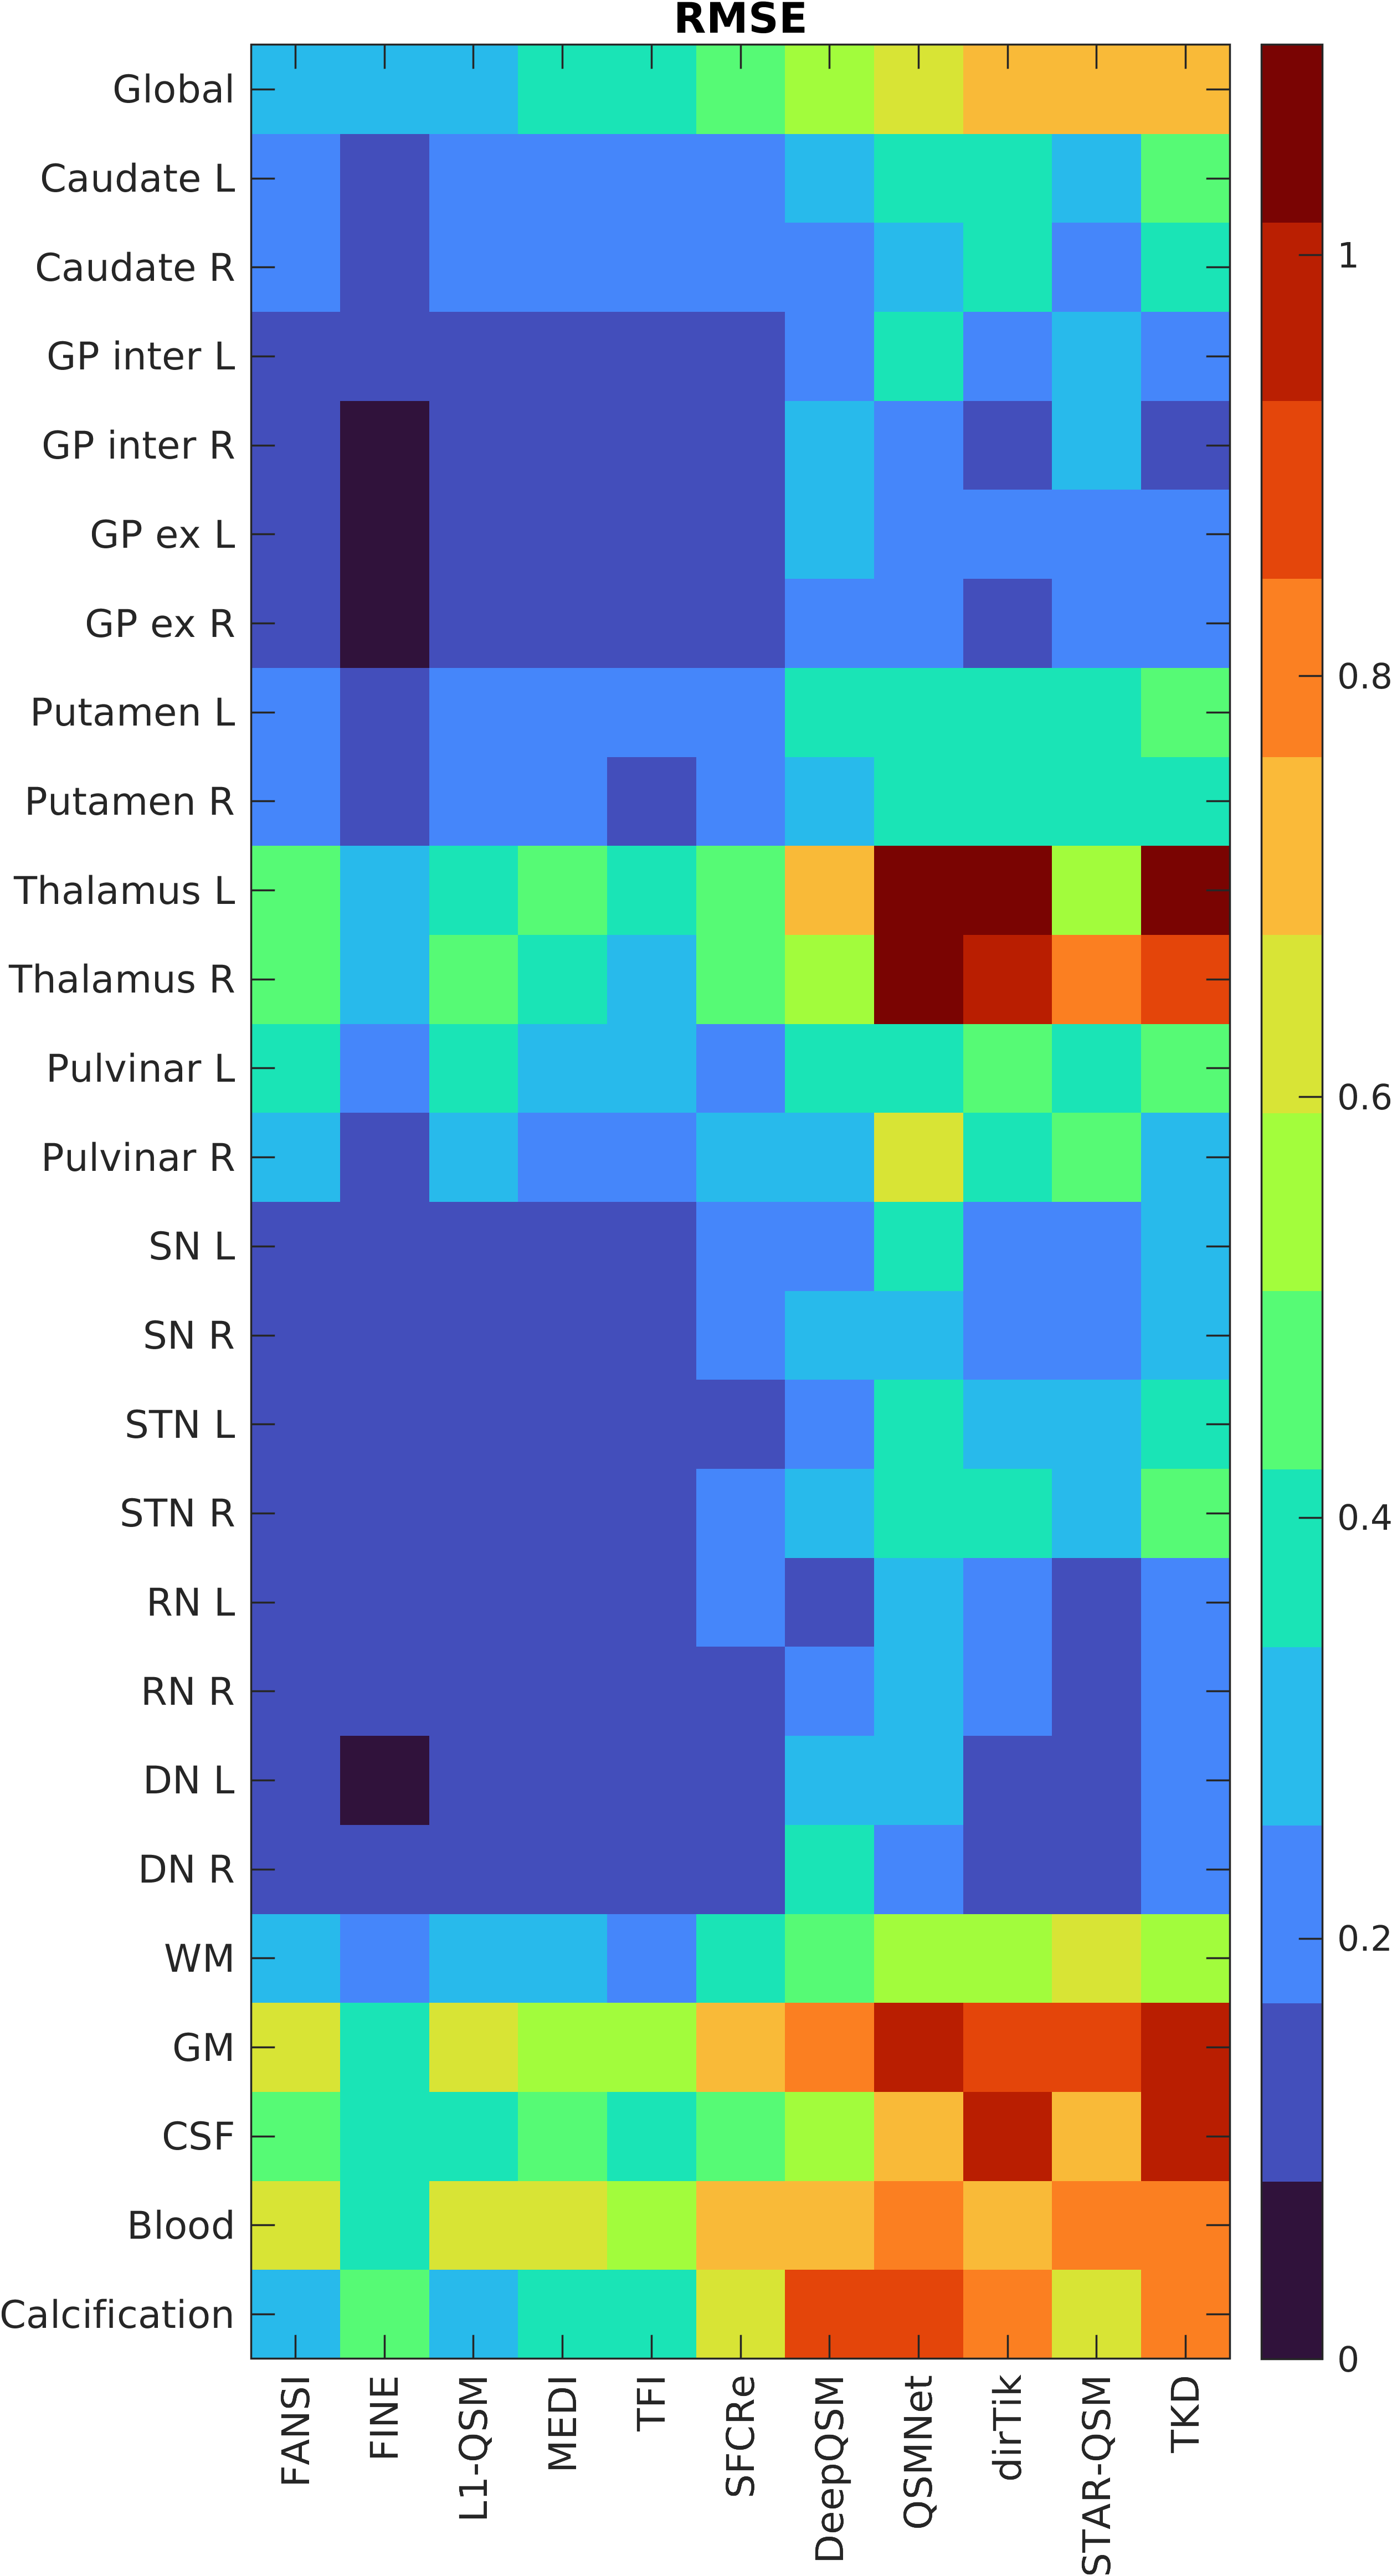
Figure 2.
RMSE values of the individual ROIs, computed with the code from
the challenge analysis. For comparison, the global RMSE throughout
the whole brain is shown in the top row. Fat, air and bone ROIs not
shown for readability.
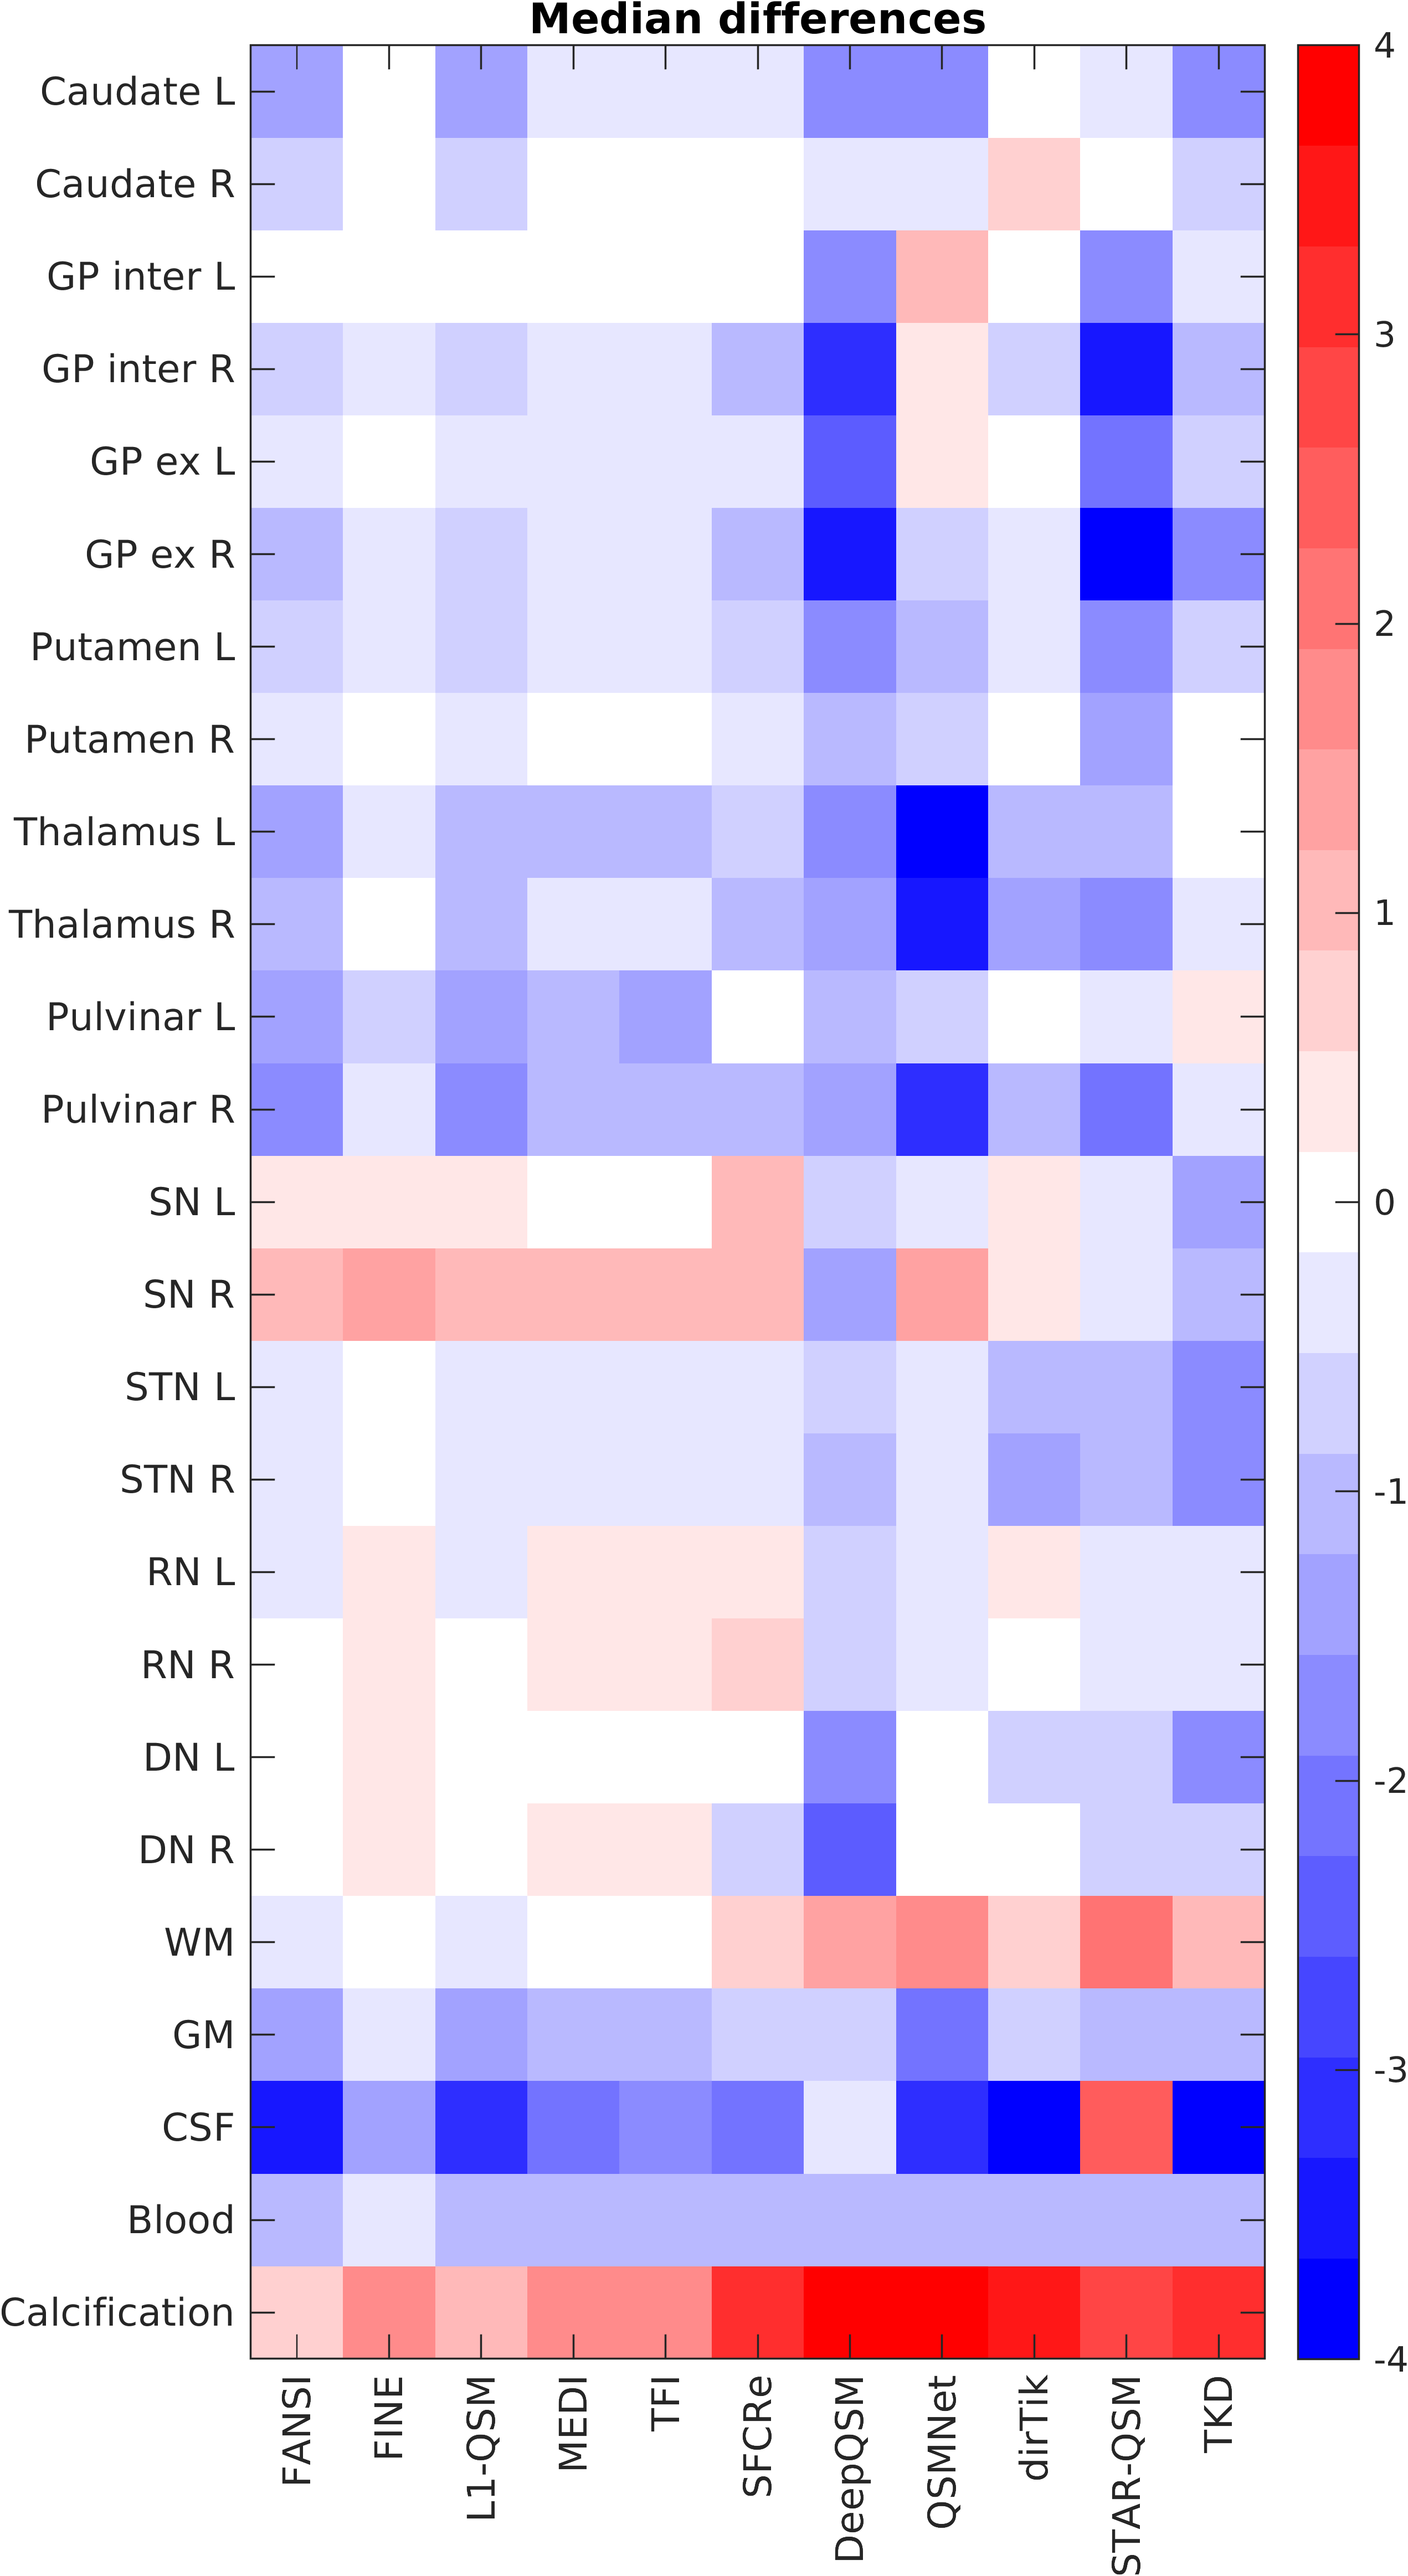
Figure 3. Median
differences between ROIs reconstruction (rec) and ground truth (GT). Computed as $$$\frac{\mathrm{median}(\chi_{rec}) -
\mathrm{median}(\chi_{GT})}{\mathrm{mad}(\chi_{GT})},$$$ where mad is the median absolute
deviation. Negative values dominate (blue squares) showing that most
reconstruction methods underestimate susceptibility values within ROIs.
Fat, air and bone ROIs not shown for readability.
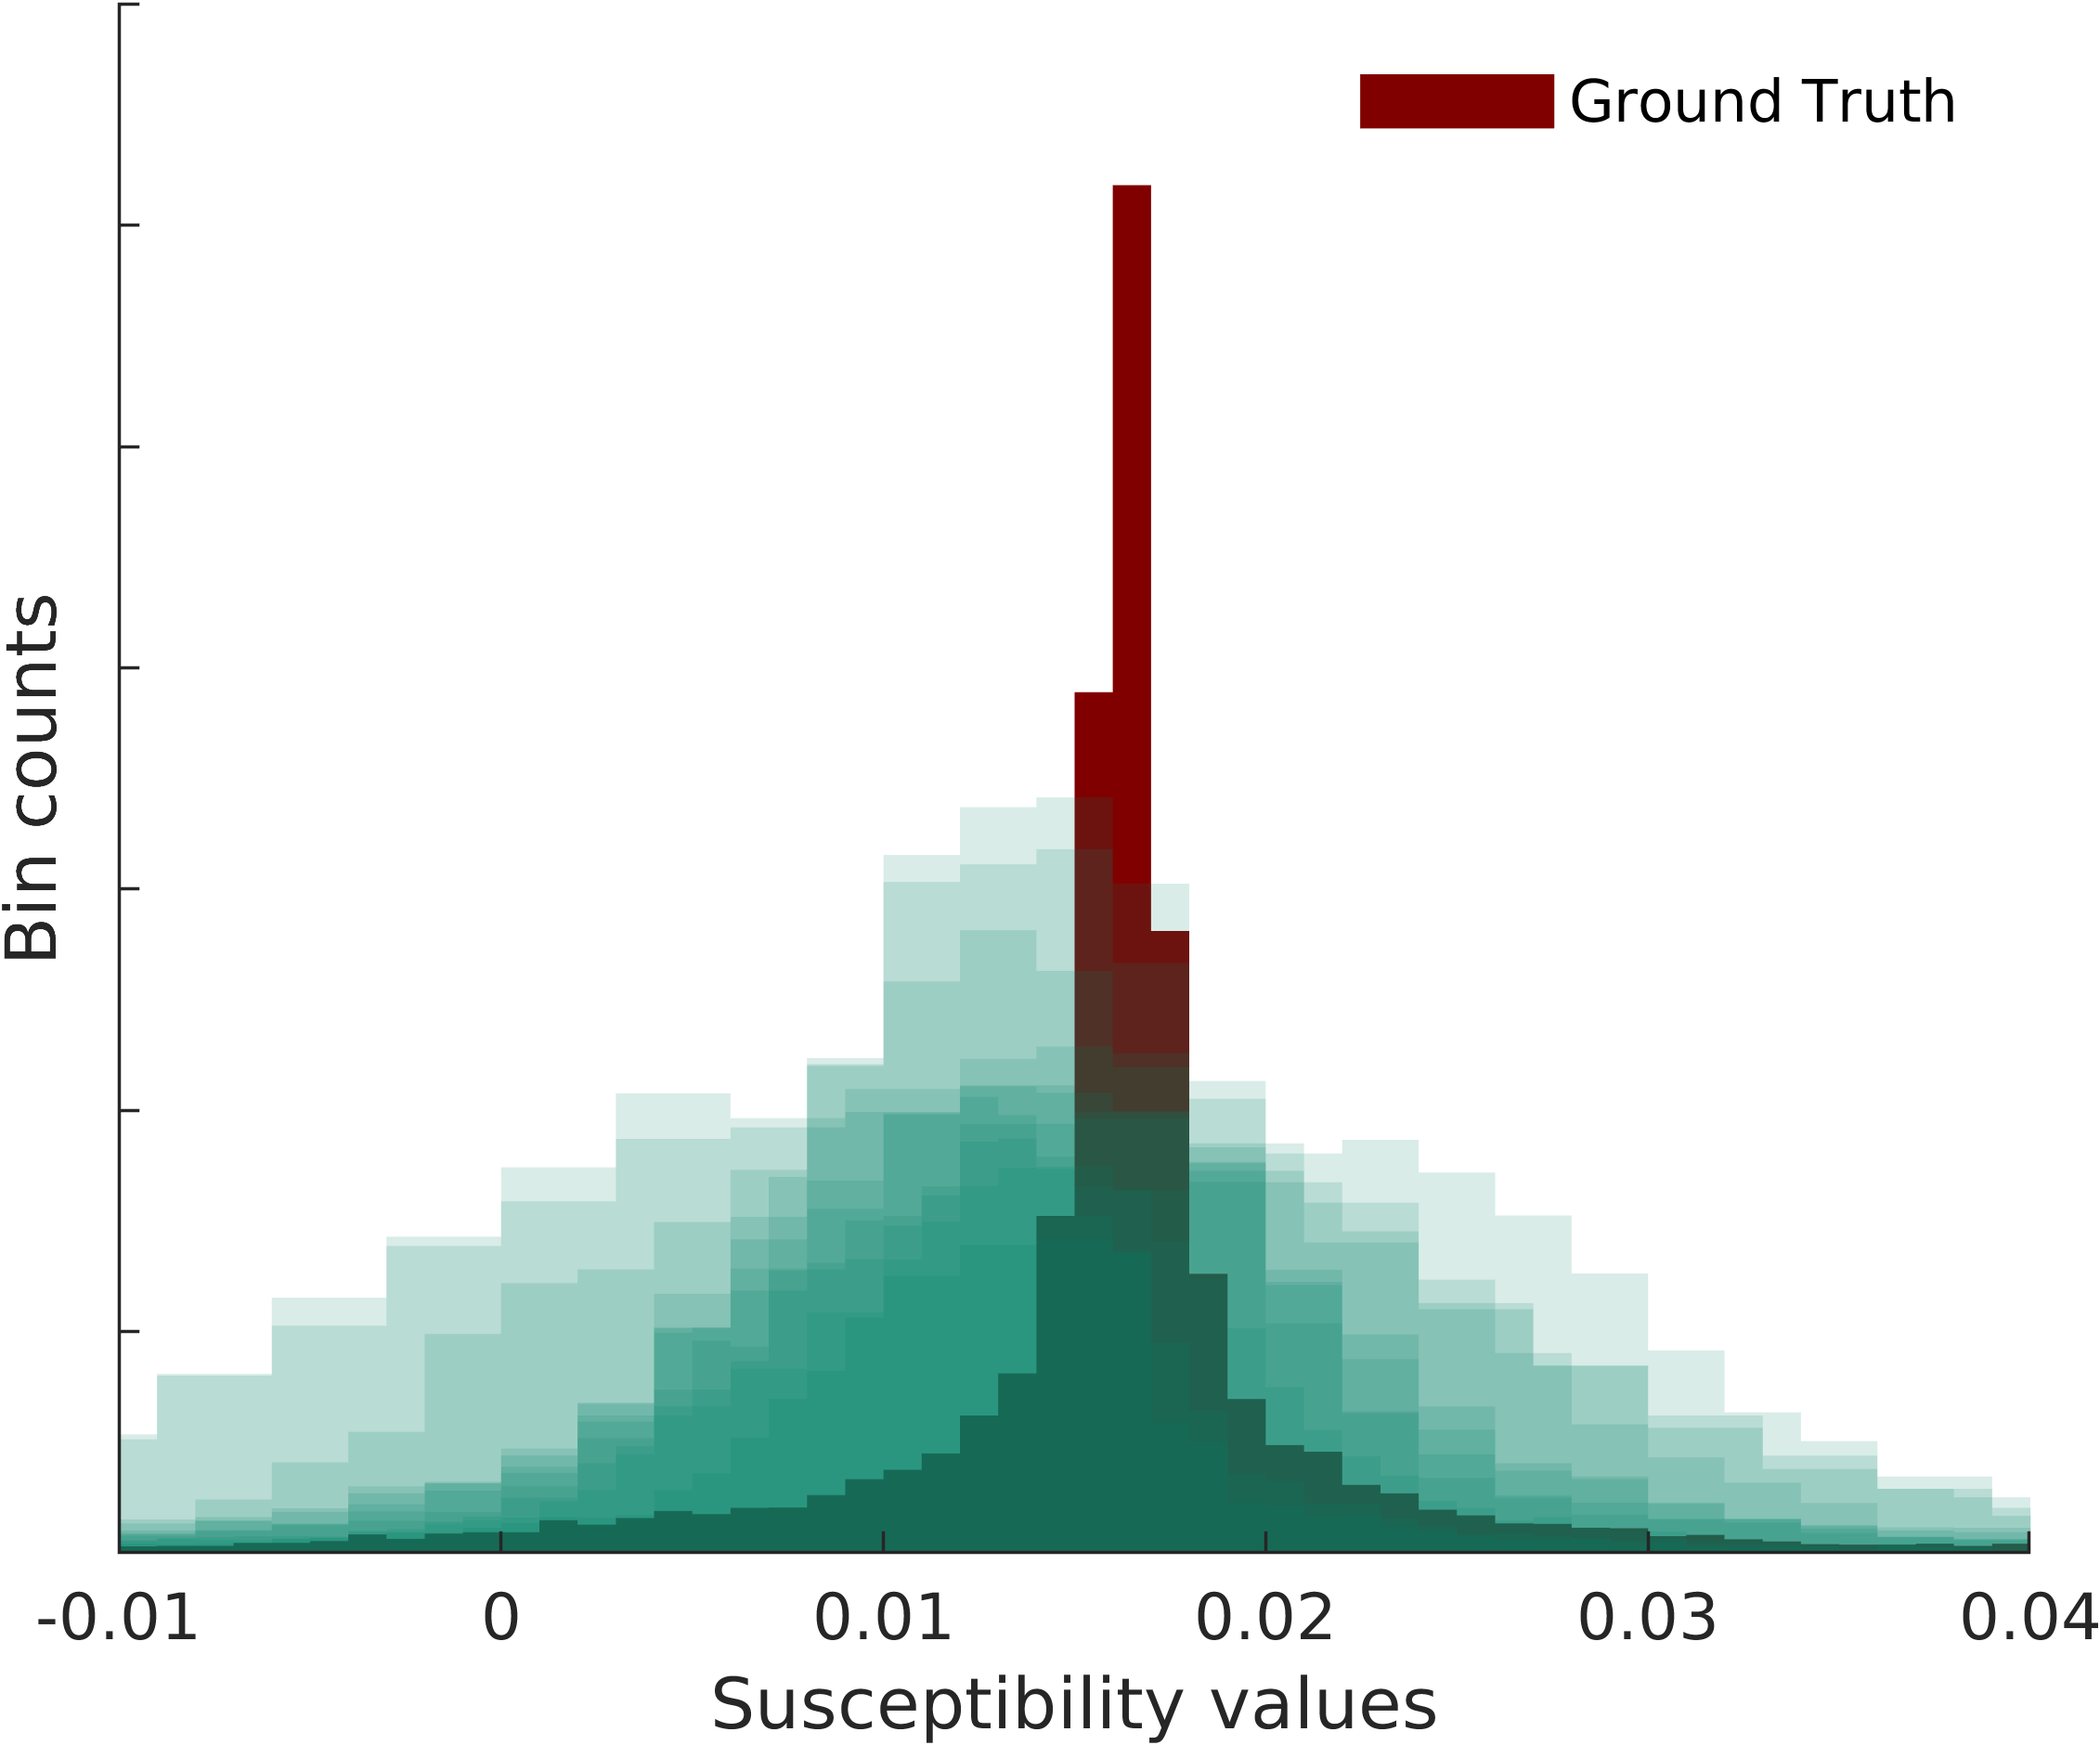
Figure 4.
Ground truth cerebrospinal fluid susceptibility distribution (in
the ventricles). All 11 reconstructed CSF susceptibility
distributions are overlaid in green, showing clear broadening of the
distribution, together with shifts in mean and median values.

Table 1. Overview of
reconstruction methods compared in this ROI based analysis. Step 2
SNR 1 submissions are compared for the second phantom. Descriptions
are as provided to the challenge upon submission. DOIs are provided
for convenience and correspond as closely as possible to the
submissions, but there may be minor differences in implementation of
the method for the challenge compared to the original publication.
DOI: https://doi.org/10.58530/2023/1044