1041
Superconducting Quantum Interference Device (SQUID-) Based Susceptometry as a Reference Measurement for Quantitative Susceptibility Mapping1Radiology, University of Wisconsin-Madison, Madison, WI, United States, 2Medical Physics, University of Wisconsin-Madison, Madison, WI, United States, 3University Medical Center Hamburg-Eppendorf, Hamburg, Germany, 4Physics, University of Sao Paulo, Ribeirao Preto, Brazil, 5Tristan Technologies, Inc, San Diego, CA, United States, 6Medicine, University of Wisconsin-Madison, Madison, WI, United States, 7Biomedical Engineering, University of Wisconsin-Madison, Madison, WI, United States, 8Emergency Medicine, University of Wisconsin-Madison, Madison, WI, United States
Synopsis
Keywords: Validation, Susceptibility
Many quantitative susceptibility mapping (QSM) studies lack independent reference measurements of susceptibility (χ) for validation. In this work, superconducting quantum interference device (SQUID-) based susceptometry and QSM data were acquired for phantoms with varying manganese chloride (MnCl2) concentrations. χSQUID demonstrated low uncertainty and excellent agreement with the nominal susceptibility values. χQSM and R2* agreed relatively well with the nominal values and previously published results. However, χQSM demonstrated higher uncertainty in comparison to χSQUID. SQUID susceptometry has the potential to identify sources of bias and variability in QSM methods by serving as an independent reference measurement of susceptibility.Introduction
Excess accumulation of iron can lead to liver damage, cardiomyopathy, and pancreatic dysfunction. MR-based relaxometry (R2 and R2*) methods for iron quantification may be affected by confounding factors, including microscopic iron distribution.1,2Unlike relaxometry-based methods, magnetic susceptibility (χ) has a direct and well-understood relationship with iron concentration and is unaffected by confounding factors such as microscopic iron distribution.3,4 Susceptibility can be measured non-invasively using MR-based quantitative susceptibility mapping (QSM) or superconducting quantum interference device (SQUID-) based susceptometry.
SQUID susceptometry has been validated and used for clinical studies5-9 and has been shown to correlate with MR-based methods for iron quantification.9,10 However, QSM has been shown to underestimate susceptibility in comparison to SQUID in vivo.10 To understand the discrepancy between SQUID and QSM in vivo, phantom validation experiments may prove useful. Therefore, the purpose of this work was to evaluate the agreement between SQUID, QSM, and nominal susceptibility using phantoms with known composition.
Methods
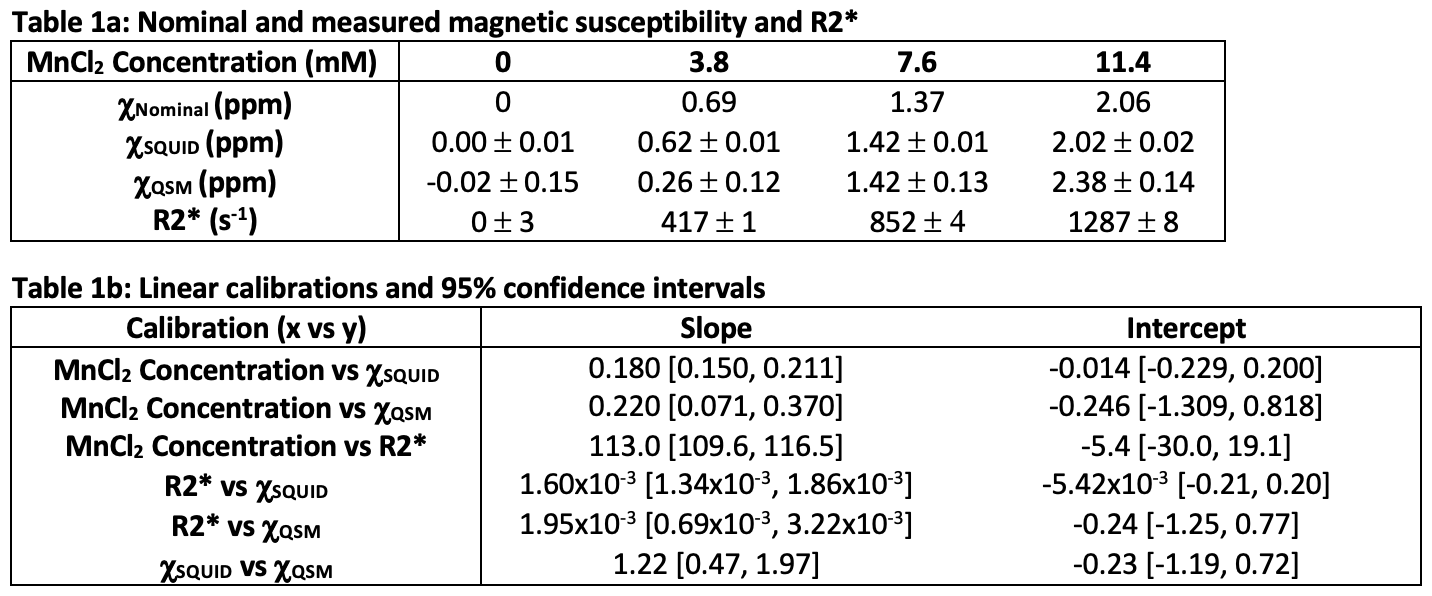
Phantoms: Four cylindrical (radius=5.5cm and height=31.5cm) containers with manganese chloride (MnCl2) solutions in deionized water were prepared with concentrations of C=0, 3.8, 7.6, and 11.4mM (see Table 1a for nominal χ).SQUID Susceptometry: SQUID susceptometry measures χ based on changes in magnetic flux as the object being measured is moved away from a set of detector coils. The magnetic flux in a set of detector coils can be defined by $$\Phi_{d}(r)=(\mu_{0}I_{d})^{-1}\int\chi(r)(B_{f}(r)\cdot B_{d}(r))d^{3}r\quad Eq.(1)$$ where μ0 is permeability of free-space, Bf is the applied magnetic field, and Bd is the reciprocal magnetic field of the detector coils generated by an induced current Id.11 Assuming a homogenous susceptibility distribution, the magnetic flux integral $$\Phi_{int}(z)=\int(B_{f}(r)\cdot B_{d}(r))d^{3}r\quad Eq.(2)$$ is proportional to the induced voltage (V) at perpendicular distances z from the detector coils, and susceptibility can be determined from the equation $$V(z)=C_{sys}\Delta\chi\Phi_{int}(z)+V_{0}\quad Eq.(3)$$ where Csys is a system calibration constant and Δχ is the susceptibility difference between the object being measured and a reference background.
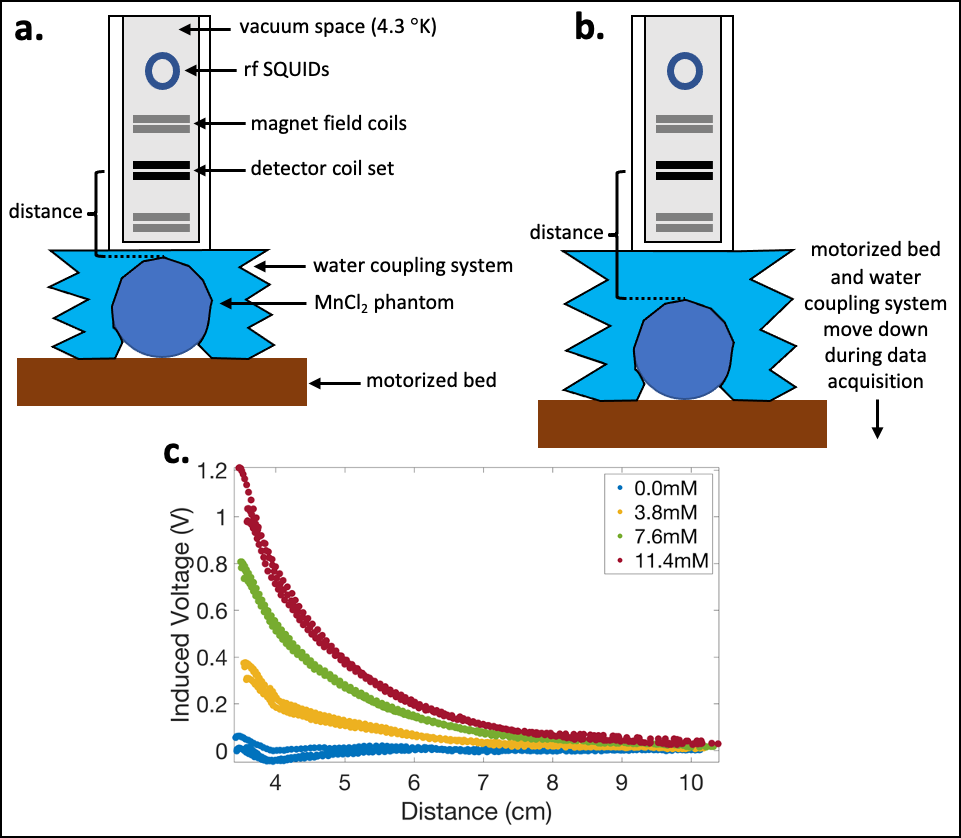
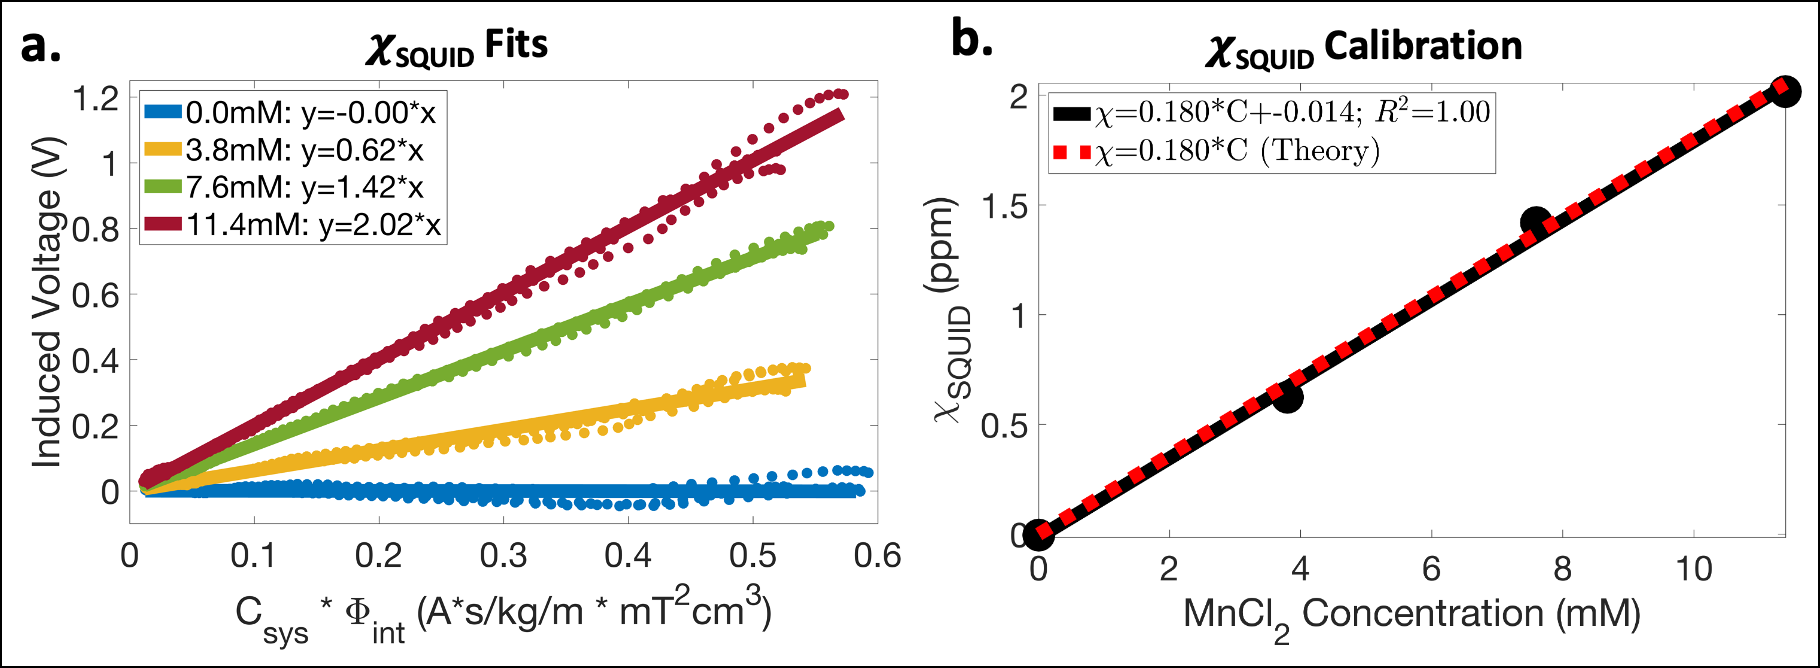
In this work, a dual-channel SQUID liver susceptometry system (Biomagnetic Technologies Inc., San Diego, CA) with a deionized water reference coupling system was used to measure V as a function of z (see Figure 1 for details). Using the known geometries of the phantoms and detector coils, Φint was calculated using Eq.(2), and estimates of χSQUID were obtained by performing linear least squares fitting of Eq.(3), which was used for all fits described in this work. A linear calibration of MnCl2 concentration vs χSQUID was also determined and compared to the theoretical calibration.
MR-Based Methods: The four phantoms were placed in a deionized water bath for simultaneous MR data acquisition. Using a 3T Signa Premier scanner (GE Healthcare), a multi-echo 3D spoiled gradient-echo sequence was acquired with monopolar readouts, 6 echoes (2 echo trains), TE=0.8-3.9ms, TR=5.25ms, voxel size=3x3x6mm, 32 slices, FA=3°, and 6 averages.
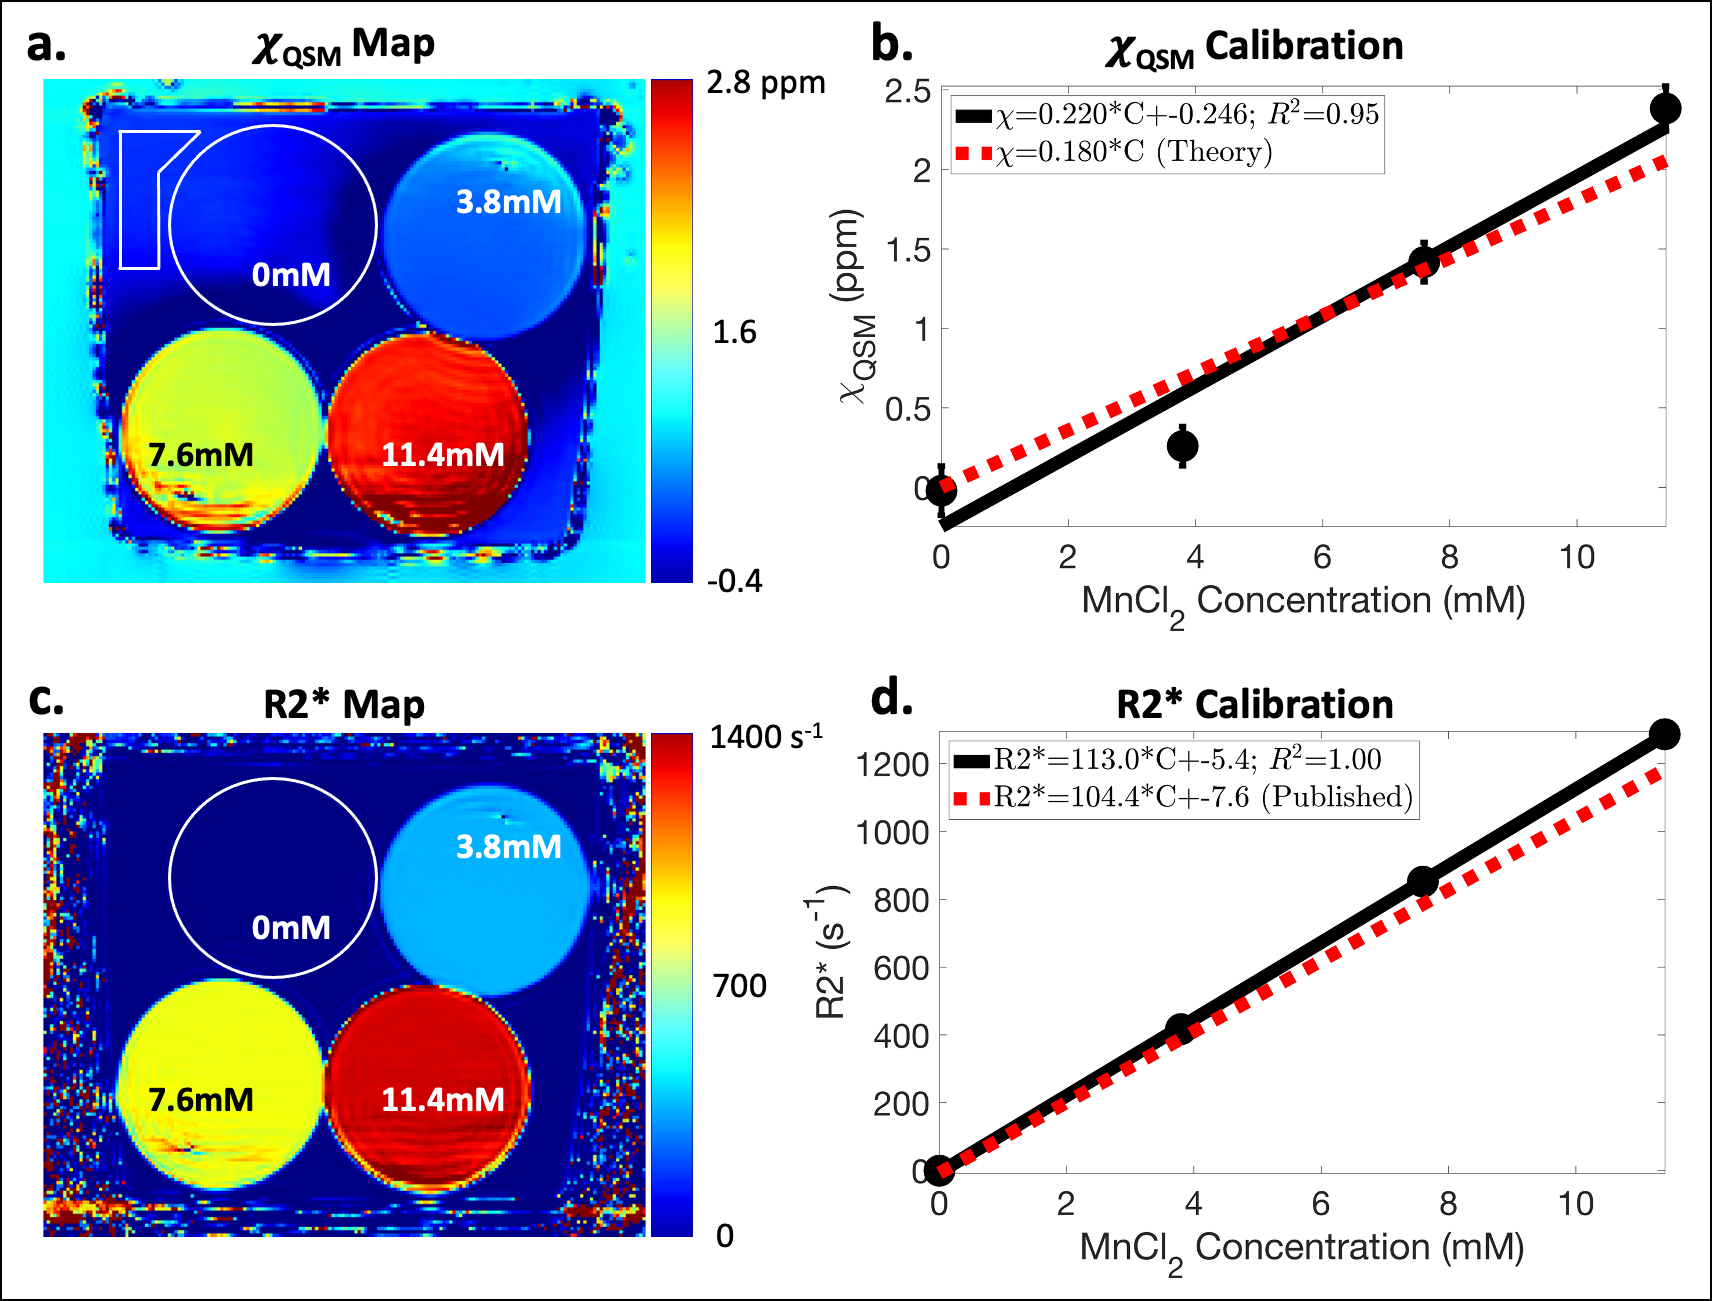
Estimates of the B0 field map and R2* map were obtained using a graphcut algorithm.12 The B0 map was then used as input to an iterative L2-norm-based QSM method that performed Laplacian-based background field removal and image-gradient-based regularization.13,14 For each phantom, average measurements of χQSM (referenced to the average in the background water) and R2* were obtained using ROIs covering three central slices. Linear calibrations of MnCl2 concentration vs χQSM, MnCl2 concentration vs R2*, χSQUID vs χQSM, R2* vs χQSM, and R2* vs χSQUID were determined.
Results
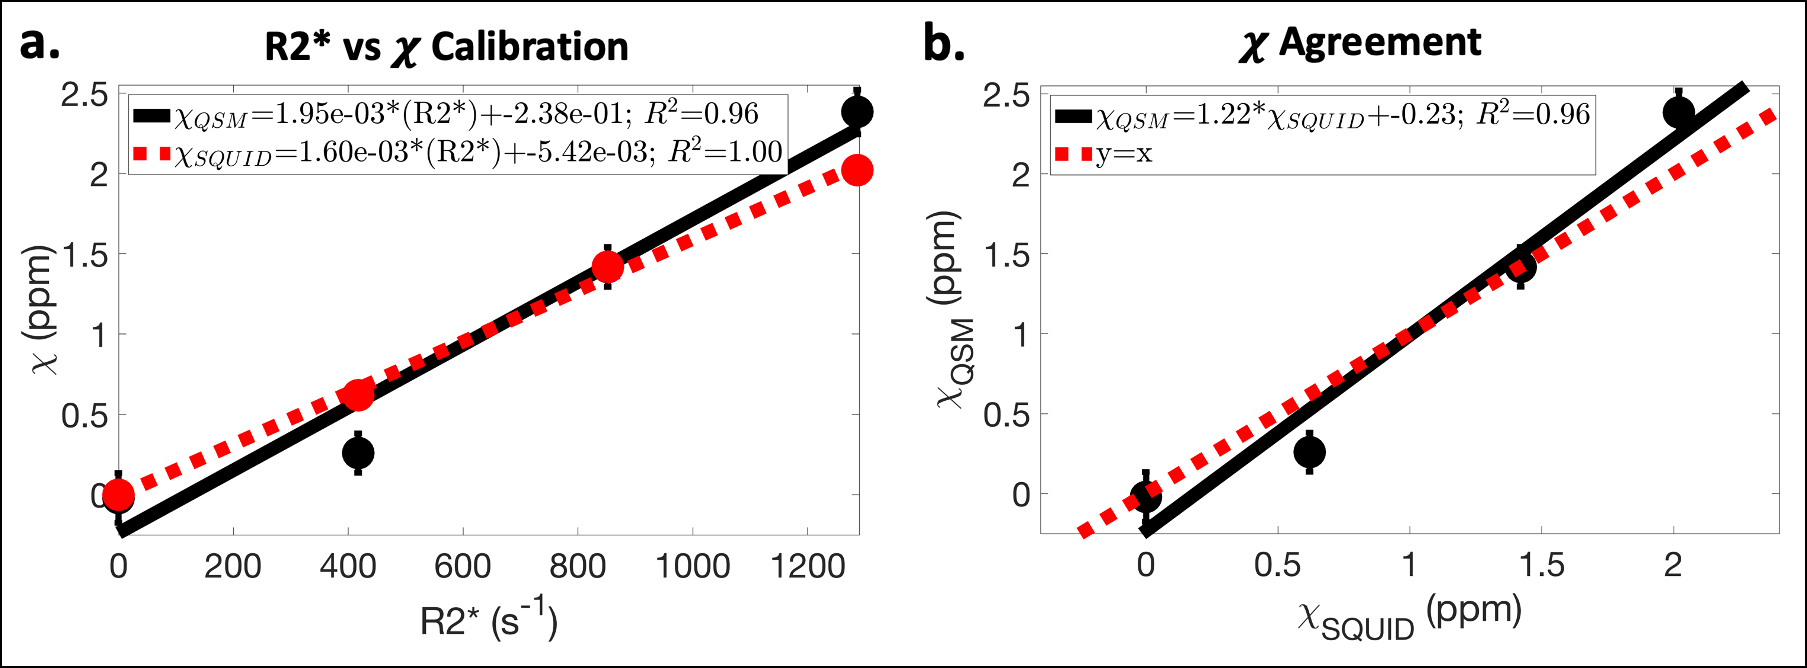
Using SQUID susceptometry, χSQUID agreed relatively well with χNominal with low fitting uncertainty (Δ≤0.02ppm) (Table 1a and Figure 2a). A linear calibration with MnCl2 concentration resulted in χSQUID=0.180*C-0.014ppm (R2=1.00) (Table 1b and Figure 2b), which agrees with the theoretical calibration χTheory=0.180*C ppm.Using MR-based methods, underestimated χQSM was observed for the MnCl2 concentration of 3.8mM, while overestimation was observed at 11.4mM in comparison to χNominal (Table 1a). Linear calibrations with MnCl2 concentration resulted in χQSM=0.220*C-0.246ppm (R2=0.95) (Figure 3a,b) and R2*=113.0*C-5.4s-1 (R2=1.00) (Figure 3c,d), which agree relatively well with the theoretical calibration and previously published results.15
Additionally, the following linear calibrations were obtained with high correlations: χQSM=1.95x10⁻³*(R2*)-0.24ppm (R2=0.96), χSQUID=1.60x10⁻³*(R2*)-5.42x10⁻³ppm (R2=1.00), and χQSM=1.22*χSQUID-0.23ppm (R2=0.96) (Figure 4).
Discussion
In this work, SQUID susceptometry and QSM were used to determine calibrations for χ as a function of MnCl2 concentration. χSQUID estimates demonstrated low uncertainty and excellent agreement with the theoretical calibration, demonstrating SQUID’s potential to be used as an accurate reference measurement of χ.In vivo, QSM has been shown to underestimate χ by approximately half in comparison to SQUID.10 The reason for this discrepancy is unknown; however, it is hypothesized that spatial resolution effects, including large slice thickness, may play a role.10,16-18 In this work, QSM underestimated χ in comparison to SQUID for the MnCl2 concentration of 3.8mM and overestimated χ for 11.4mM. Further phantom validation experiments may help resolve the differences between QSM and SQUID and help identify sources of bias and variability in both methods.
Limitations of this work include evaluation of a single paramagnetic material (MnCl2), evaluation on a single scanner and field strength, MR data acquisition using a single protocol, and determining linear calibrations using only four concentrations which led to broad confidence intervals.
Conclusion
SQUID susceptometry has the potential to identify sources of bias and variability in QSM methods by serving as an independent reference measurement of susceptibility.Acknowledgements
The authors acknowledge support from the NIH (R01-DK117354 and R01-DK100651), the University of Wisconsin-Madison Office of the Vice Chancellor for Research and Graduate Education with funding from the Wisconsin Alumni Research Foundation, as well as from the UW Departments of Radiology and Medical Physics. GE Healthcare also provides research support to the University of Wisconsin. Dr. Reeder is the Fred Lee Sr. Endowed Chair of Radiology.References
1. Colgan TJ, Knobloch G, Reeder SB, Hernando D. Sensitivity of quantitative relaxometry and susceptibility mapping to microscopic iron distribution. Magnetic resonance in medicine. 2020;83(2):673-680.
2. Ghugre NR, Wood JC. Relaxivity‐iron calibration in hepatic iron overload: probing underlying biophysical mechanisms using a Monte Carlo model. Magnetic resonance in medicine. 2011;65(3):837-847.
3. Paulson DN, Fagaly RL, Toussaint RM, Fischer R. Biomagnetic susceptometer with SQUID instrumentation. IEEE Transactions on Magnetics. 1991;27(2):3249-3252.
4. Carneiro AAO, Baffa O, Fernandes JP, Zago MA. Theoretical evaluation of the susceptometric measurement of iron in human liver by four different susceptometers. Physiological measurement. 2002;23(4):683.
5. Fischer R, Piga A, Harmatz P, Nielsen P. Monitoring long‐term efficacy of iron chelation treatment with biomagnetic liver susceptometry. Annals of the New York Academy of Sciences. 2005;1054(1):350-357.
6. Fischer R, Tiemann CD, Engelhardt R, et al. Assessment of iron stores in children with transfusion siderosis by biomagnetic liver susceptometry. American journal of hematology. 1999;60(4):289-299.
7. Nielsen P, Engelhardt R, Duerken M, Janka GE, Fischer R. Using SQUID biomagnetic liver susceptometry in the treatment of thalassemia and other iron loading diseases. Transfusion science. 2000;23(3):257-258.
8. Sheth S. SQUID biosusceptometry in the measurement of hepatic iron. Pediatric radiology. 2003;33(6):373-377.
9. Carneiro AAO, Fernandes JP, de Araujo DB, et al. Liver iron concentration evaluated by two magnetic methods: magnetic resonance imaging and magnetic susceptometry. Magnetic Resonance in Medicine: An Official Journal of the International Society for Magnetic Resonance in Medicine. 2005;54(1):122-128.
10. Sharma SD, Fischer R, Schoennagel BP, et al. MRI‐based quantitative susceptibility mapping (QSM) and R2* mapping of liver iron overload: Comparison with SQUID‐based biomagnetic liver susceptometry. Magnetic resonance in medicine. 2017;78(1):264-270.
11. Fischer R, Farrell D. Liver iron susceptometry. Magnetism in medicine: a handbook. 2006:529-549.
12. Hernando D, Kellman P, Haldar JP, Liang ZP. Robust water/fat separation in the presence of large field inhomogeneities using a graph cut algorithm. Magnetic Resonance in Medicine: An Official Journal of the International Society for Magnetic Resonance in Medicine. 2010;63(1):79-90.
13. Sharma SD, Hernando D, Horng DE, Reeder SB. Quantitative susceptibility mapping in the abdomen as an imaging biomarker of hepatic iron overload. Magnetic resonance in medicine. 2015;74(3):673-683.
14. Velikina JV, Zhao R, Buelo CJ, Samsonov AA, Reeder SB, Hernando D. Data Adaptive Regularization for Abdominal Quantitative Susceptibility Mapping. arXiv preprint arXiv:220711416. 2022;
15. Zhao R, Hamilton G, Brittain JH, Reeder SB, Hernando D. Design and evaluation of quantitative MRI phantoms to mimic the simultaneous presence of fat, iron, and fibrosis in the liver. Magnetic Resonance in Medicine. 2021;85(2):734-747.
16. Zhou D, Cho J, Zhang J, Spincemaille P, Wang Y. Susceptibility underestimation in a high‐susceptibility phantom: dependence on imaging resolution, magnitude contrast, and other parameters. Magnetic resonance in medicine. 2017;78(3):1080-1086.
17. Liu S, Wang C, Zhang X, et al. Quantification of liver iron concentration using the apparent susceptibility of hepatic vessels. Quantitative imaging in medicine and surgery. 2018;8(2):123.
18. Karsa A, Punwani S, Shmueli K. The effect of low resolution and coverage on the accuracy of susceptibility mapping. Magnetic resonance in medicine. 2019;81(3):1833-1848.
Figures