1039
Towards microstructure-informed QSM: A digital phantom study1Center for functionally integrative neuroscience, department of clinical medicine, Aarhus University, Aarhus, Denmark, 2Division of Medical Physics, Department of Radiology, University Medical Center Freiburg, Freiburg, Germany, 3Champalimaud Research, Champalimaud Centre for the Unknown, Lisbon, Portugal, 4Department of Phsysics and Astronomy, Aarhus University, Aarhus, Denmark
Synopsis
Keywords: Susceptibility, Quantitative Susceptibility mapping
Magnetic susceptibility can provide valuable information about chemical composition and microstructural organization in tissues. However, its estimation from the MRI signal phase is particularly difficult, as it depends on both magnetic tissue properties on all length scales. Here we investigate the feasibility of inverting our recently presented model of WM magnetic microstucture to estimate susceptibility. This is done on a digital brain phantom based on actual dMRI measurements of an ex-vivo mouse brain at ultra-high field.Introduction
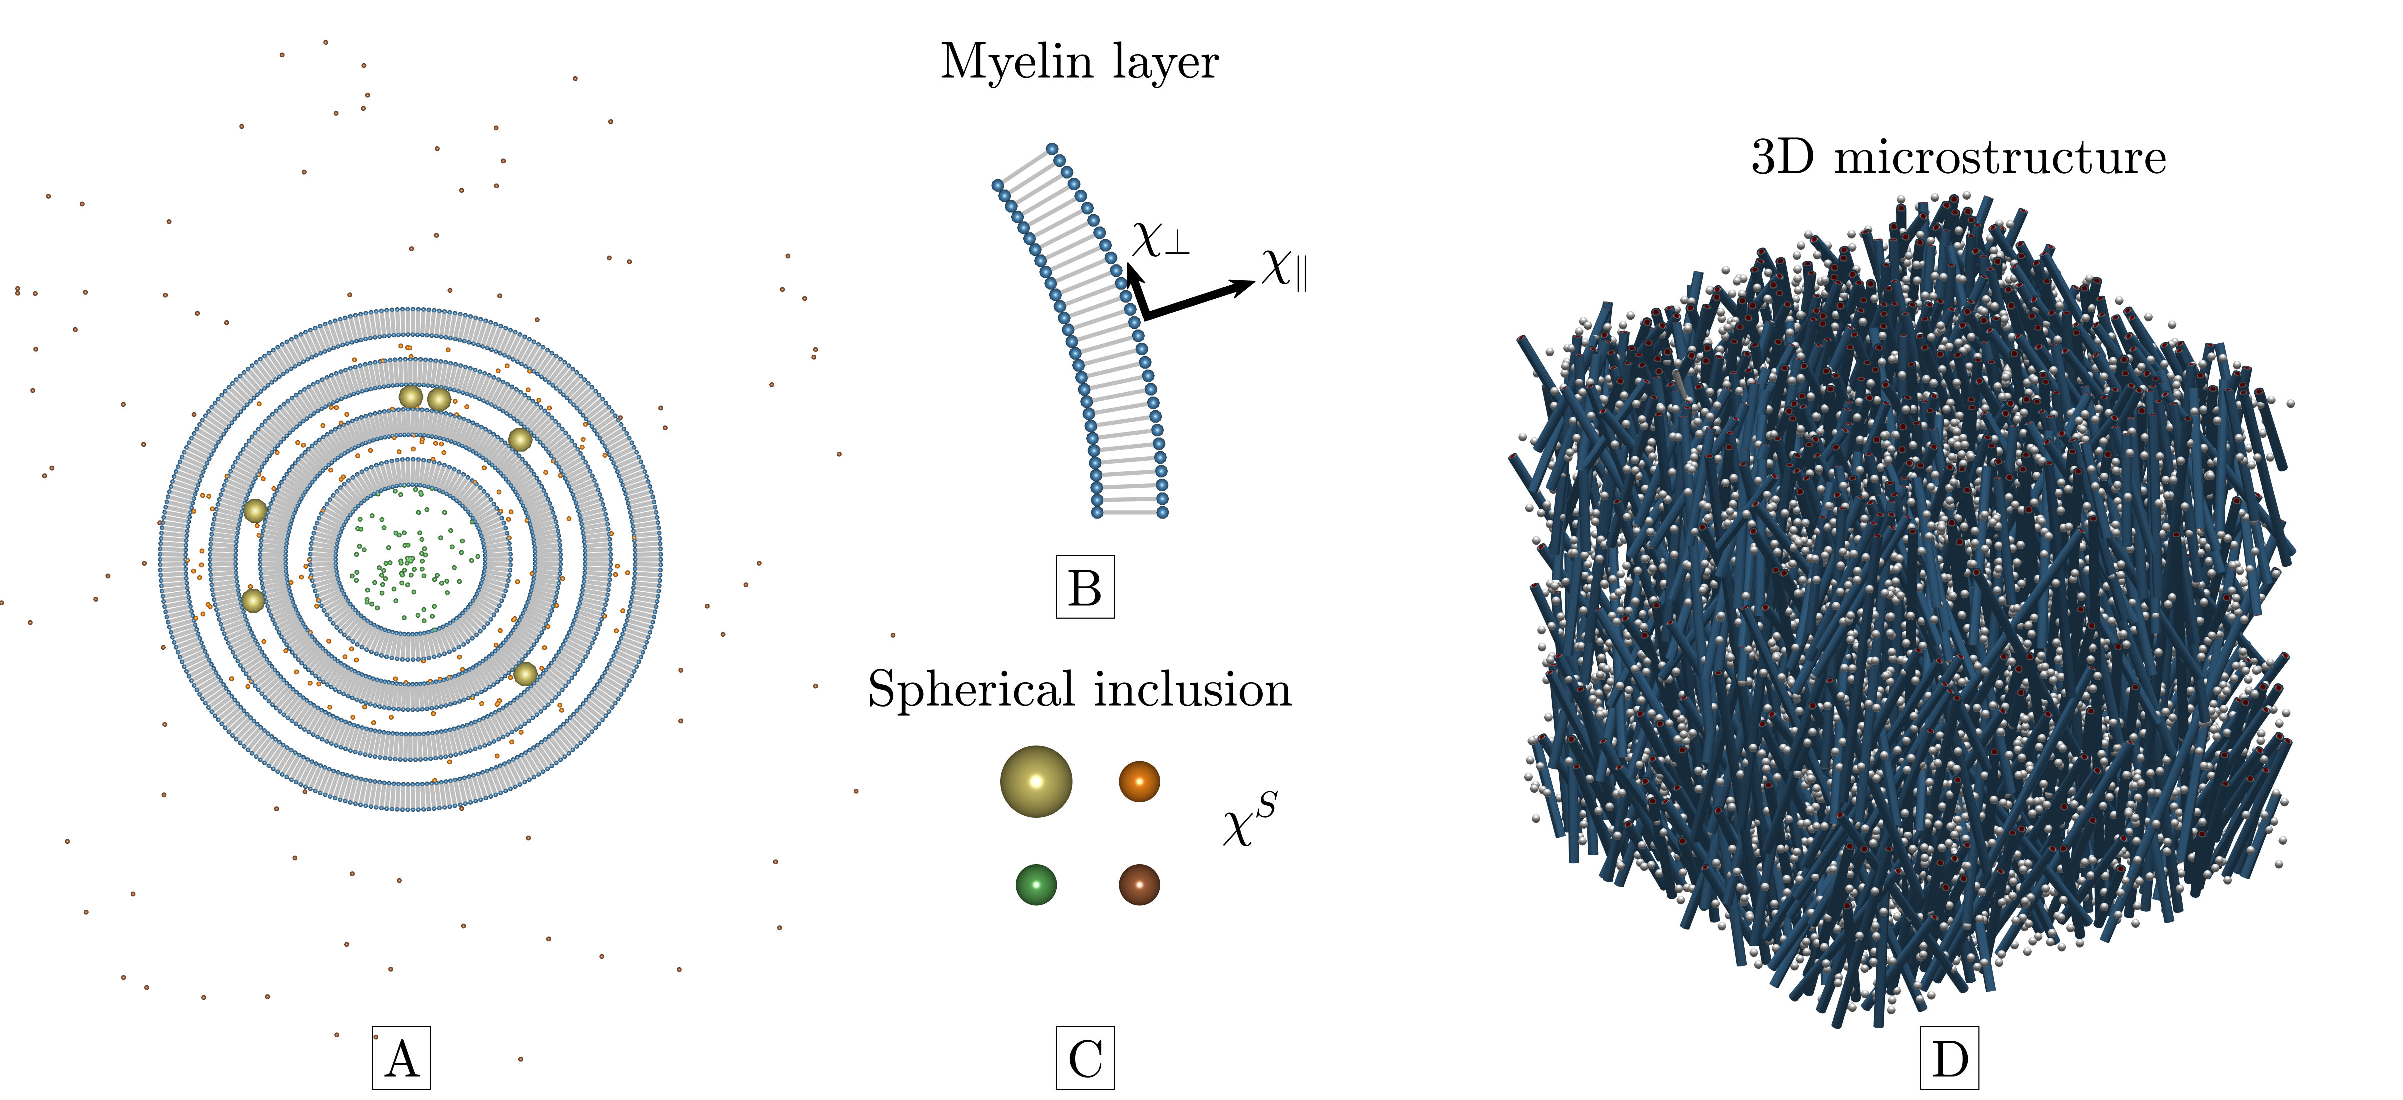
Magnetic susceptibility can provide valuable information about chemical composition and microstructural organization in tissues. However, its estimation from the MRI signal phase is particularly difficult, as it depends on both microscopic, mesoscopic and macroscopic1-5 scales. We recently presented6 a magnetic microstructure model of white matter (WM) that incorporates all these length scales (micro, meso, macro). Axons are modeled as multilayered cylinders with both axially symmetric susceptibility anisotropy and arbitrary orientation dispersion, in addition to spheres with isotropic susceptibility in all water compartments (Figure 1). Here we investigate the feasibility of inverting this model to estimate susceptibility using a simple iterative least squares approach without regularization or by weighting the least squares sum by e.g., the reciprocal of the variance. We outline the requirements in terms of phase SNR, number of orientations and maximum tilt angle, as these are limiting factors in clinical settings. This is done on a digital brain phantom based on actual dMRI measurements of an ex-vivo mouse brain at ultra-high field.Methods
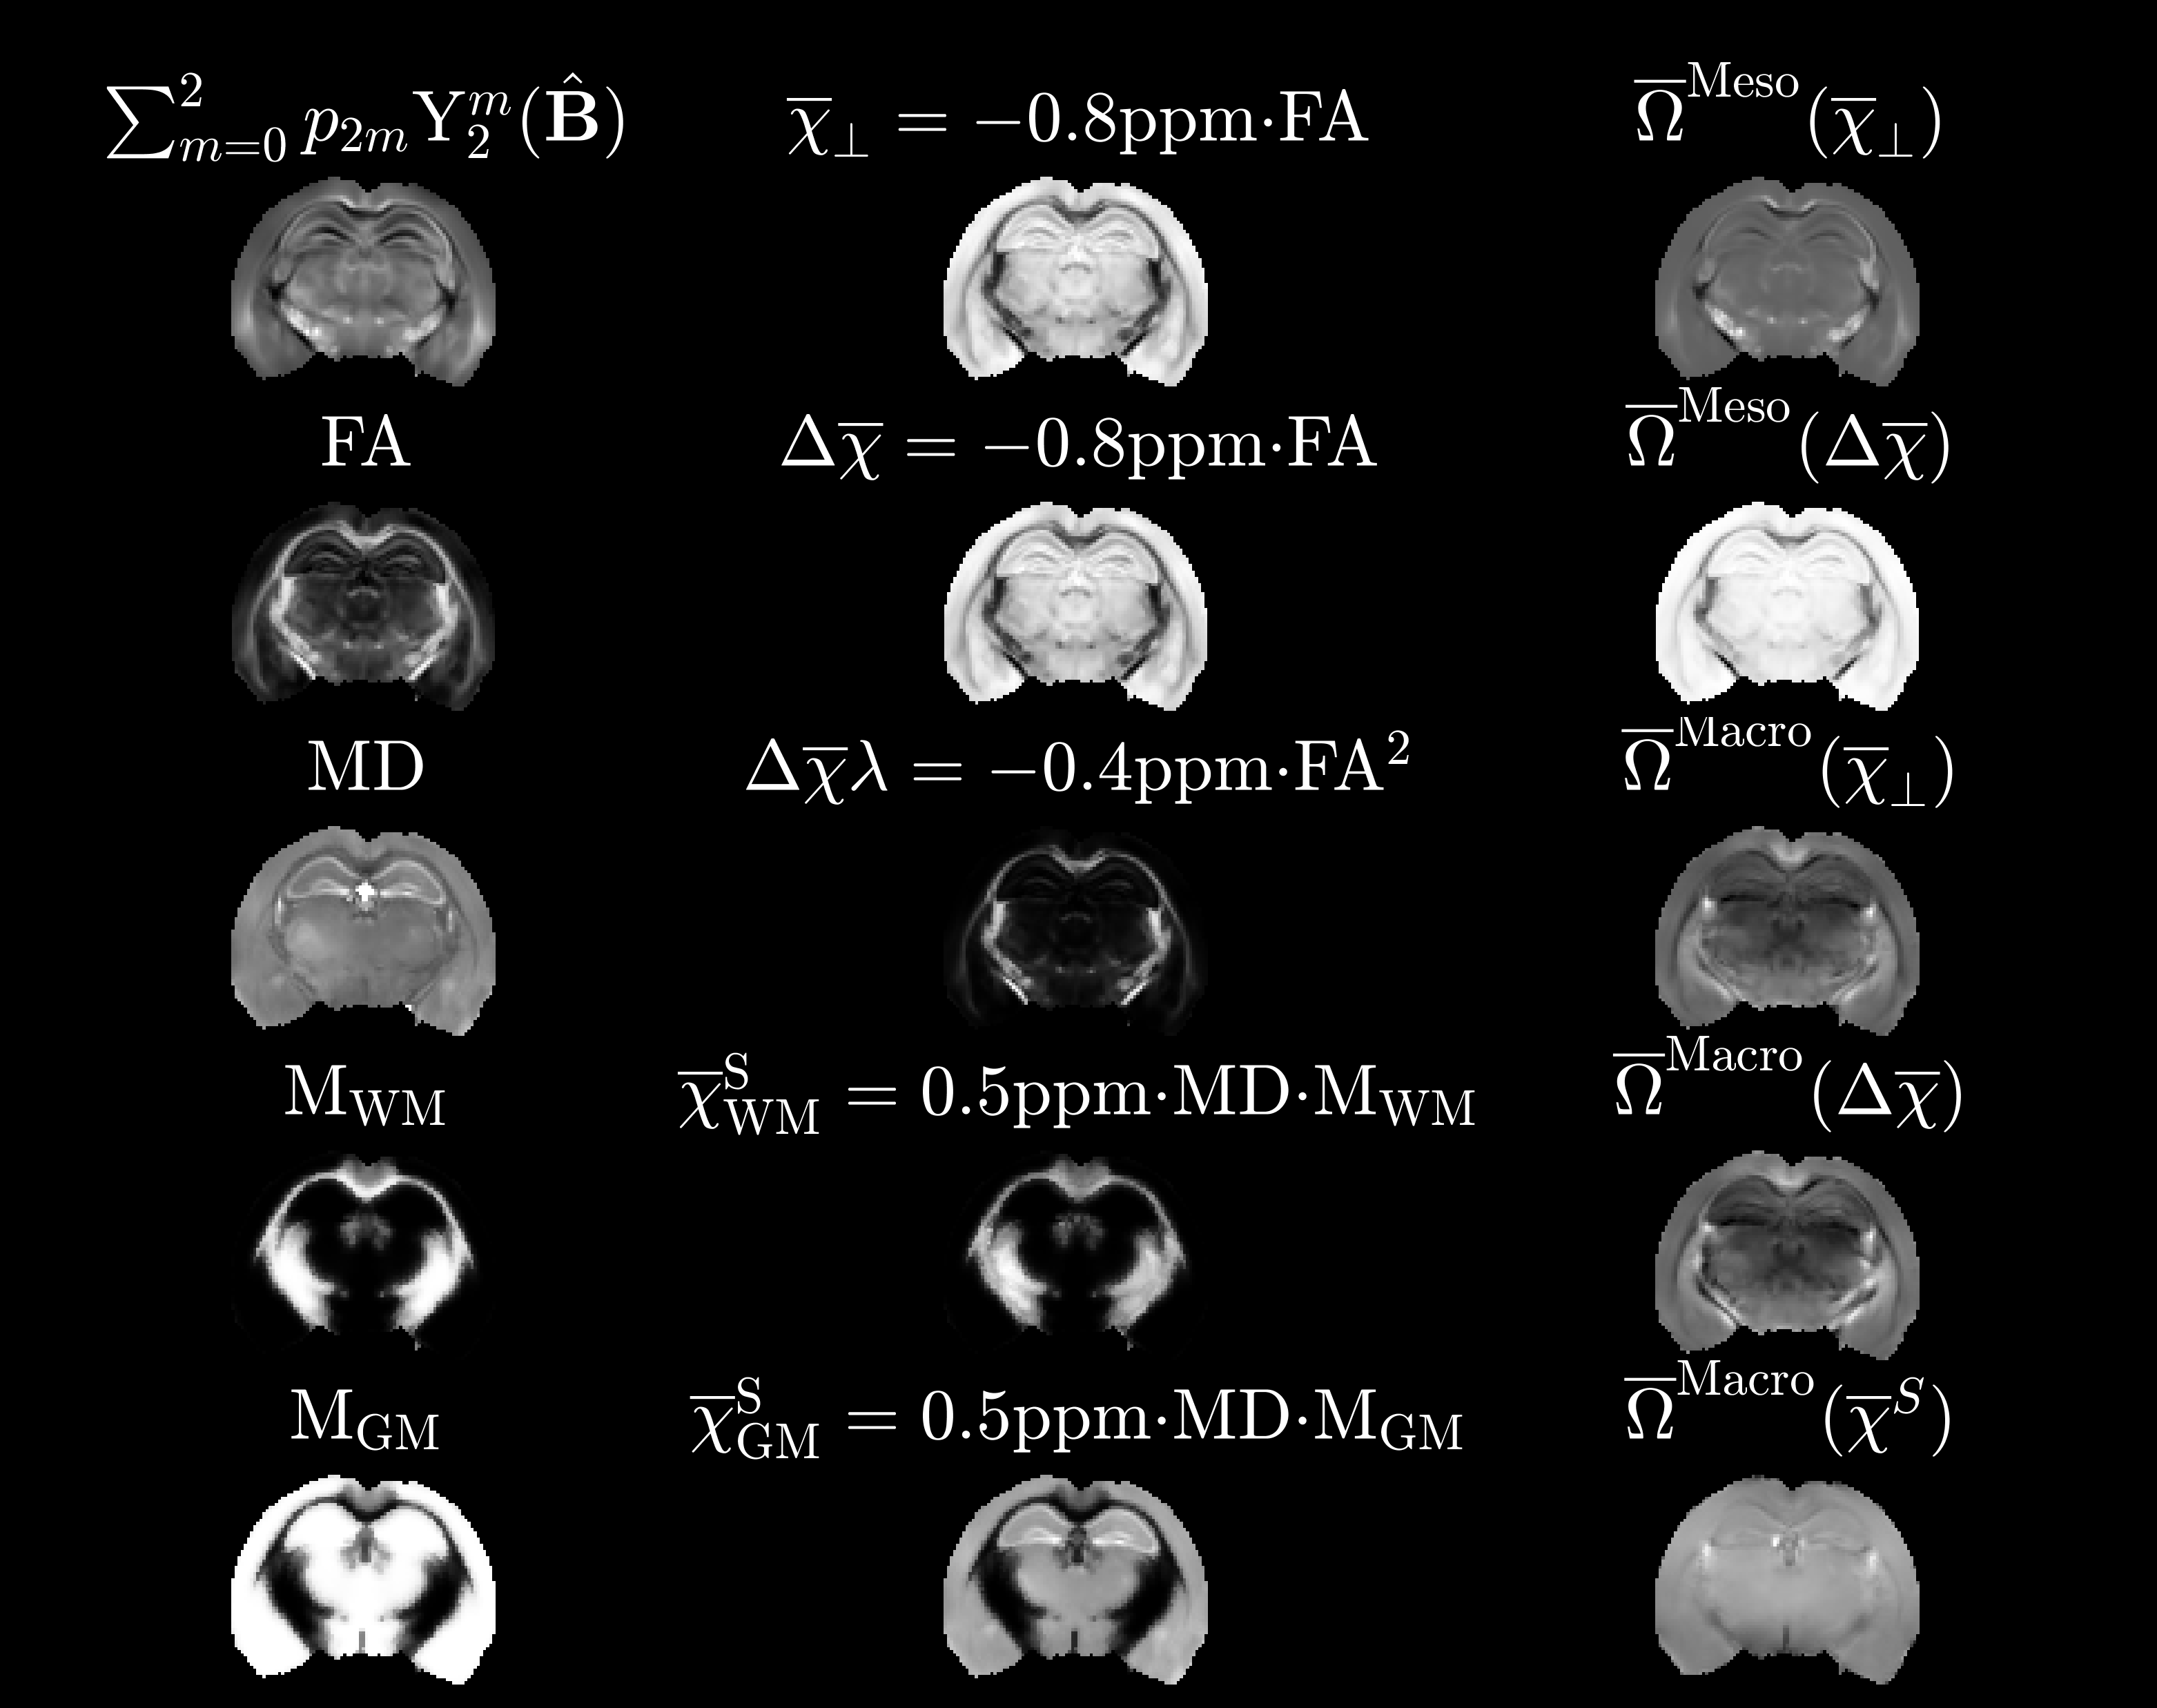
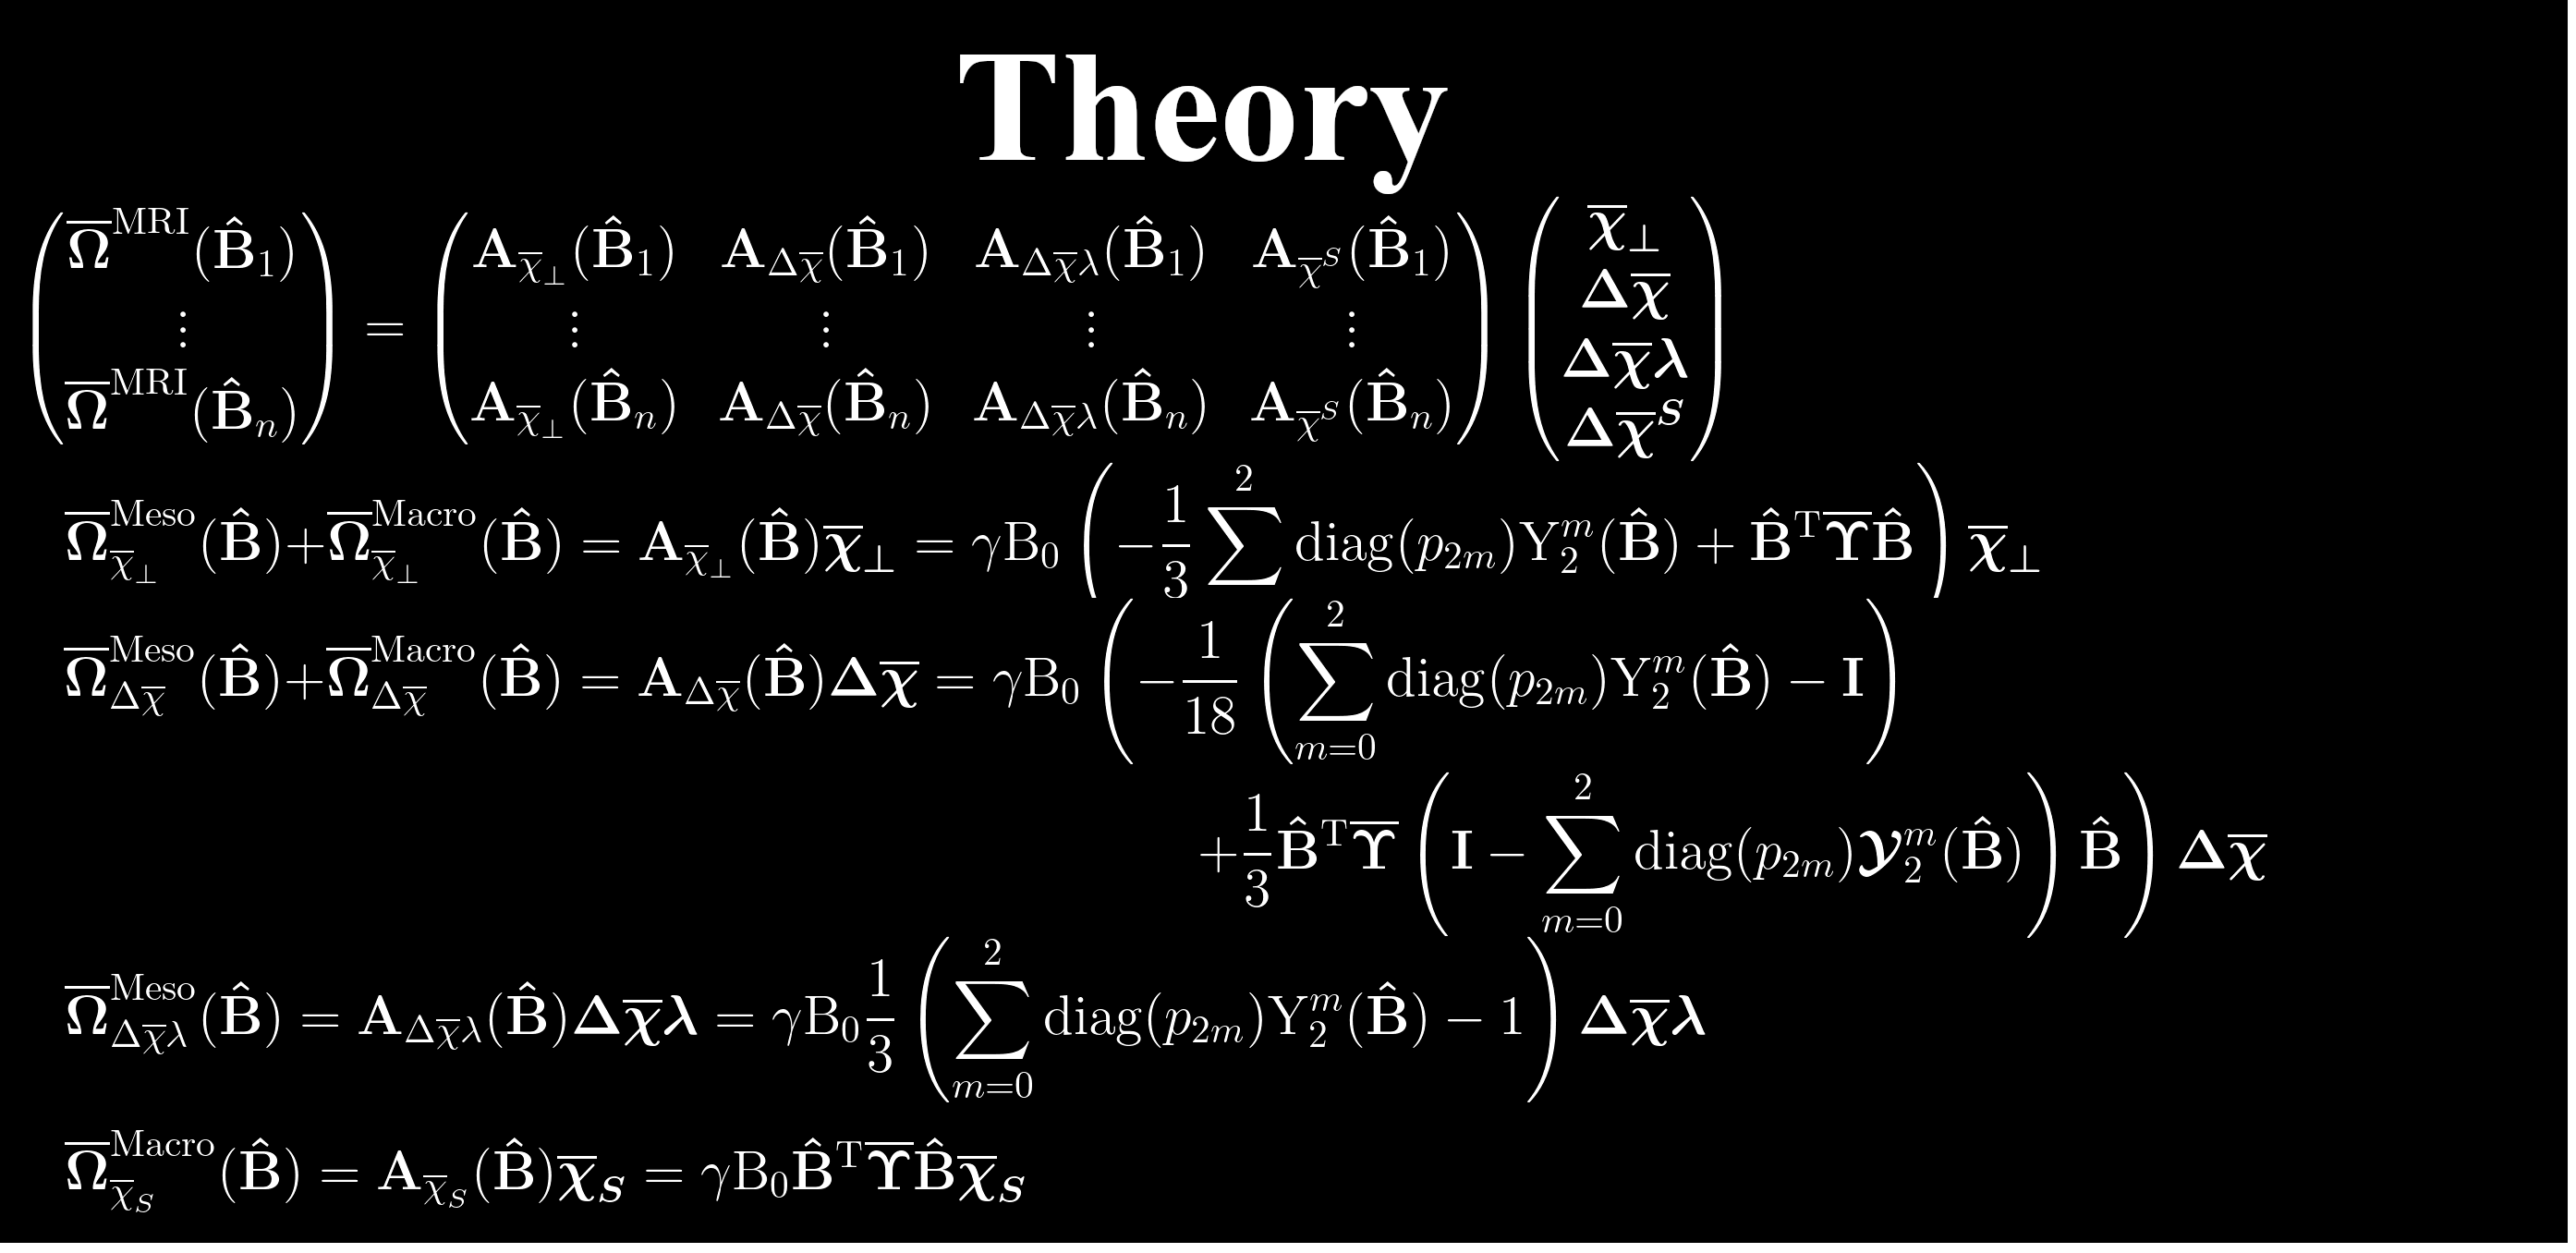
Figure 2 outlines the digital phantom construction. It is based on dMRI measurements of an ex-vivo mouse brain at 16.4T in the spirit of Wharton and Bowtell7. We segmented the brain into gray and white matter from b0 images using SPM. From DKI8 fitting (b=0,3,5ms/µm2, 30 dir.) we extracted FA and MD. Laplace expansion coefficients of the fODF, $$$p_{2m}$$$, were estimated using FBI9 (b=10ms/µm2, 75 dir.). From these, we synthesized 4 microscopic biophysical parameters $$$\overline\chi_\perp$$$, $$$\Delta\overline\chi$$$, $$$\lambda$$$ and $$$\overline\chi^S$$$ that would subsequently need to be estimated in each voxel. Here, $$$\overline\chi_\perp$$$ and $$$\Delta\overline\chi$$$ are the bulk perpendicular magnetic susceptibility and anisotropy of the WM axons, respectively, while $$$\lambda$$$ is a combined parameter depending both on the axons internal water fractions and the thickness of bilayers5. $$$\overline\chi^S=\overline\chi^S_{WM}+\overline\chi^S_{GM}$$$ are the bulk susceptibilities from extra-axonal spheres in gray matter (GM) and WM (see Figure 1 for more details). The resulting Larmor frequencies from each of these “sources” are $$$\overline\Omega^\mathrm{Meso}_{\overline\chi_\perp}(\mathbf{\hat{B}})+\overline\Omega^\mathrm{Macro}_{\overline\chi_\perp}(\mathbf{\hat{B}})$$$, $$$\overline\Omega^\mathrm{Meso}_{\Delta\overline\chi}(\mathbf{\hat{B}})+\overline\Omega^\mathrm{Macro}_{\Delta\overline\chi}(\mathbf{\hat{B}})$$$, $$$\overline\Omega^\mathrm{Meso}_{\Delta\overline\chi\lambda}(\mathbf{\hat{B}})$$$ and $$$\overline\Omega^\mathrm{Macro}_{\overline\chi^S}(\mathbf{\hat{B}})$$$ and computed according to our theory5 with results reproduced in Figure 3. Their sum defines the total MRI Larmor frequency shift $$$\overline\Omega_\mathrm{MRI}(\mathbf{\hat{B}})$$$ for a given orientation $$$(\mathbf{\hat{B}})$$$. Figure 2 shows the susceptibility and noiseless frequency maps. We used the LSMR5 algorithm to solve the inverse problem of extracting susceptibilities for a given number of sampling orientations (made using electrostatics repulsion scheme) and with added gaussian noise $$$\epsilon\sim N(0,\sigma^2(\overline\Omega_\mathrm{MRI})/\mathrm{SNR}^2)$$$ and maximum polar angle of sample rotation. The solution with the lowest RMSE compared to ground truth during fitting was chosen for analysis.Results and Discussion
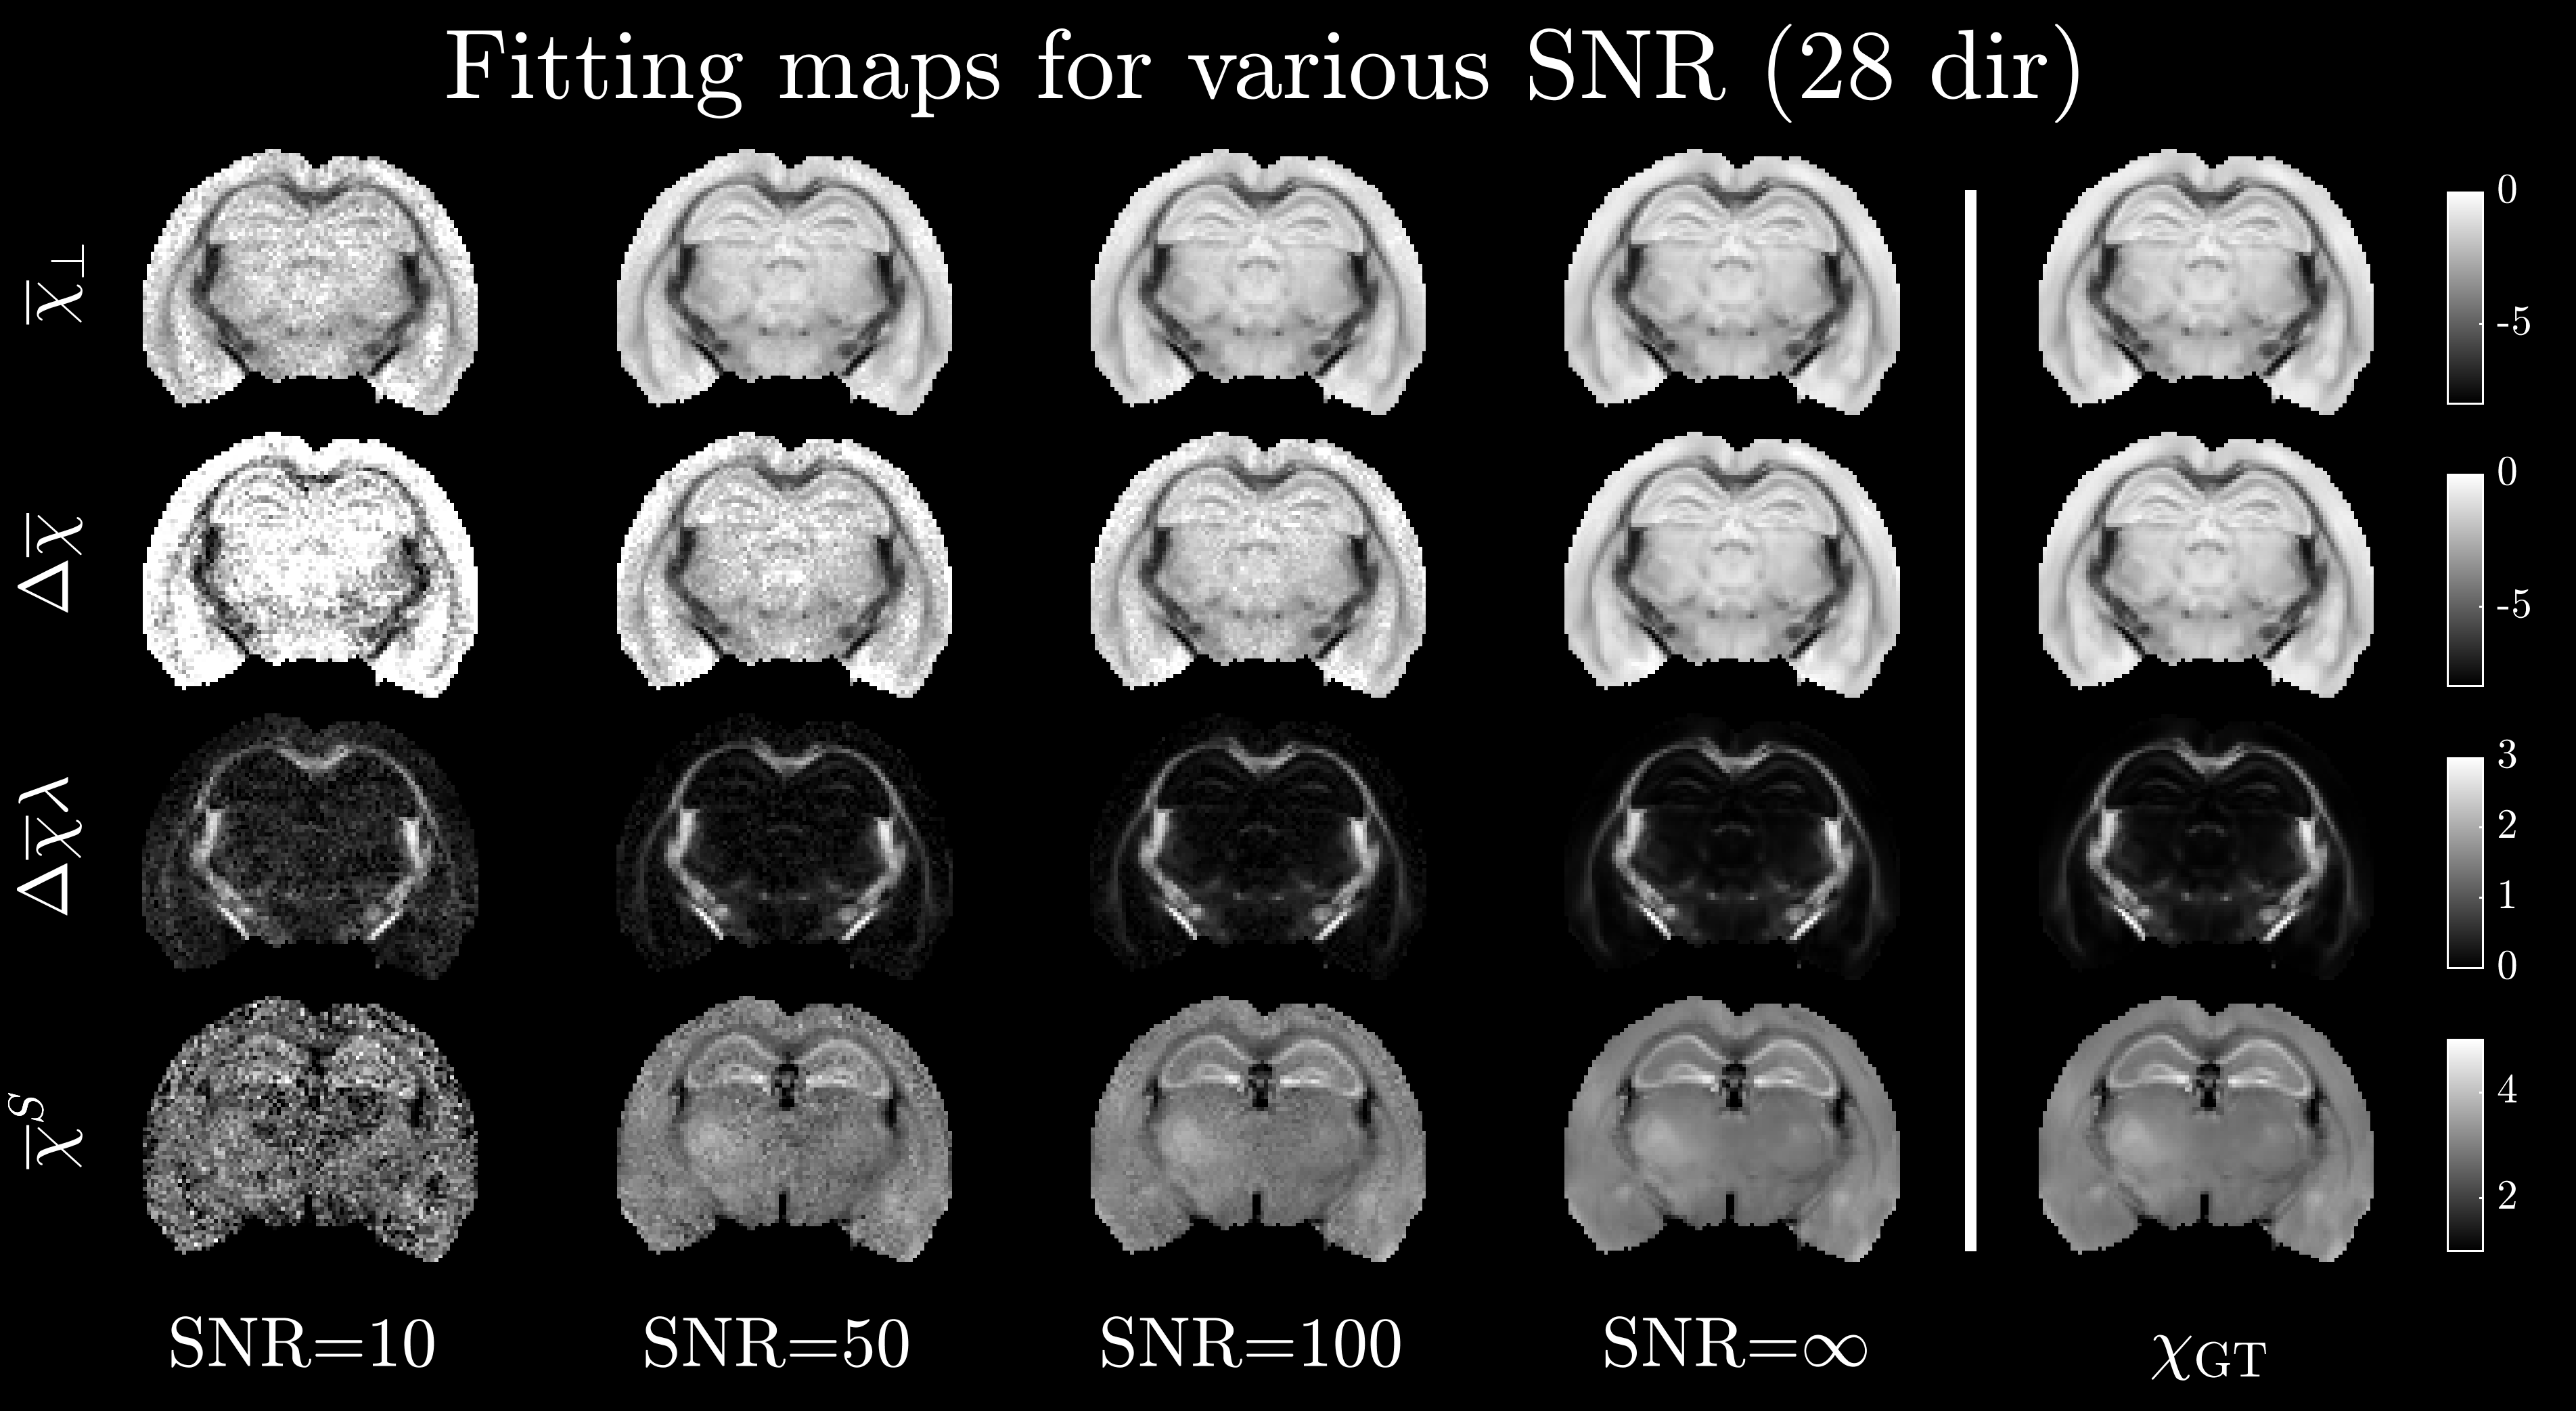
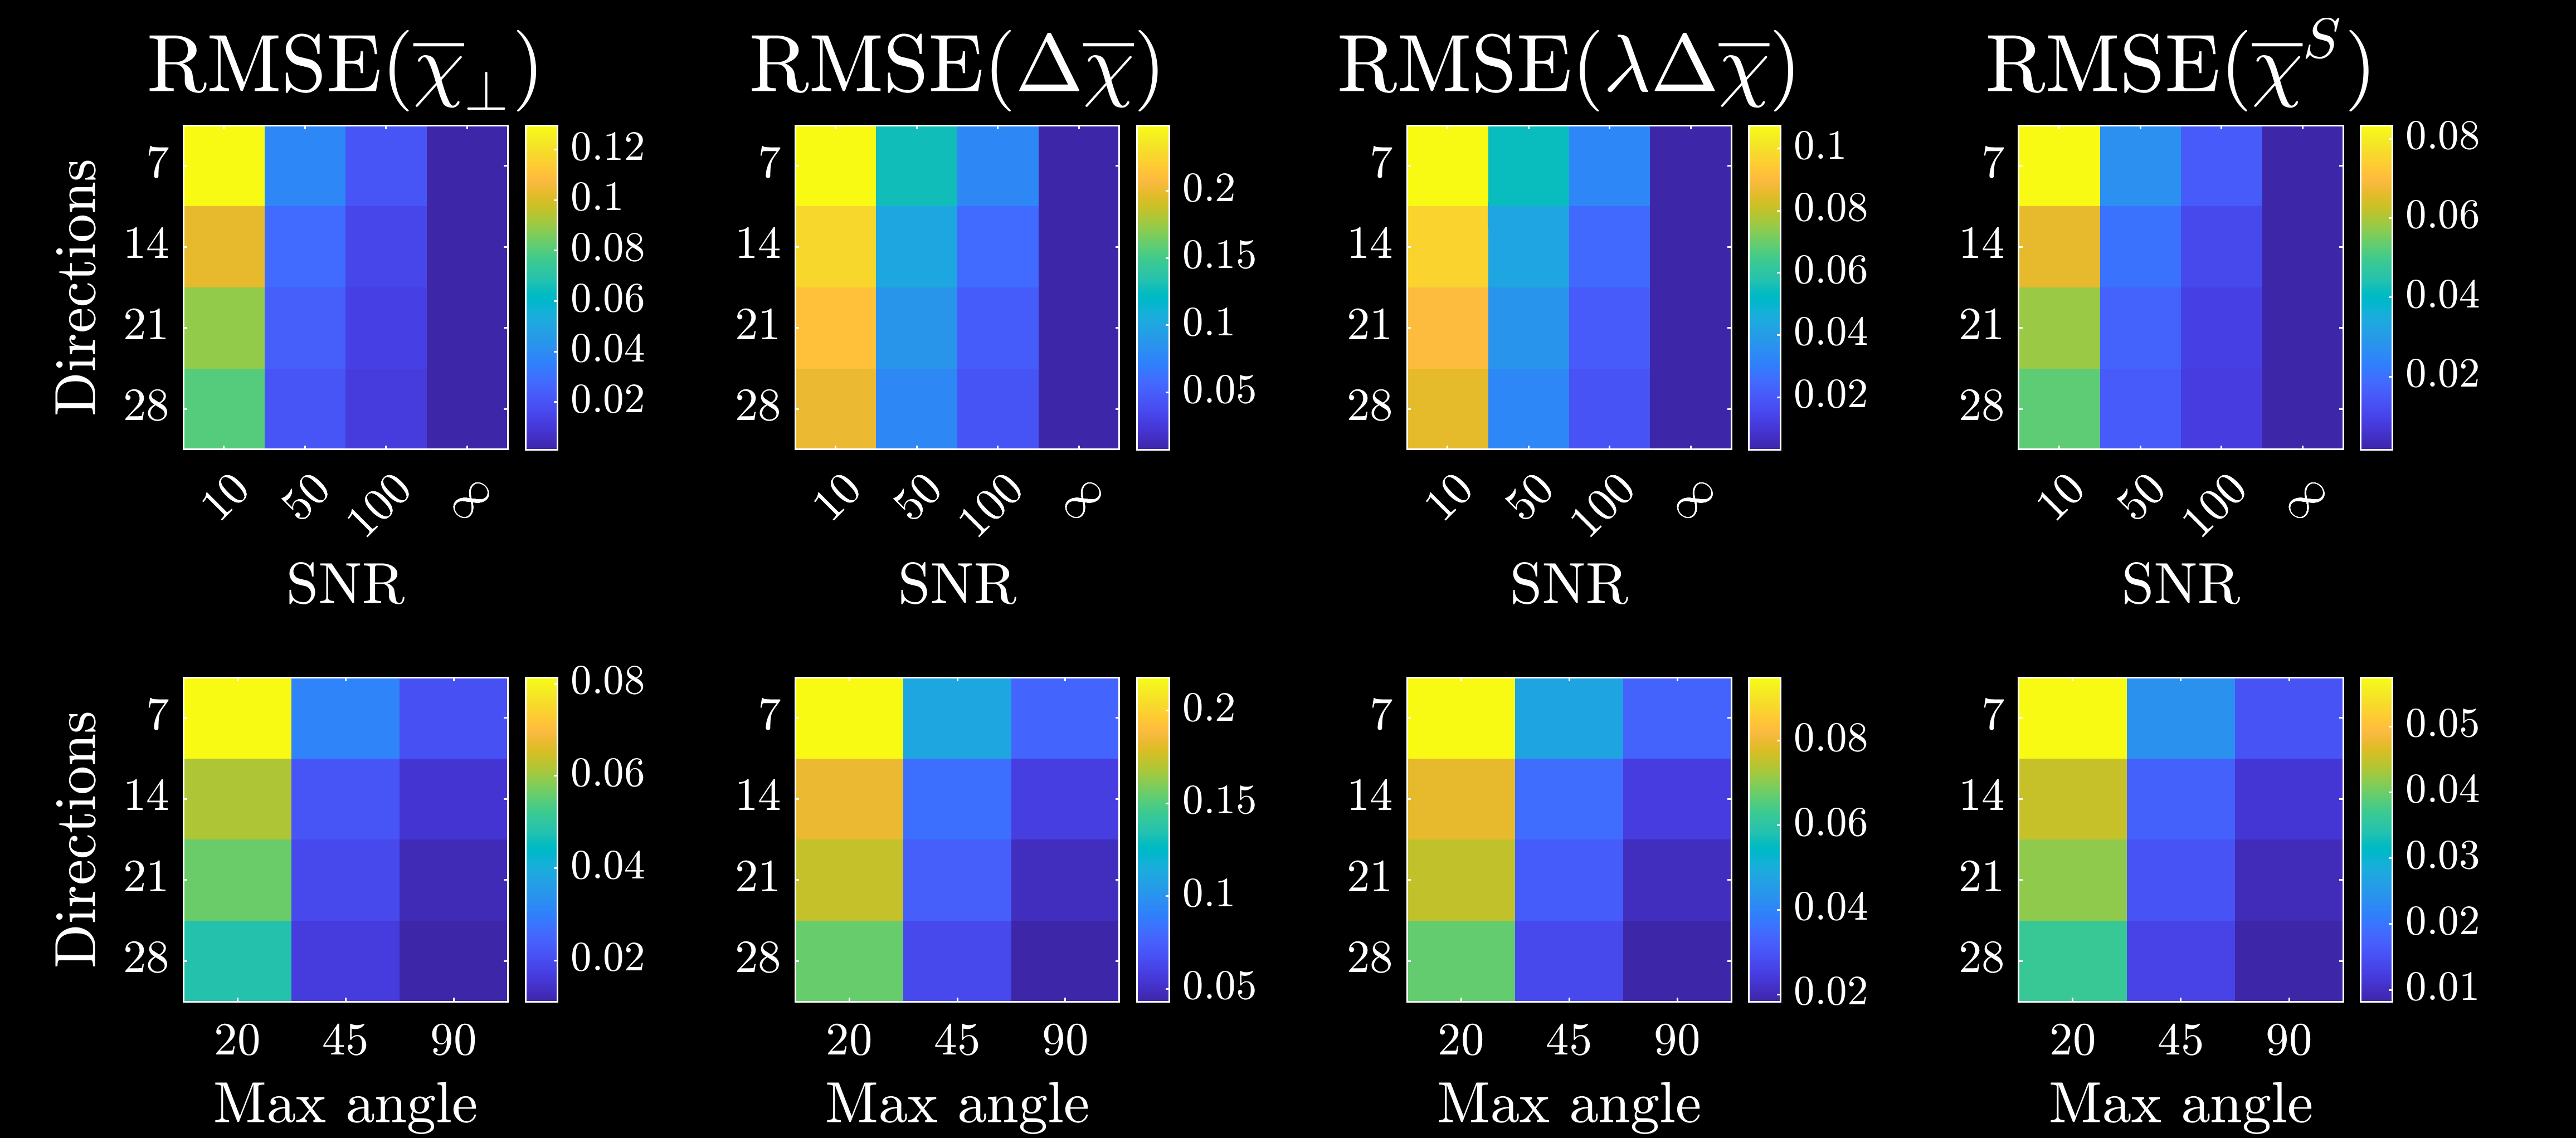
Figure 4 and 5 shows the fitting results and normalized RMSE, respectively, for each of the four susceptibilities (each normalized by the difference between maximum and minimum of the respective ground truth susceptibilities). At an SNR=50-100, all parameters were below 12% RMSE across all numbers of orientations. We could thus achieve a reasonable fitting accuracy for 7 orientations and realistic phase SNR. Furthermore, while decreasing the maximum tilt angle increased the RMSE, it did not completely erode the accuracy (still within 12% for SNR=100 and maximum angle of 45 degrees). This increases the feasibility of performing such experiments on humans in vivo, where maximum tilt angle and number of orientations are limiting factors. The reason we can estimate parameters for smaller tilt angles is that the tensor structure is already determined from diffusion (through $$$p_{2m}$$$). This leaves only 4 orientationally invariant susceptibilities to be determined in each voxel. Qualitatively, the maps still appear slightly noisy, especially $$$\overline\chi^S$$$ in GM. This is sensible as $$$\overline\chi^S$$$ only has a macroscopic contribution $$$\overline\Omega^\mathrm{Macro}_{\overline\chi^S}(\mathbf{\hat{B}})$$$ to the Larmor frequency $$$\overline\Omega_\mathrm{MRI}(\mathbf{\hat{B}})$$$, and is difficult to disentangle from $$$\overline\chi_\perp$$$, when $$$\overline\Omega^\mathrm{Meso}_{\overline\chi_\perp}(\mathbf{\hat{B}})$$$ is close to zero in a given voxel (similar functional behavior). Weighted least squares or regularization may help to decrease such artifacts and reduce RMSE even further. This will be explored in future studies.Conclusion
We demonstrated the feasibility of fitting our full white matter magnetic microstructure model1, incorporating both magnetic and structural anisotropy of axons and extra-axonal iron complexes. Using simple iterative least squares without regularization, we could achieve reasonable accuracies in parameter estimation for a realistic number of sample orientations, SNR and maximum tilt angle of the sample. We believe this result can open the way towards more specific susceptibility estimations, which could provide a promising tool for studying tissue chemical composition with MRI.Acknowledgements
This study is funded by the Independent Research Fund Denmark (grant 8020-00158B).References
1He, X. & Yablonskiy, D. A. Biophysical mechanisms of phase contrast in gradient echo MRI. Proc. Natl. Acad. Sci. U. S. A. 106, 13558–13563 (2009).
2Yablonskiy, D. A. & Sukstanskii, A. L. Generalized Lorentzian Tensor Approach (GLTA) as a biophysical background for quantitative susceptibility mapping. Magn. Reson. Med. 73, 757–764 (2015).
3Ruh, A., Scherer, H. & Kiselev, V. G. The larmor frequency shift in magnetically heterogeneous media depends on their mesoscopic structure. Magn. Reson. Med. 79, 1101–1110 (2018).
4Kiselev, V. G. Larmor frequency in heterogeneous media. J. Magn. Reson. 299, 168–175 (2019).
5Sandgaard, AD, Shemesh, N, Kiselev, VG, Jespersen, SN. Larmor frequency shift from magnetized cylinders with arbitrary orientation distribution. NMR in Biomedicine. 2022;e4859. https://doi.org/10.1002/nbm.4859
6Sandgaard AD, Kiselev VG, Shemesh N, Jespersen SN. The Larmor Frequency of a White Matter Magnetic Microstructure Model with Multiple Sources. In: ISMRM. ISMRM 2022; 2022.
7Wharton S, Bowtell R. Effects of white matter microstructure on phase and susceptibility maps. Magn Reson Med. 2015;73(3):1258-1269. doi:10.1002/mrm.25189
8Jensen JH, Helpern JA, Ramani A, Lu H, Kaczynski K. Diffusional kurtosis imaging: The quantification of non-Gaussian water diffusion by means of magnetic resonance imaging. Magn Reson Med. 2005;53(6):1432-1440. doi:10.1002/mrm.20508
9Jensen JH, Russell Glenn G, Helpern JA. Fiber ball imaging. Neuroimage. 2016;124(Pt A):824-833. doi:10.1016/j.neuroimage.2015.09.049
10Fong DCL, Saunders M. LSMR: An iterative algorithm for sparse least-squares problems. In: SIAM Journal on Scientific Computing. Vol 33. Society for Industrial and Applied Mathematics; 2011:2950-2971. doi:10.1137/10079687X
Figures