1037
Optogenetic fMRI reveals neural adaptation properties beyond local olfactory circuits1Laboratory of Biomedical Imaging and Signal Processing, The University of Hong Kong, Hong Kong SAR, China, 2Department of Electrical and Electronic Engineering, The University of Hong Kong, Hong Kong SAR, China, 3Department of Diagnostic Radiology, Li Ka Shing Faculty of Medicine, The University of Hong Kong, Hong Kong SAR, China, 4School of Biomedical Sciences, Li Ka Shing Faculty of Medicine, The University of Hong Kong, Hong Kong SAR, China
Synopsis
Keywords: Brain Connectivity, Neuroscience
Olfactory adaptation due to repeated odor cues has been studied extensively by fMRI or electrophysiology studies in several primary olfactory regions (i.e., anterior olfactory nucleus, AON, and piriform cortex, Pir). However, the modulatory role of other primary olfactory regions (e.g., amygdala and entorhinal cortex) and their integrations with high-order olfactory regions during olfactory adaptation is likely underestimated due to the documented weak and unstable responses at regions beyond AON and Pir with conventional presentation of odor stimuli. Here, we deployed an optogenetic fMRI approach to improve sensitivity in detecting olfactory responses and examine their adaptation at the systems level.Purpose
Habituation/neural adaptation is a form of simple memory that describes the decreased responses to repeated or continuous stimuli1,2. Olfactory adaptation has been shown to occur at primary olfactory regions such as the olfactory bulb (OB), anterior olfactory nucleus (AON) and piriform cortex (Pir)3,4. However, recent electrophysiological studies suggest that the neural mechanism(s) of olfactory adaptation could involve circuits beyond the present consensus at OB, AON and Pir3,5,6. Olfactory fMRI is hence pivotal in examining adaptation across the long-range olfactory pathways but has so far been unable to robustly delineate regions and olfactory adaptation beyond OB, AON and Pir7-9. This is likely due to the lower sensitivity in detecting olfactory responses to odor presentation in other regions and technical challenge faced in ensuring an effective odorant stimulus delivery.In this study, we deployed fMRI in combination with optogenetic stimulation of the excitatory neurons of OB to examine olfactory adaptation at the systems level. We have shown previously that optogenetic fMRI was able to robustly visualize and characterize activations at various downstream targets of OB10,11, notably at higher-order olfactory regions such as the hippocampal formation (i.e., hippocampus, HP and entorhinal cortex, Ent), amygdala (Amg), striatum and non-olfactory sensorimotor cortices that were not shown with conventional olfactory fMRI. The need to examine the properties of long-range olfactory pathways cannot be understated as it will be vital to designing effective therapeutic measures for olfactory dysfunctions such as with aging12, neurodegenerative diseases13 and recently COVID-1914,15, which at present remain poorly understood at the systems level.
Methods
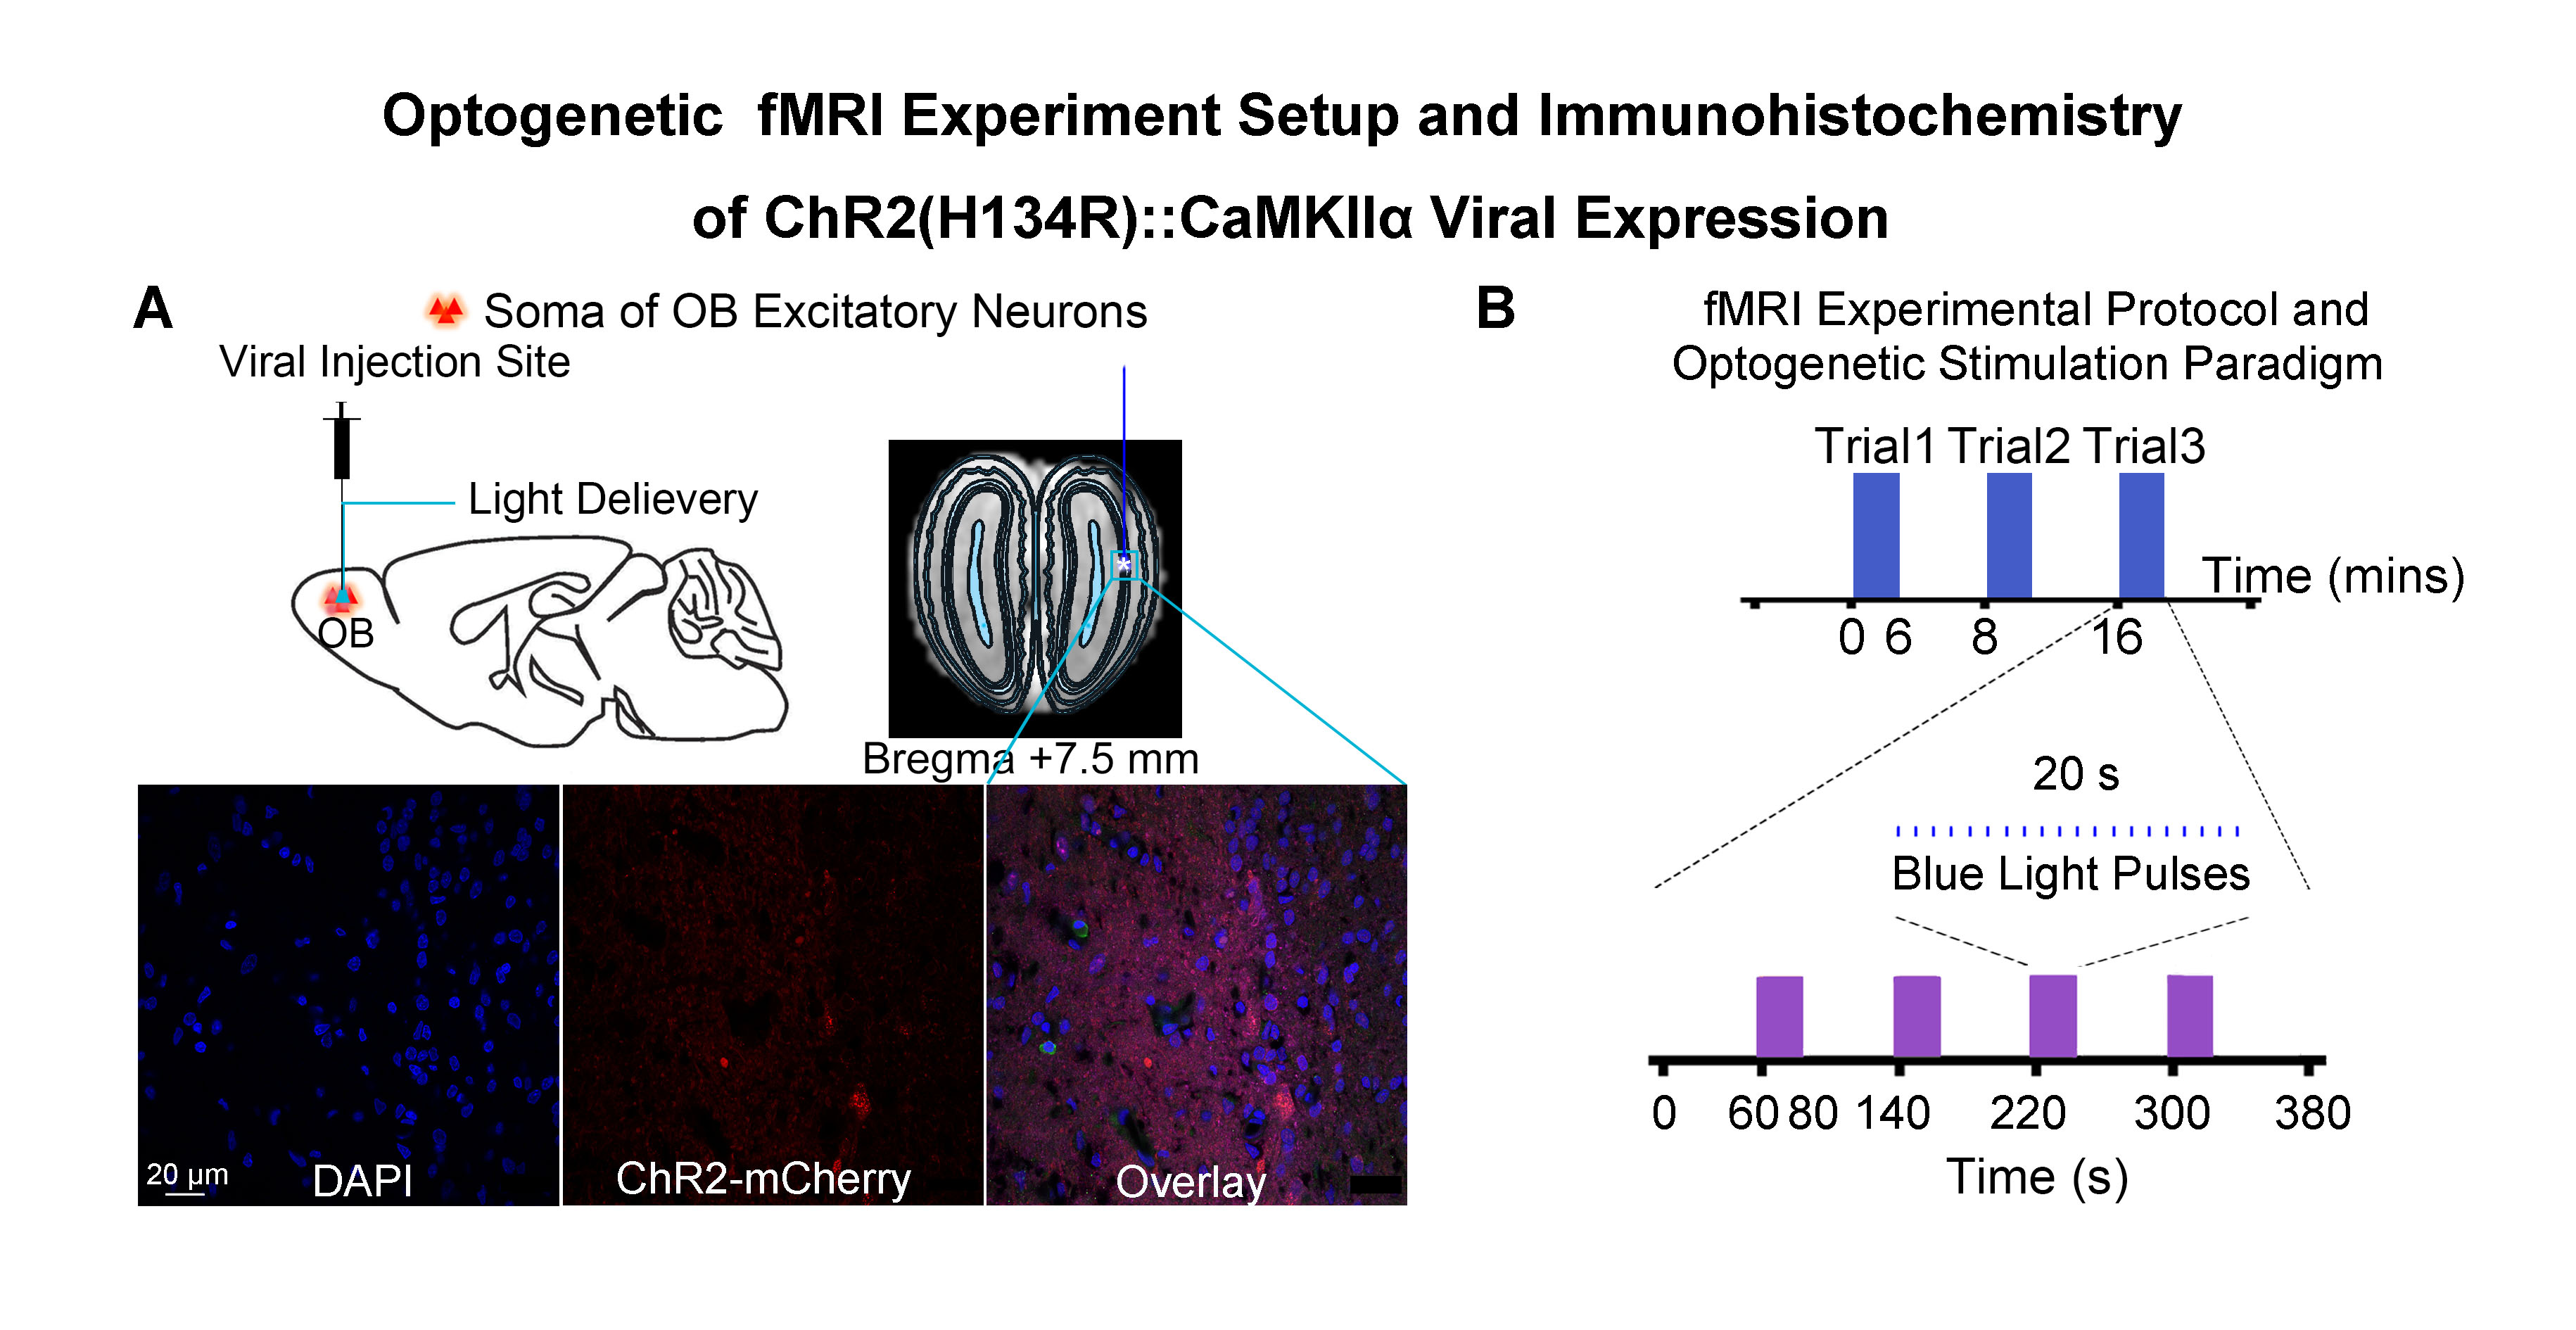
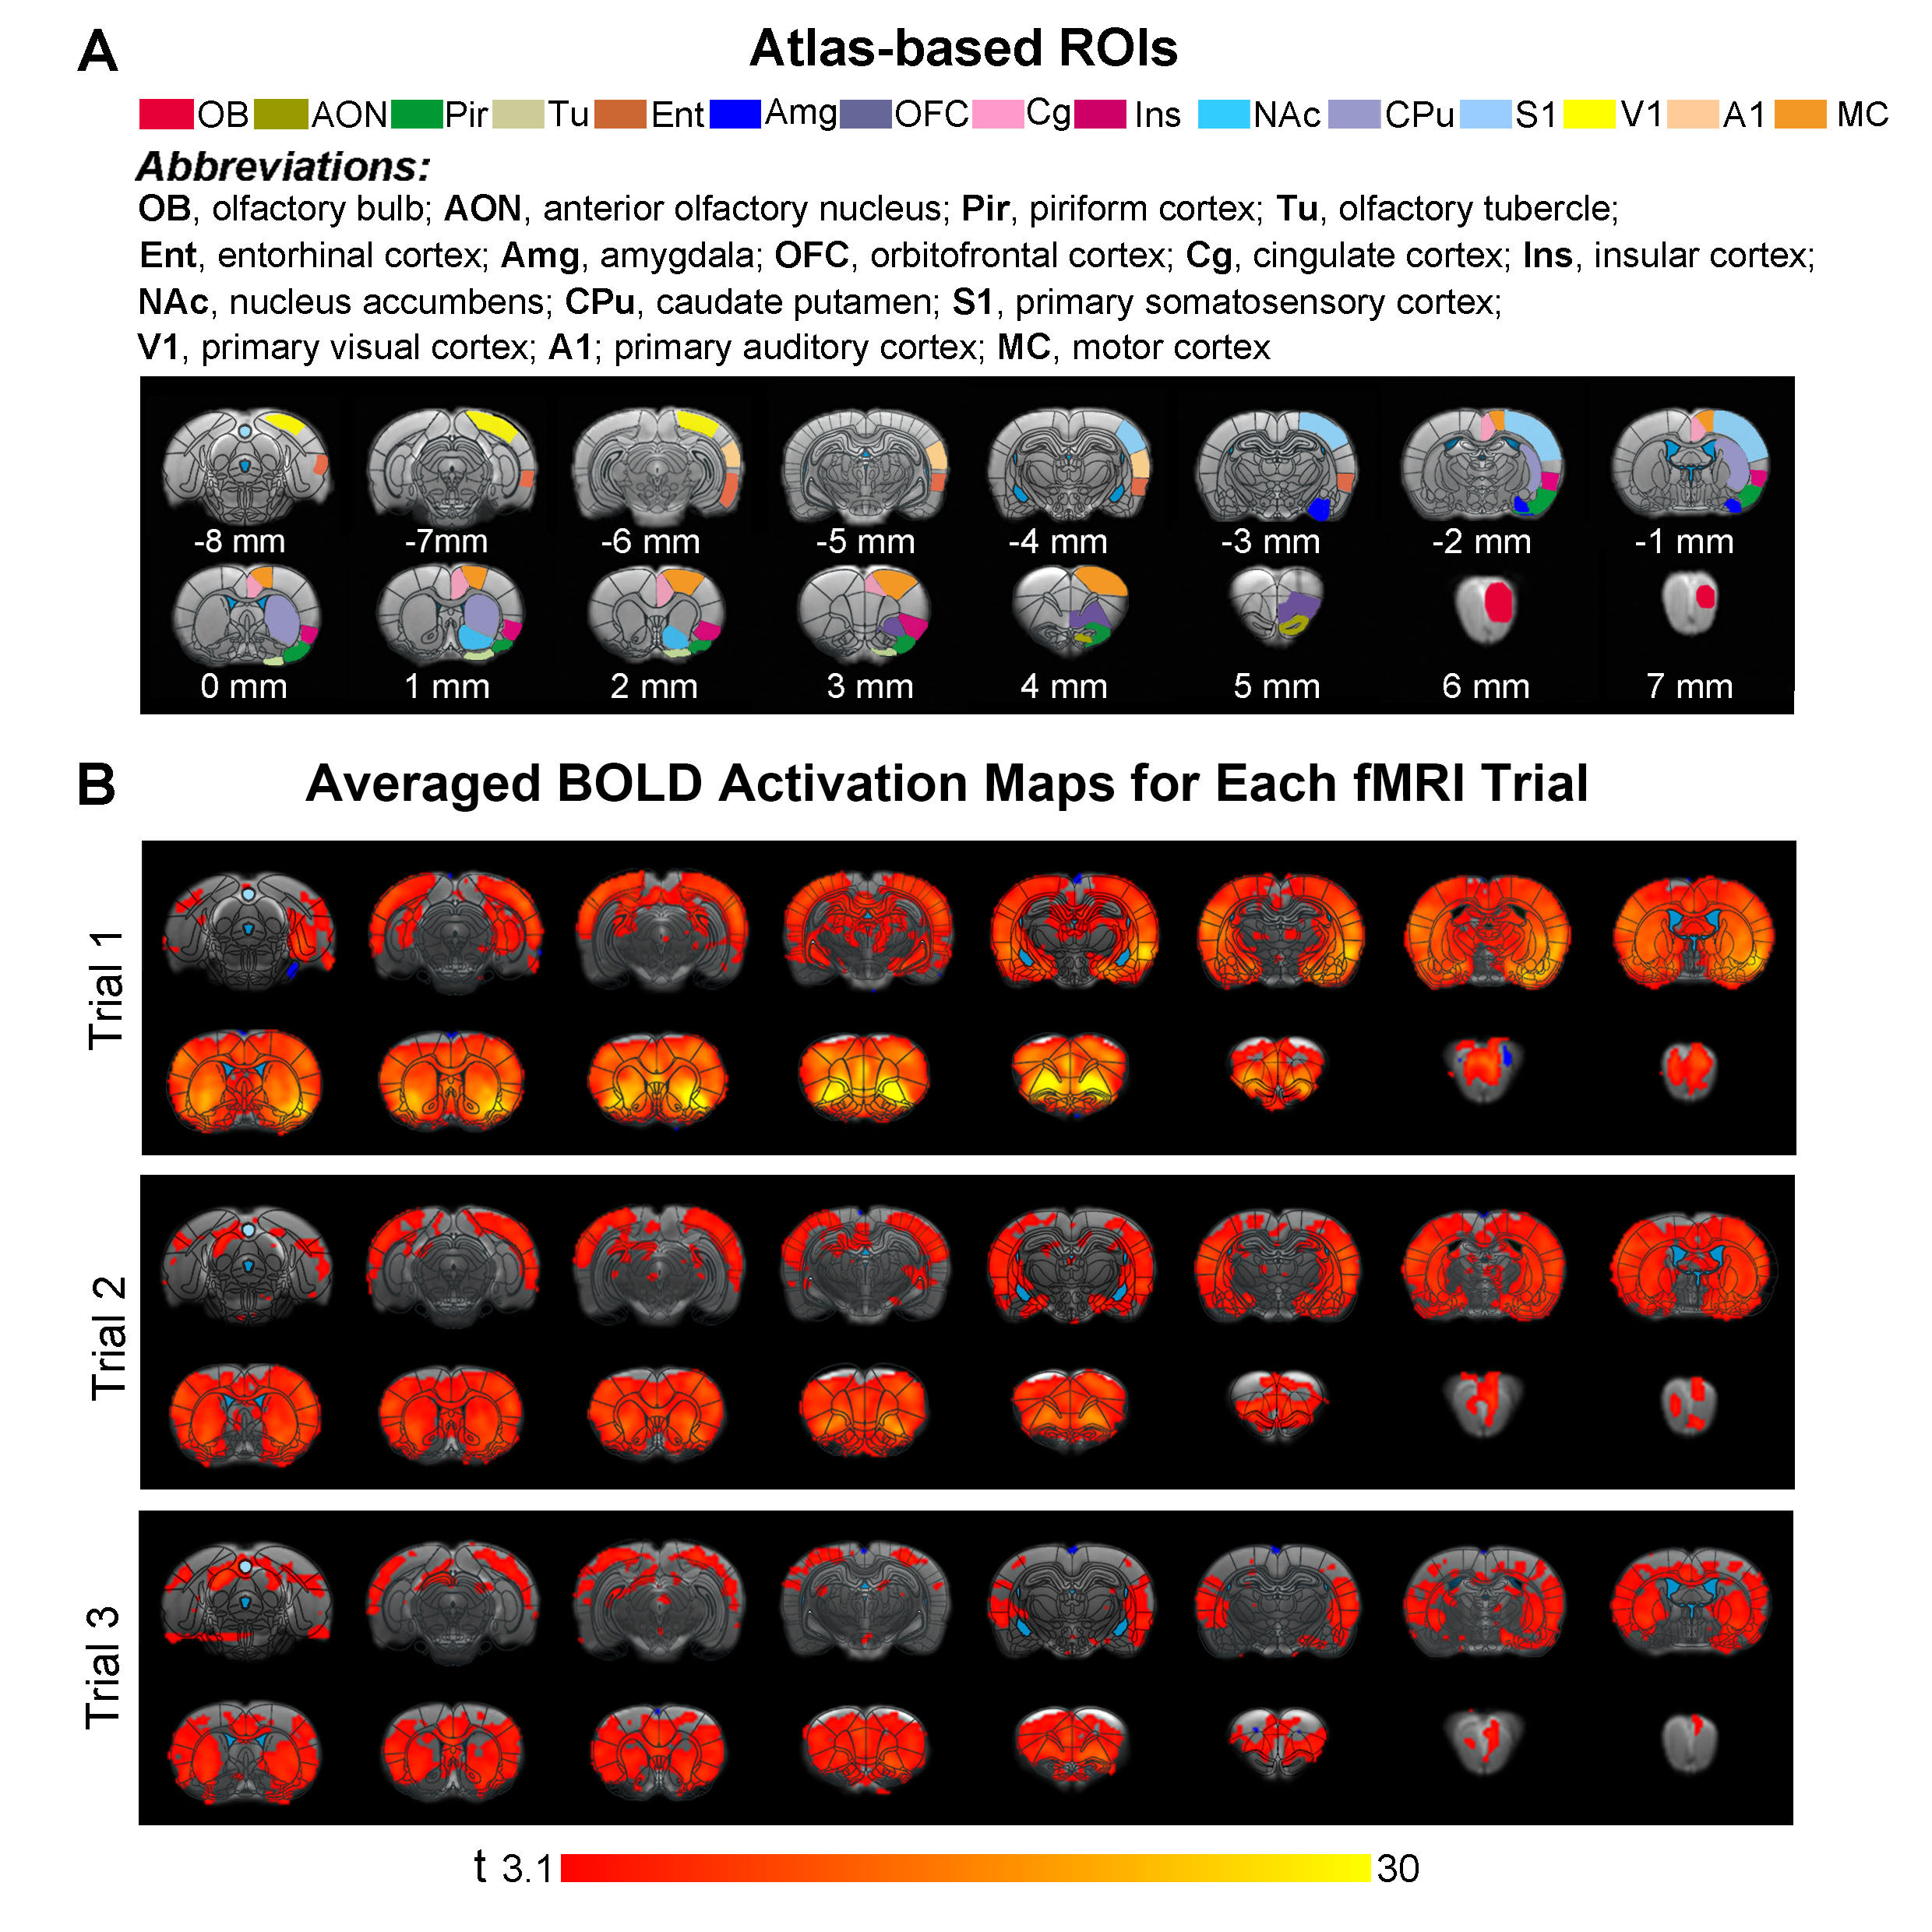
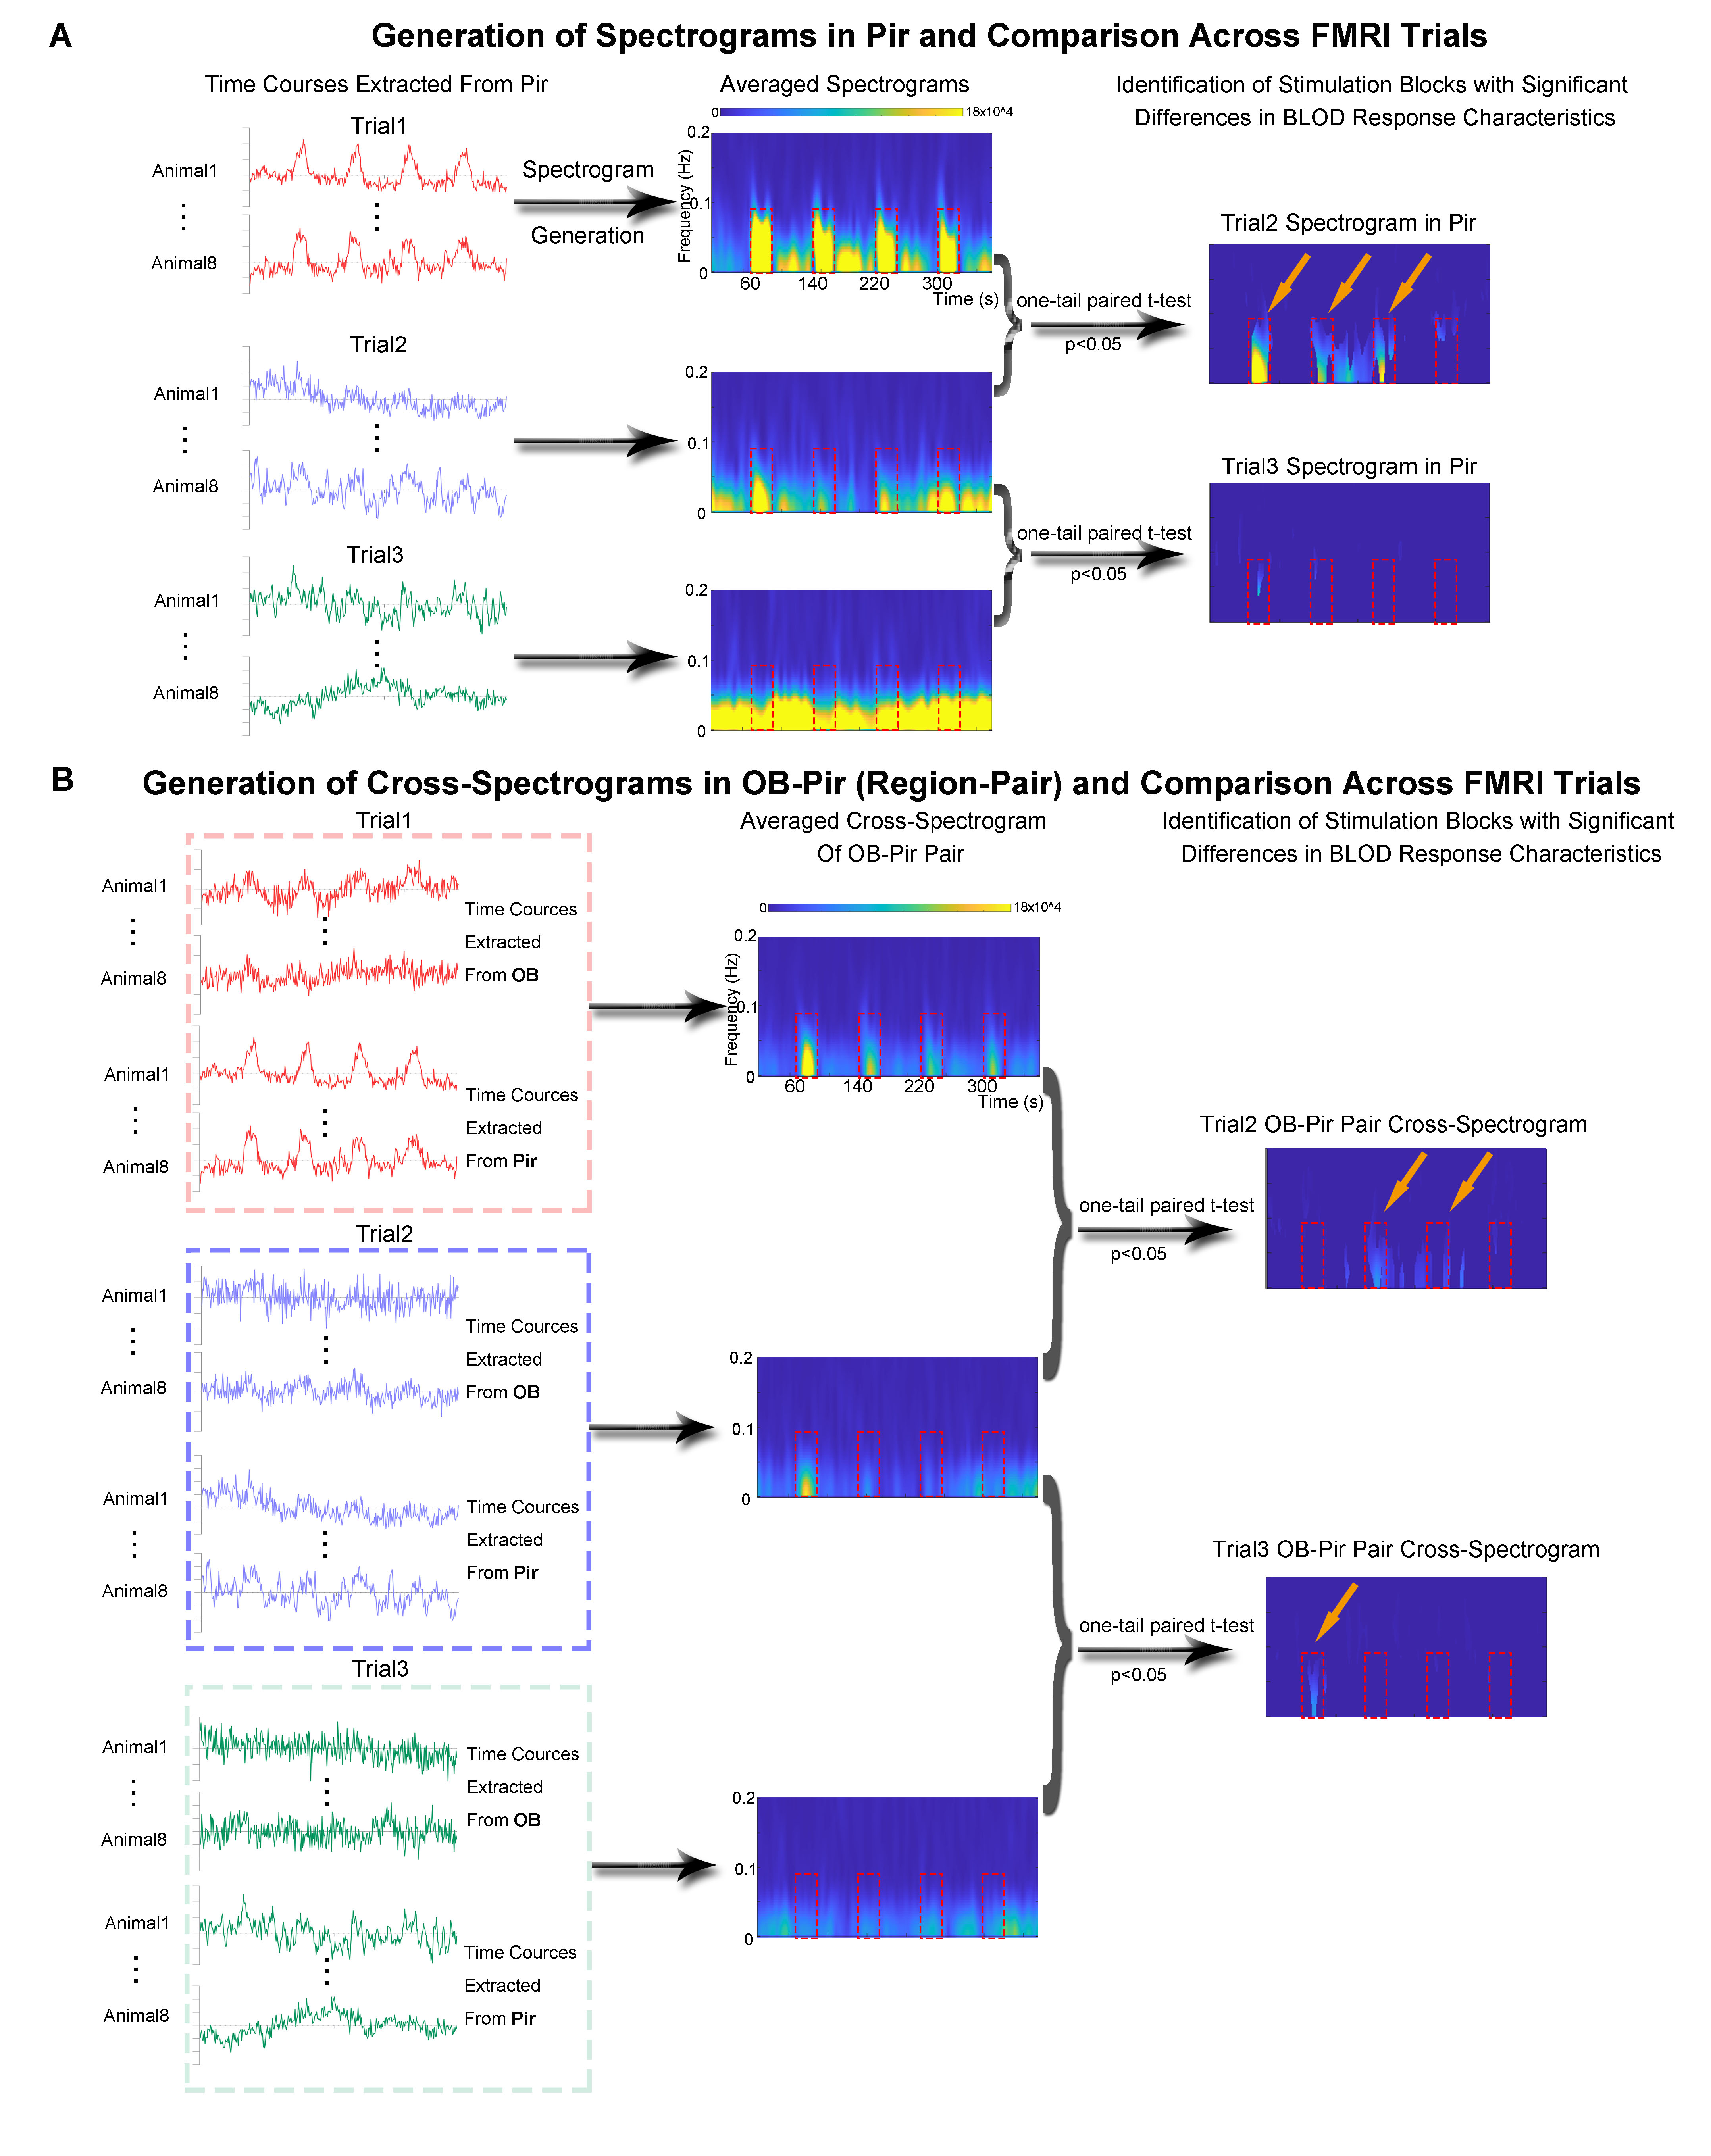
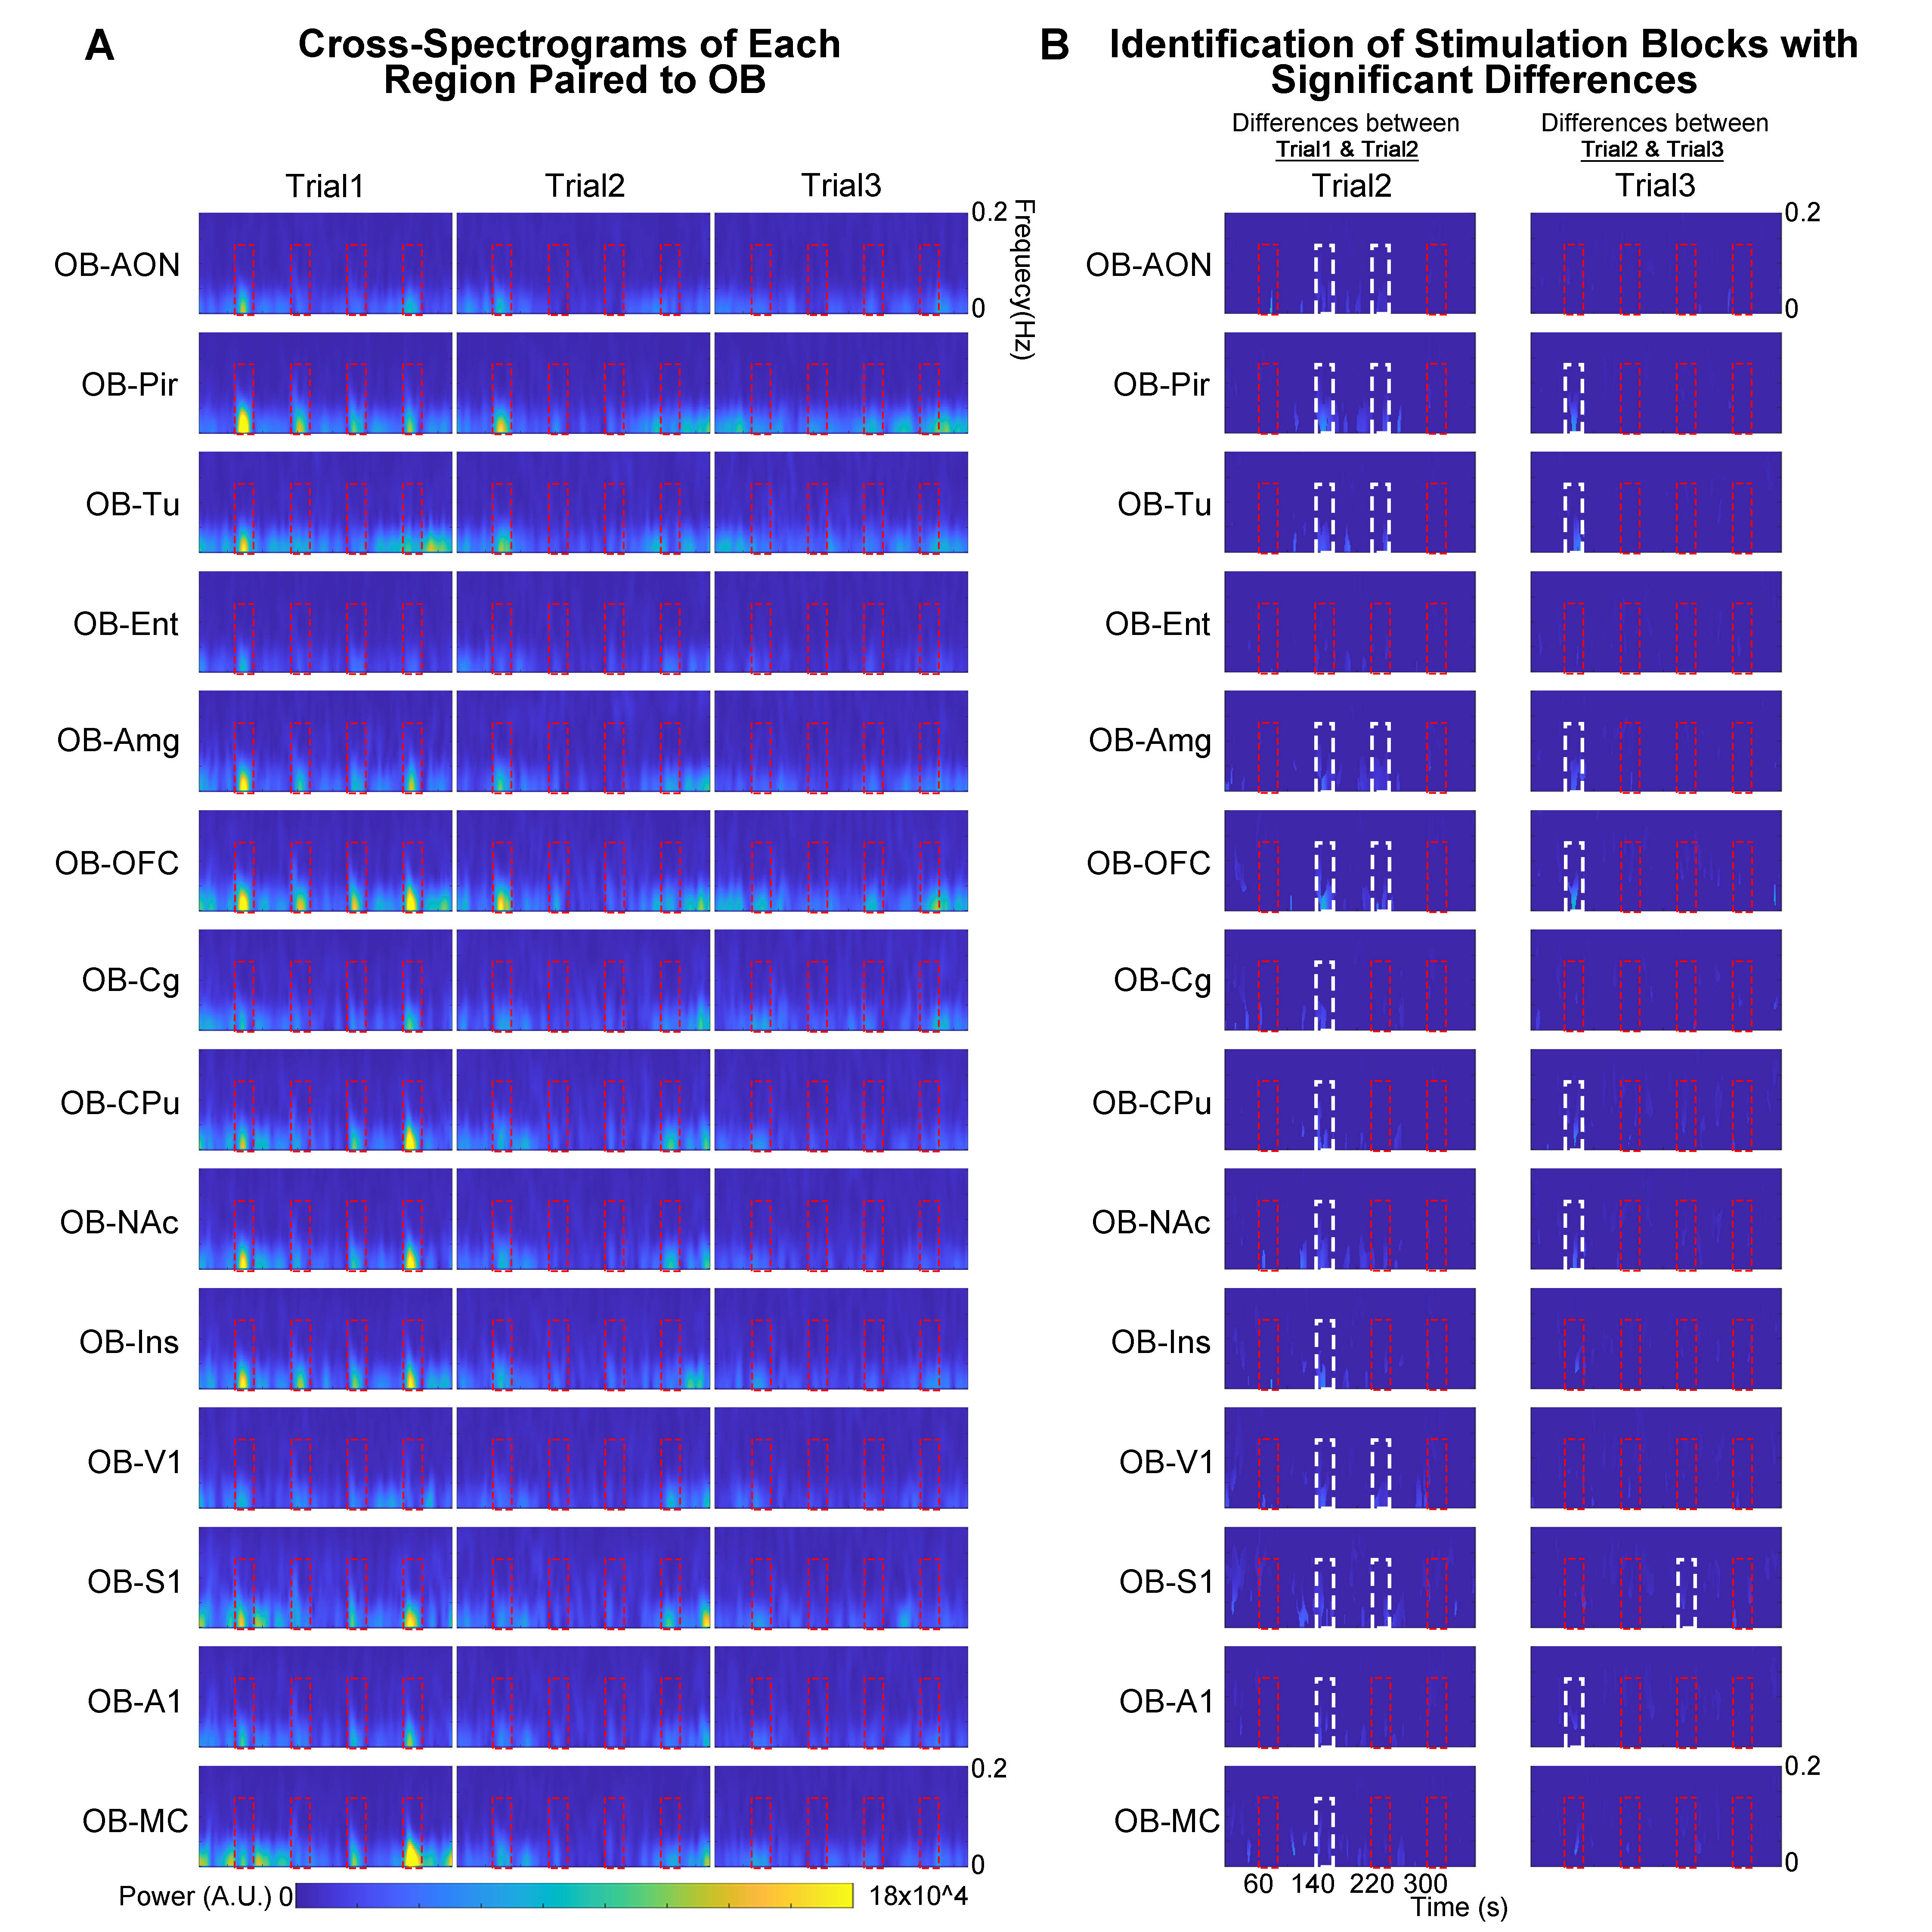
Animal preparation and optogenetic stimulation: 3μl of AAV5-CaMKIIα::ChR2(H134R)-mCherry was injected to OB (7.5mm anterior to Bregma, +1.7mm medial-lateral right hemisphere, -2.2mm from the surface of dura, Figure 1A) of adult rats (200-250g, male, 6 weeks old, SD strain, n=8). Four weeks after injection, an opaque optical fiber cannula (d=450μm) was implanted at OB (Figure 1A). Blue (473nm) light was presented at 1Hz (10% duty cycle, 40mW/mm2) in a block-design paradigm (Figure 1B).fMRI acquisition and analysis: fMRI data were acquired on 7T Bruker scanner using GE-EPI (FOV=32×32mm2, matrix=64×64, α=56°, TE/TR=20/1000ms, and 17 contiguous slices with 1mm thickness). Data were preprocessed before standard GLM analysis was applied to identify significant BOLD responses (p<0.001; FDR corrected). Spectral analyses of BOLD responses to examine olfactory adaptation: BOLD signal profiles (i.e., each fMRI trial is 380s long with 4 optogenetic stimulation blocks) were first extracted from atlas-defined ROI before their time-frequency spectra (spectrogram) were generated. Next, one-tail paired t-test (p<0.05) comparing each spectrogram across stimulation trials was applied to examine the differences in BOLD responses throughout an entire fMRI experiment (i.e., typically three trials) (Figure 3A). Cross-spectrograms were subsequently generated from the BOLD signal profiles of OB and downstream olfactory regions (Figure 3B) with one-tail paired t-test (p<0.05) to compare cross-spectrogram across stimulation trials. We chose spectrograms to examine BOLD response characteristics as they enable fine simultaneous measurements of changes in BOLD response amplitude and signal fluctuations across time.
Results
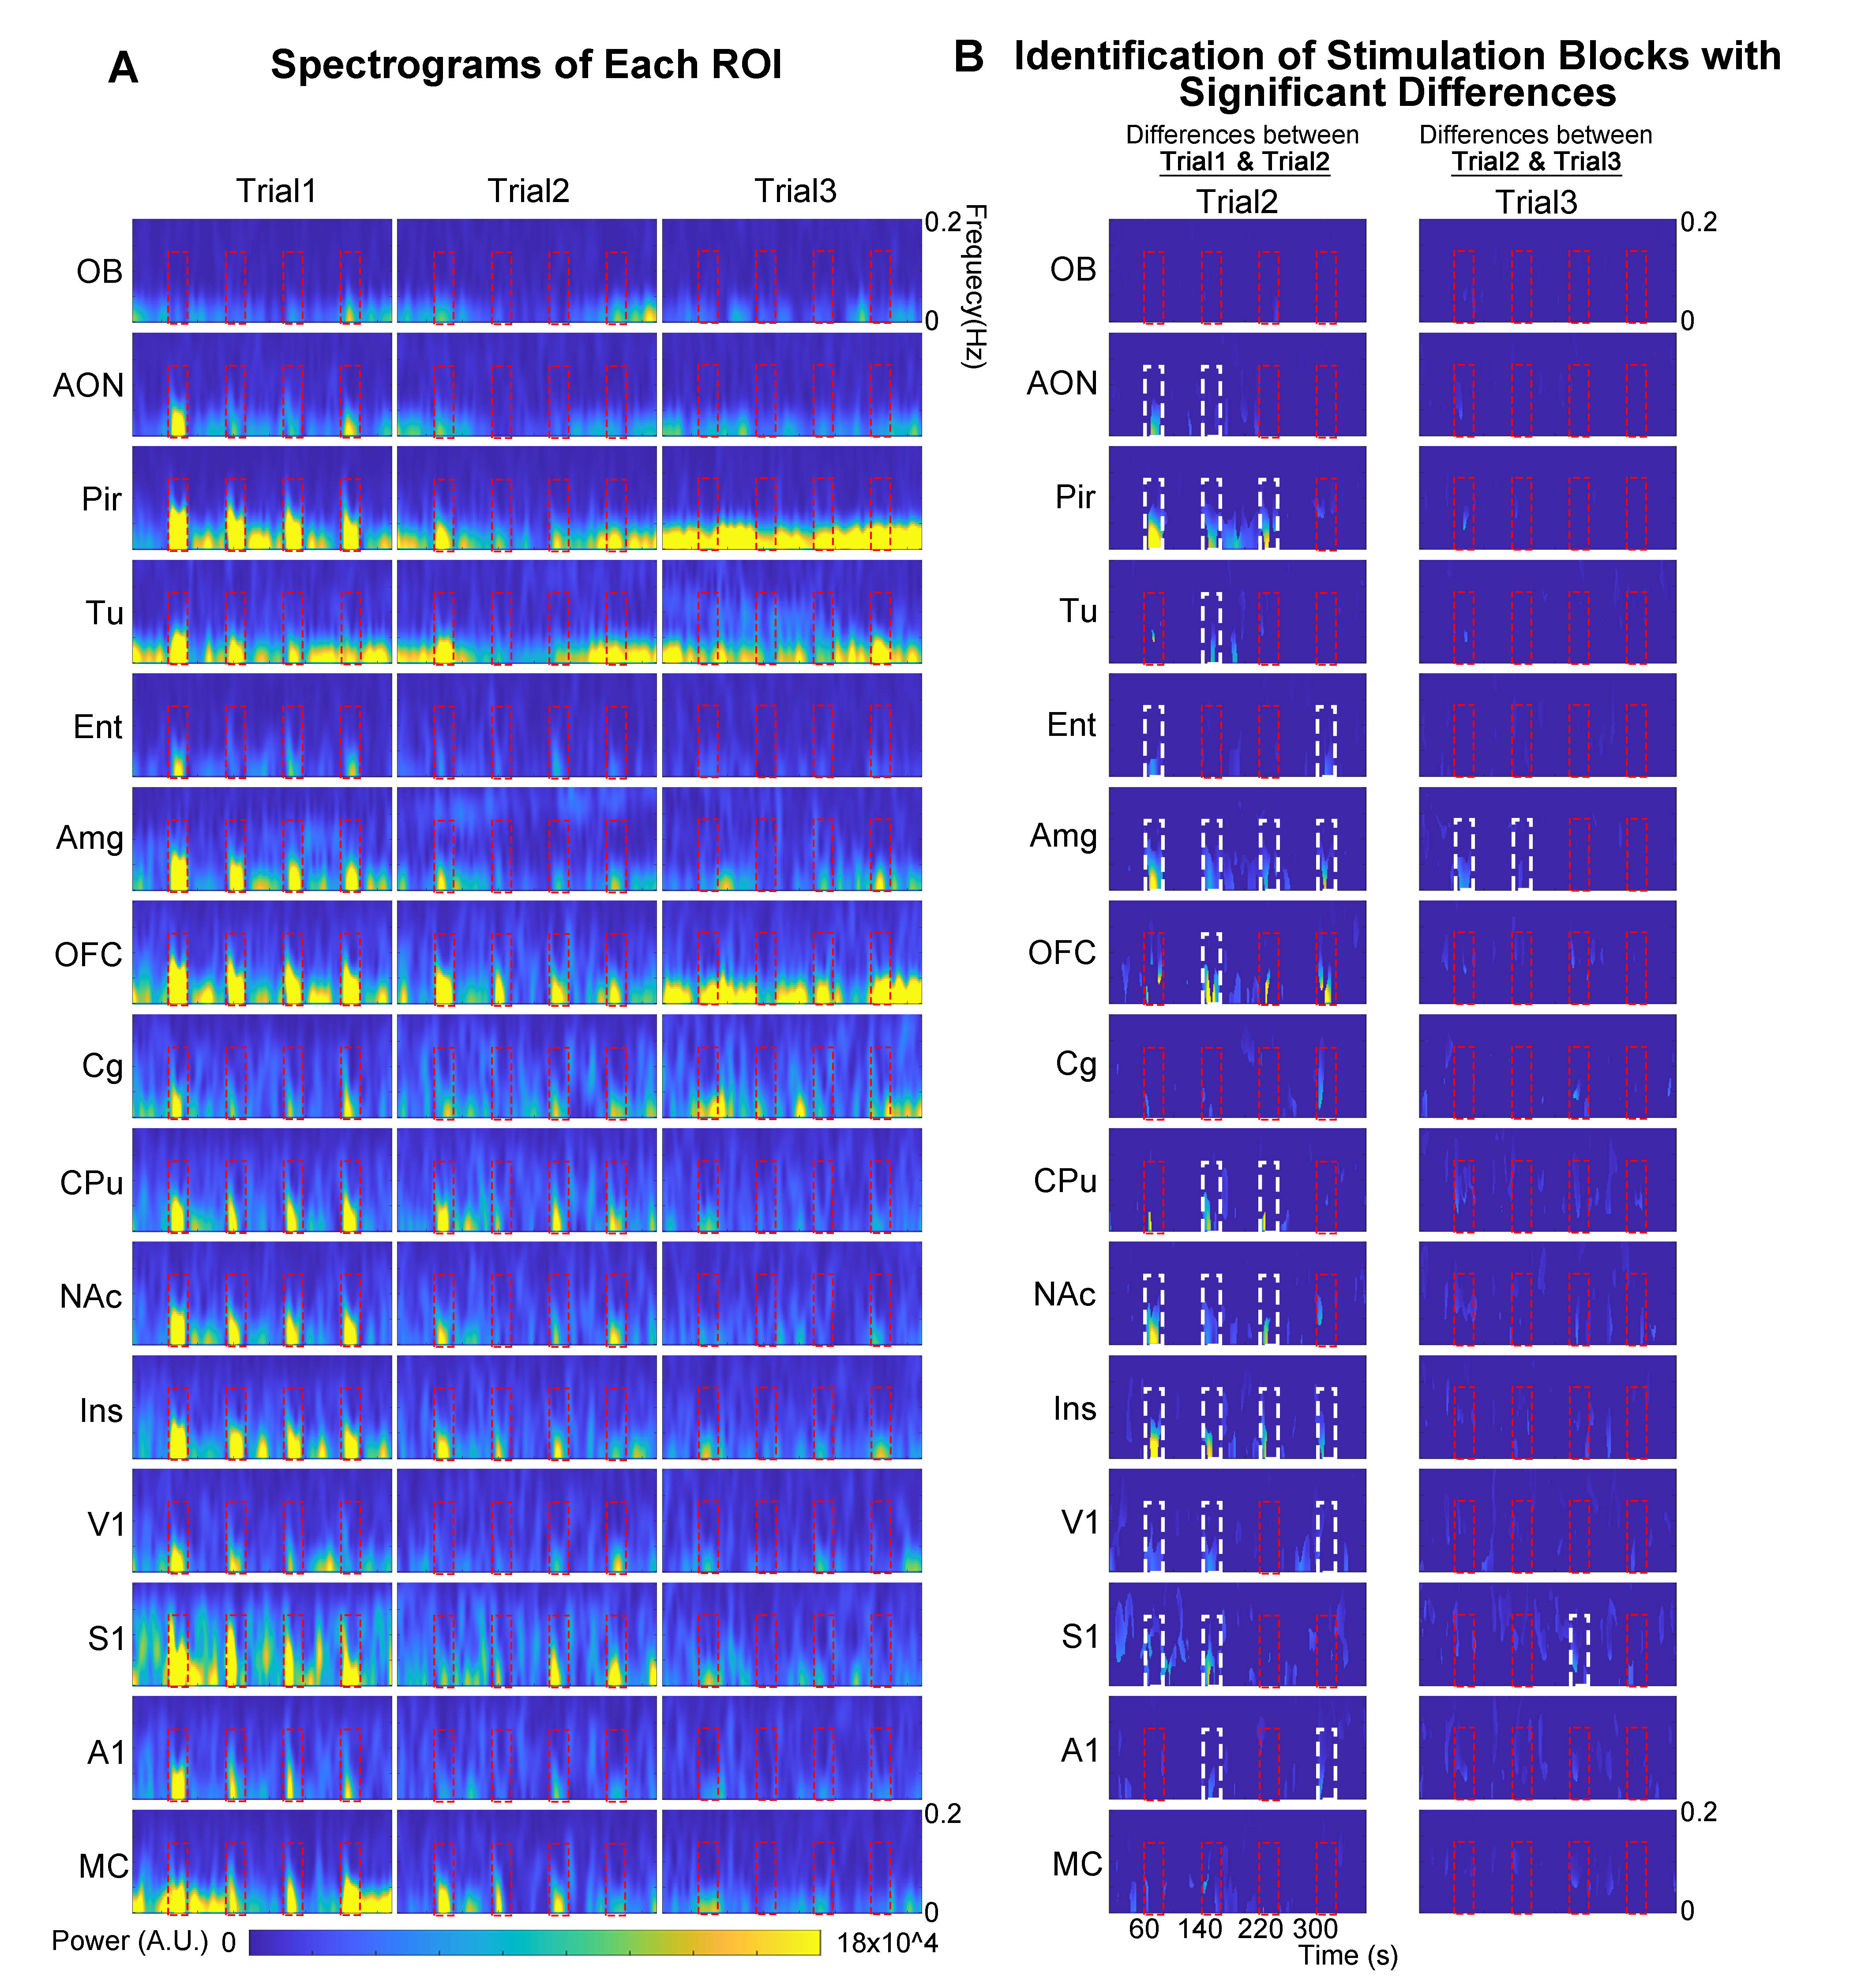
Spectrograms of BOLD responses revealed different adaptation extent under repeated OB stimulationOB activations showed no obvious decrease in BOLD response throughout the fMRI experiment. AON, Pir, Ent and Amg all showed strong response adaptation in the second fMRI trial when compared to the first. However, we did not observe appreciable adaptation in AON, Pir, Ent between the second and third fMRI trial (Figure 4A, B). Interestingly, Amg, a primary olfactory region that receives direct projections from OB, and primary somatosensory cortex (S1), a non-primary olfactory region, showed robust adaptation when comparing all successive trials. Meanwhile, responses in orbitofrontal cortex (OFC), insula cortex (Ins), primary visual and auditory cortices (V1 & A1), and both striatal regions (caudate putamen, CPu, & nucleus accumbens, NAc) only adapted between the first and second trial. Cingulate cortex (Cg) and motor cortex (MC) showed weak to no response adaptation.
We then further examined the cross-spectrograms as means to explore changes in fMRI connectivity between OB and the various downstream targets during the adaptation process. Among the olfactory regions that receive direct projections from OB (i.e., AON, Pir, Tu, Ent, Amg, and OFC), the response characteristics of OB-Pir, OB-Tu, OB-Amg and OB-OFC showed rapid and robust decrease in connectivity when comparing successive trials (trial 2 vs. trial 1 and trial 3 vs. trial 2; Figure 5A, B), suggesting that these pathways are dominant when processing repeated olfactory inputs.
Discussion & Conclusions
It is documented that olfactory adaptation originates from primary olfactory regions (i.e., OB, AON, Pir, Tu) 4,8,16,17. Our findings showing significant role of AON and Pir in mediating olfactory adaption largely corroborate this view. However, the contribution of Amg and Ent has been considerably underestimated, likely due to the relatively weak and unstable activations reported in regions beyond AON, Pir and Tu evoked by odor cues18-20. Our study with improved sensitivity in detecting responses in Amg and Ent suggests that these regions which play a vital role in regulating behavioral responses (i.e., emotion and memory) significantly contribute to olfactory adaptation. In this study, we revealed the distinct response characteristics and extent of adaptation at numerous regions within the olfactory system when processing repeated inputs from OB.Acknowledgements
This work was supported in part by Hong Kong Research Grant Council (HKU17112120, HKU17127121, HKU17127022 and R7003-19F to E.X.W., and HKU17103819, HKU17104020 and HKU17127021 to A.T.L.L.), Lam Woo Foundation, and Guangdong Key Technologies for AD Diagnostic and Treatment of Brain (2018B030336001) to E.X.W..References
1. Pellegrino, R., Sinding, C., de Wijk, R.A. & Hummel, T. Habituation and adaptation to odors in humans. Physiol Behav 177, 13-19 (2017).
2. Sinding, C., et al. New determinants of olfactory habituation. Sci Rep 7, 41047 (2017).
3. Kim, K., Bae, J., Jin, Y. & Moon, C. Odor habituation can modulate very early olfactory event-related potential. Sci Rep-Uk 10(2020).
4. Kadohisa, M. & Wilson, D.A. Olfactory cortical adaptation facilitates detection of odors against background. Journal of Neurophysiology 95, 1888-1896 (2006).
5. Mignot, C., Schunke, A., Sinding, C. & Hummel, T. Olfactory adaptation: recordings from the human olfactory epithelium. Eur Arch Otorhinolaryngol 279, 3503-3510 (2022).
6. Shen, Y., Dasgupta, S. & Navlakha, S. Habituation as a neural algorithm for online odor discrimination. Proceedings of the National Academy of Sciences of the United States of America 117, 12402-12410 (2020).
7. Li, W., Luxenberg, E., Parrish, T. & Gottfried, J.A. Learning to smell the roses: Experience-dependent neural plasticity in human piriform and orbitofrontal cortices. Neuron 52, 1097-1108 (2006).
8. Zhao, F., et al. fMRI study of olfaction in the olfactory bulb and high olfactory structures of rats: Insight into their roles in habituation. Neuroimage 127, 445-455 (2016).
9. Zhao, F., et al. fMRI study of the role of glutamate NMDA receptor in the olfactory adaptation in rats: Insights into cellular and molecular mechanisms of olfactory adaptation. Neuroimage 149, 348-360 (2017).
10. Ma, T., Leong, A.T.L., Wang, X., Wong, E.C., Sanchayyan, S., Chong, P.S., Lim, L.W., Khong, P.L. & Wu, E.X. optogenetic fMRI interrogation of the olfactory system. in Proceedings of International Society for Magnetic Resonance in Medicine,Virtual Conference p2941 (2021).
11. Ma, T., Wang, X., Xie, L., Chong, P.S., Cao, P., Khong, P.L., Lim, L.W., Wu, E.X. & Leong, A.T.L. Unravel the Role of Primary Olfactory Cortices in Olfactory Processing via Optogenetic fMRI. in Proceedings of International Society for Magnetic Resonance in Medicine,Virtual Conference p3025 (2022).
12. Mobley, A.S., Rodriguez-Gil, D.J., Imamura, F. & Greer, C.A. Aging in the olfactory system. Trends Neurosci 37, 77-84 (2014).
13. Doty, R.L. Olfactory dysfunction in neurodegenerative diseases: is there a common pathological substrate? The Lancet Neurology 16, 478-488 (2017).
14. Dolgin, E. The science behind COVID's assault on smell. Nature 606, S5-S6 (2022).
15. Xydakis, M.S., et al. Post-viral effects of COVID-19 in the olfactory system and their implications. The Lancet Neurology 20, 753-761 (2021).
16. Storace, D.A. & Cohen, L.B. The Mammalian Olfactory Bulb Contributes to the Adaptation of Odor Responses: A Second Perceptual Computation Carried Out by the Bulb. eNeuro 8(2021).
17. Zhang, H., et al. Olfactory fMRI Activation Pattern Across Different Concentrations Changes in Alzheimer's Disease. Front Neurosci 13, 786 (2019).
18. Zhao, F., et al. fMRI study of olfactory processing in mice under three anesthesia protocols: Insight into the effect of ketamine on olfactory processing. Neuroimage 213, 116725 (2020).
19. Xu, F., Kida, I., Hyder, F. & Shulman, R.G. Assessment and discrimination of odor stimuli in rat olfactory bulb by dynamic functional MRI. Proc Natl Acad Sci U S A 97, 10601-10606 (2000).
20. Muir, E.R., et al. Functional MRI of the mouse olfactory system. Neurosci Lett 704, 57-61 (2019).
Figures