1035
Interrogation of resting-state effective connectivity by whole-brain fMRI with optogenetic silencing1Center for Neuroscience Imaging Research, Institute for Basic Science (IBS), Suwon, Korea, Republic of, 2Department of Biomedical Engineering, Sungkyunkwan University, Suwon, Korea, Republic of, 3Department of Intelligent Precision Healthcare Convergence, Sungkyunkwan University, Suwon, Korea, Republic of
Synopsis
Keywords: Brain Connectivity, fMRI
Mapping resting-state effective connectivity by cortical optogenetic activation of inhibitory neurons in miceIntroduction
Resting-state fMRI has been the most widely used method for mapping functional connectivity (FC) of the brain, due to its simplicity and intuitiveness while still reliable and reproducible1. Although resting-state fMRI has revealed the brain FC networks, the ambiguity of the origin often hinders appropriate interpretation2. To address this issue, we have demonstrated that local optogenetic activation of inhibitory neural populations can be used for mapping resting-state connections by suppressing distant downstream brain areas3,4. This approach offers a means to measure direct influence from the optogenetically inactivated brain region, which is defined as resting-state effective connectivity (EC)5. In this study, we investigated the resting-state EC from 6 cortical regions using 9.4T mouse fMRI with 6 cortical ROI deactivation. To stimulate multiple brain areas in one subject, we used a previously developed patterned optogenetics system that enables spatiotemporally flexible stimulation throughout the dorsal cortex6.Methods
VGAT-ChR2-EYFP mice (n=7; male; 18-20 weeks; JAX #014548) were used for inhibitory neuron-specific channelrhodopsin expression. For patterned optogenetics, a thinned-skull cranial window was prepared on the entire dorsal skull and reference beads were placed for coregistration between the optic and MR images6. For MRI experiments, mice were kept under dexmedetomidine (intravenous infusion through the tail vein at a rate of 0.05 mg/kg/h) and isoflurane (0.3%) anesthesia. For CBV-weighted fMRI, monocrystalline iron oxide nanoparticles (MION; 20 mg/kg) were injected. Since an increase in CBV induced a decrease in the fMRI signal, the polarity of CBV-weighted fMRI was inverted to match that of CBV change.All MRI experiments were conducted at 9.4T (Bruker Biospec). For anatomical MRI, a 3D T2-weighted image was acquired using RARE with the following parameters: FOV = 16 (L-R) × 10 (V-D) × 10 (A-P) mm2; spatial resolution = 0.1×0.1×0.1 mm3; TR/TE = 1500/36 ms; RARE factor = 16. fMRI images were acquired with 2D EPI with the following parameters: FOV = 16 (L-R) × 8 (V-D) mm2; 18 contiguous 0.5-mm thick coronal slices; in-plane resolution = 0.167 × 0.167 mm2; TR/TE = 1000/8.35 ms; FA = 47°.
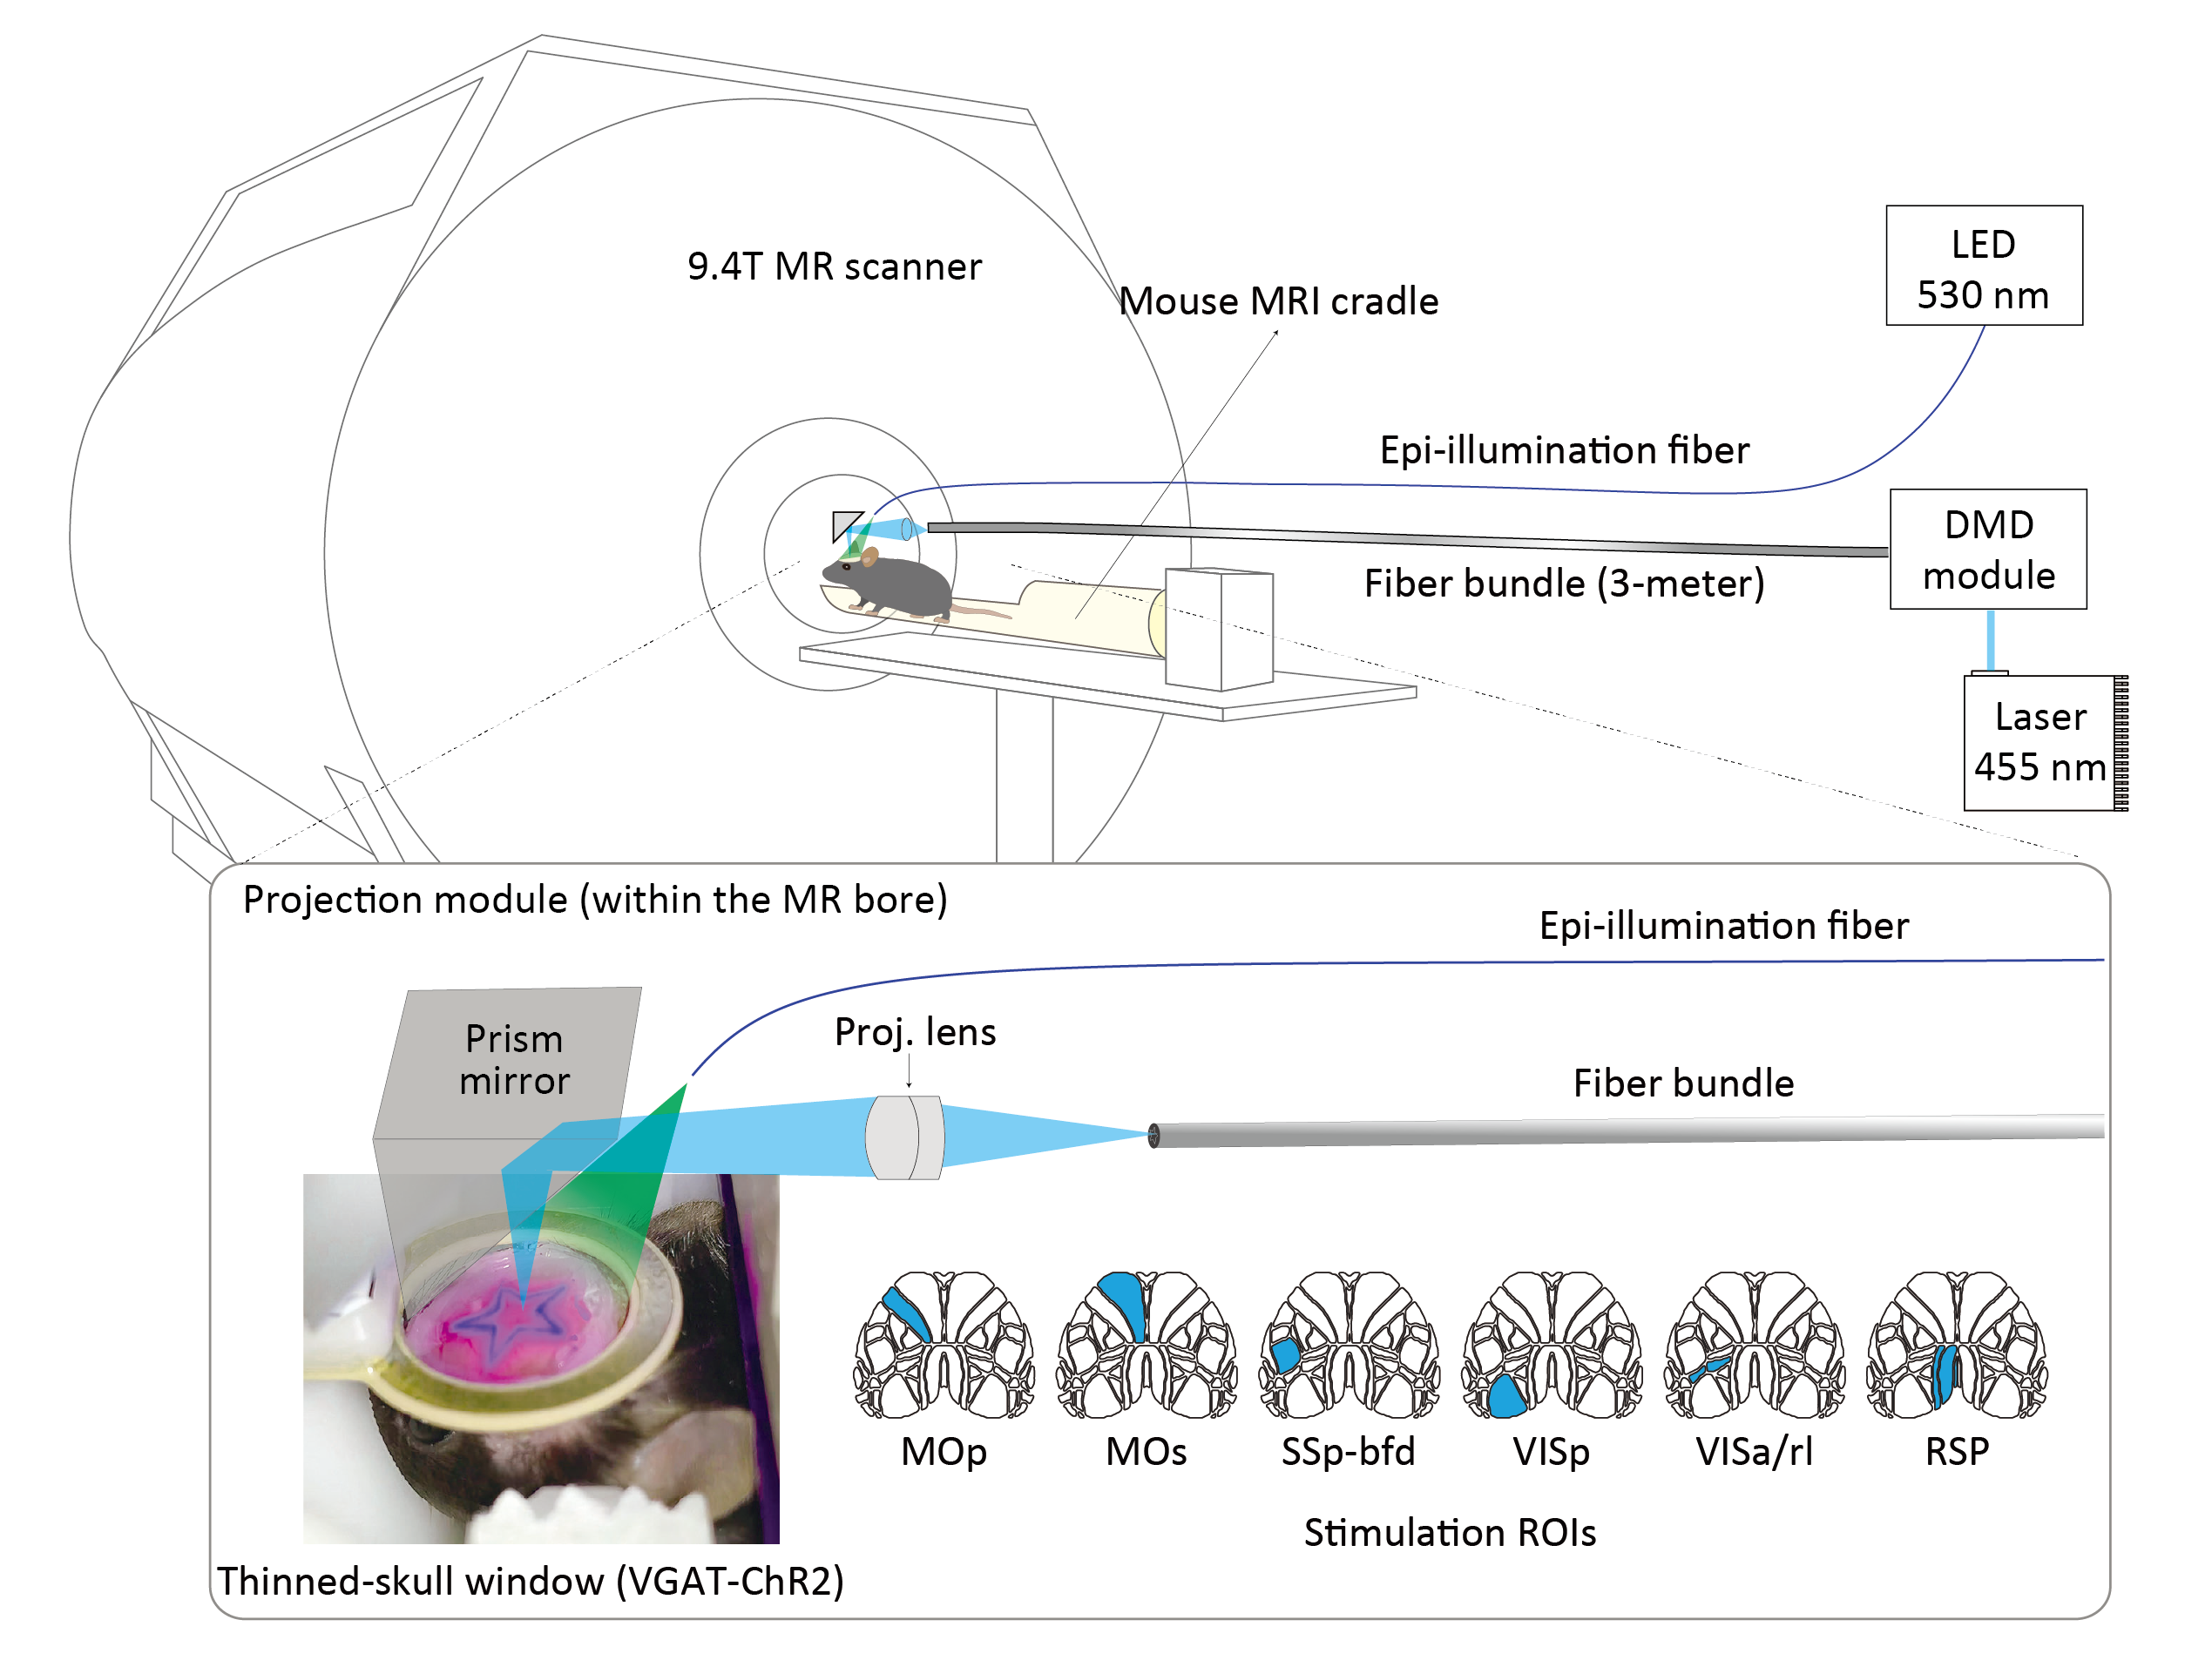
The patterned optogenetic stimulation (20 Hz, 20% duty cycle, 4 mW/mm2) was delivered on the dorsal cortex through a bundle fiber (100k cores) after being shaped by a digital micromirror device6 (Figure 1). Six cortical stimulation targets were defined based on the Allen mouse brain atlas7: primary (MOp) and secondary (MOs) motor cortex, primary somatosensory barrel field (SSp-bfd), primary visual cortex (VISp), anterior and rostrolateral visual areas (VISa/rl), and retrosplenial area (RSP). Each fMRI trial (120 s) consisted of 3 blocks, 40 s (baseline)-20 s (stimulation)-60 s (rest).
For data analysis, every EPI image was coregistered to the brain template after preprocessing. The individual activation maps were generated by a GLM analysis and the resulting beta maps were input to a voxel-by-voxel t-test for group activation maps. For ROI-level analysis, the mean beta value (of all voxels) was calculated in each ROI.
Results
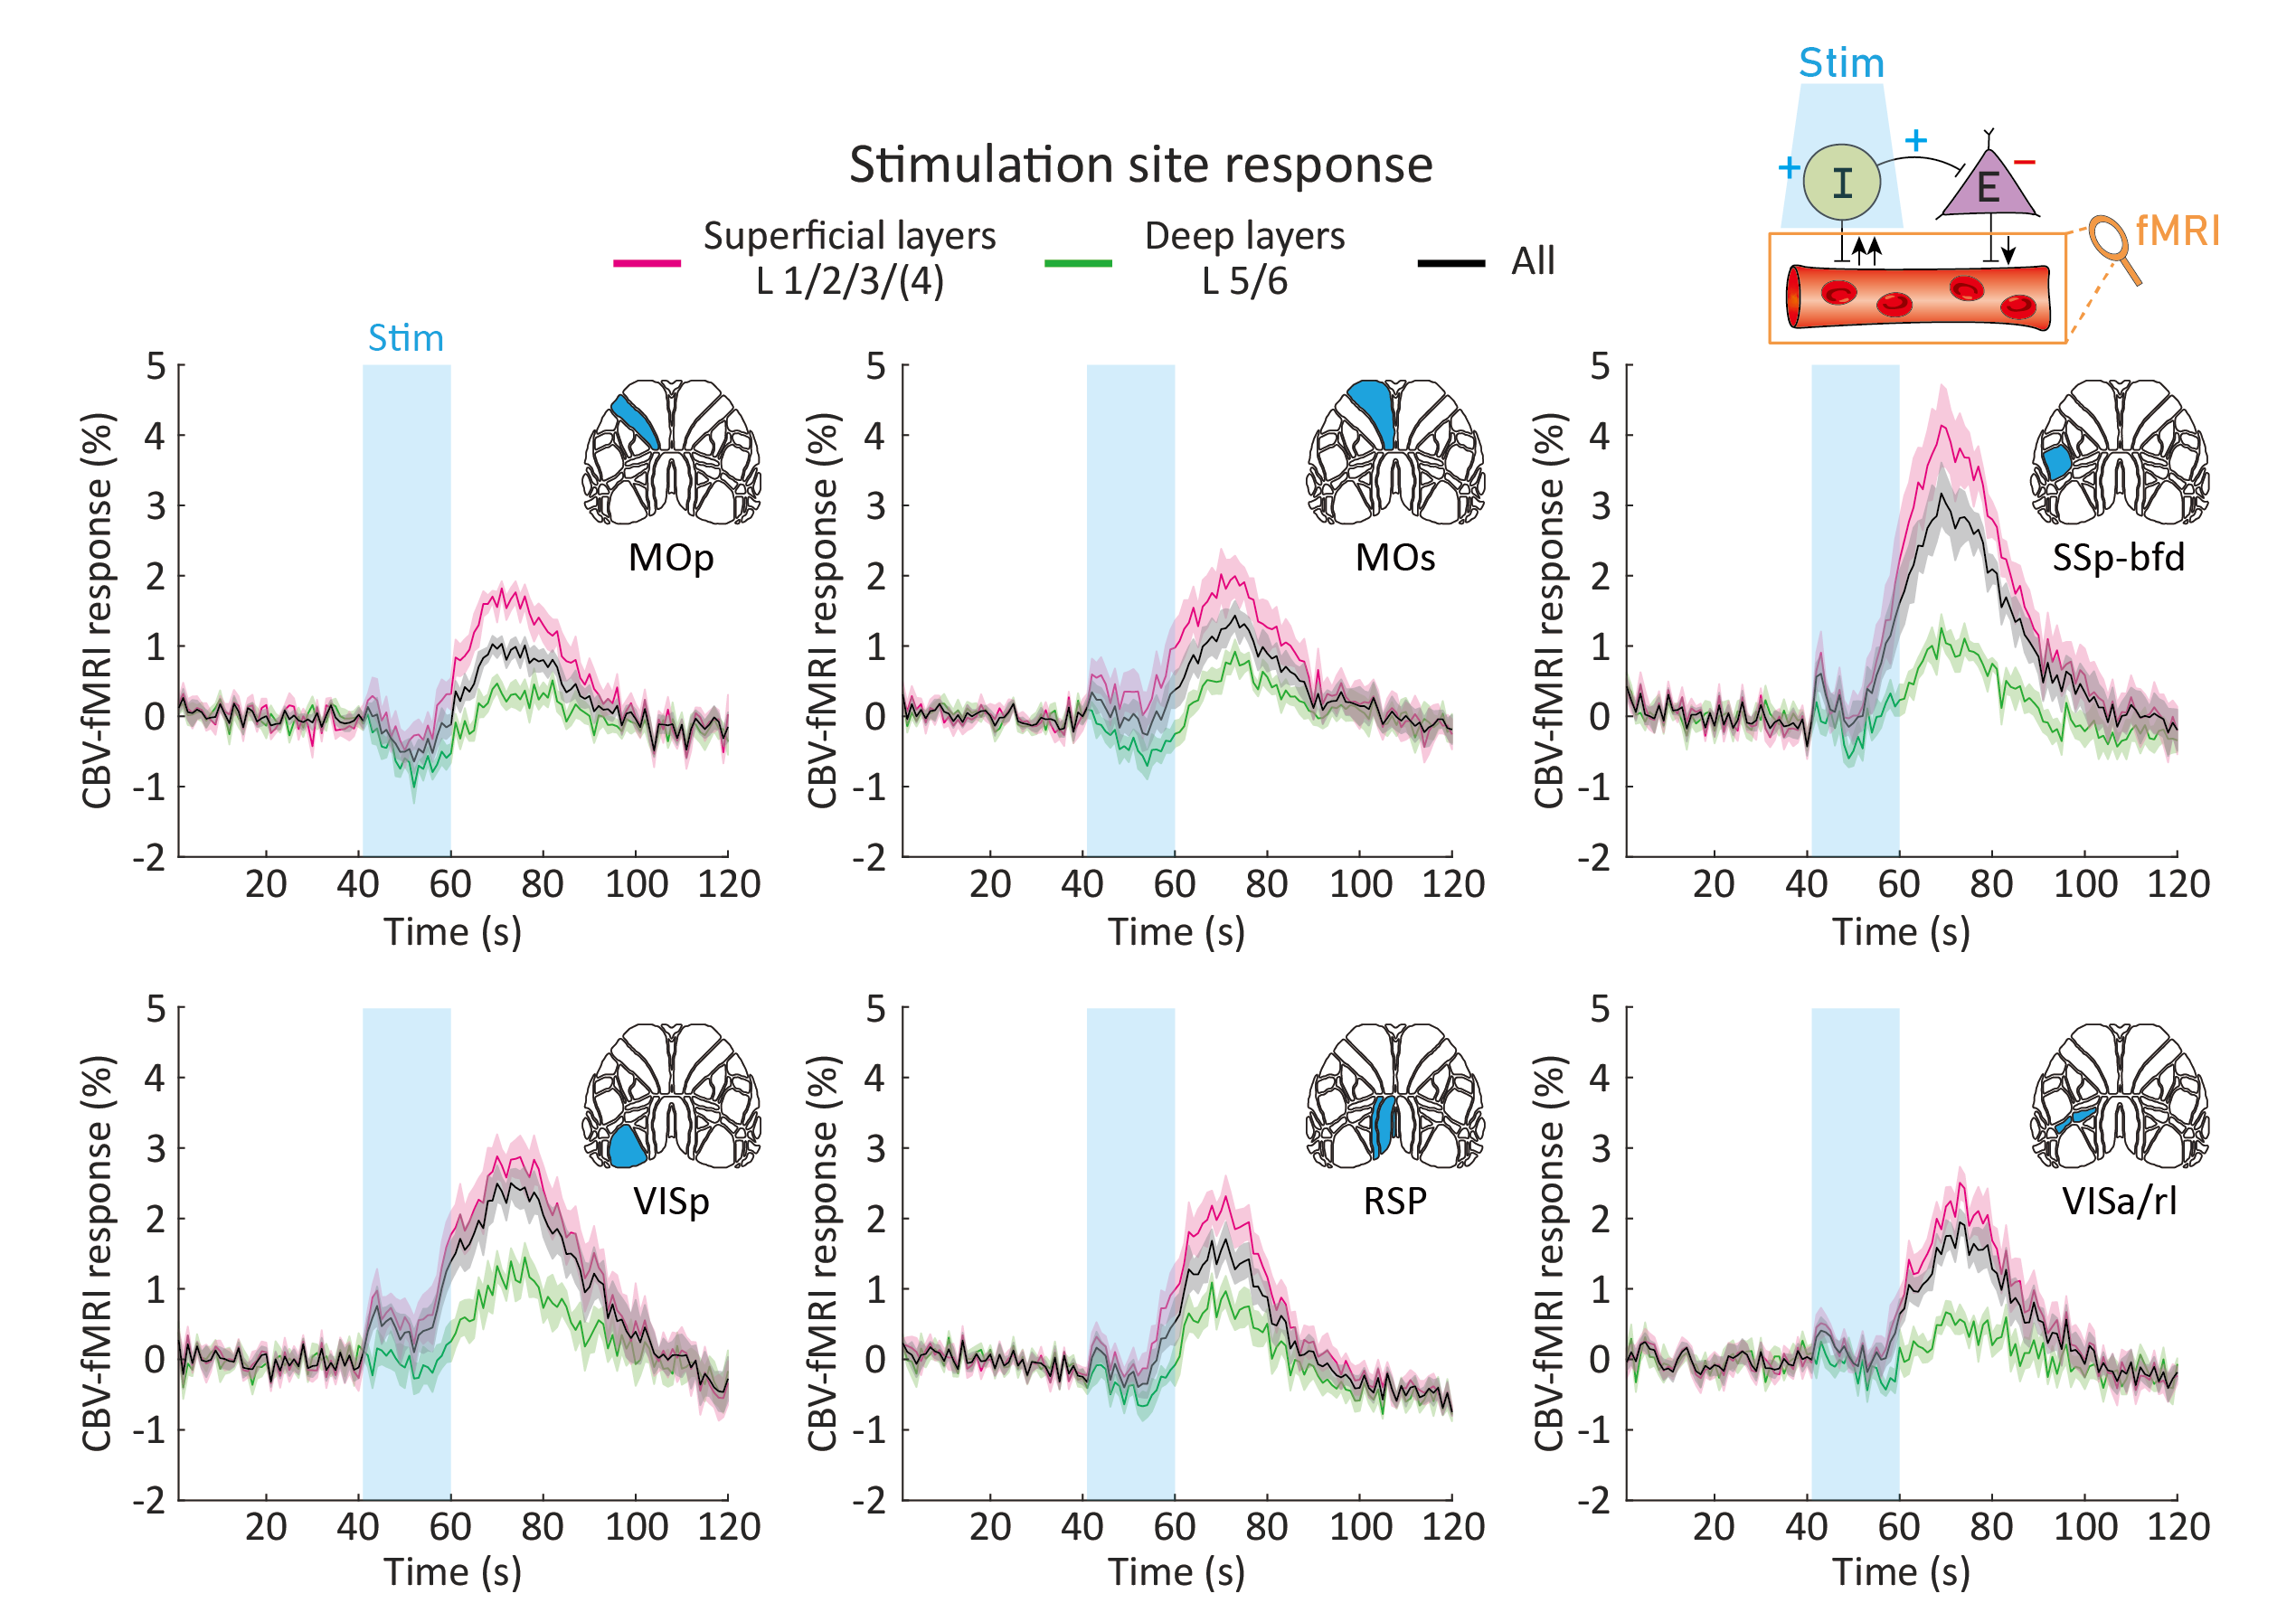
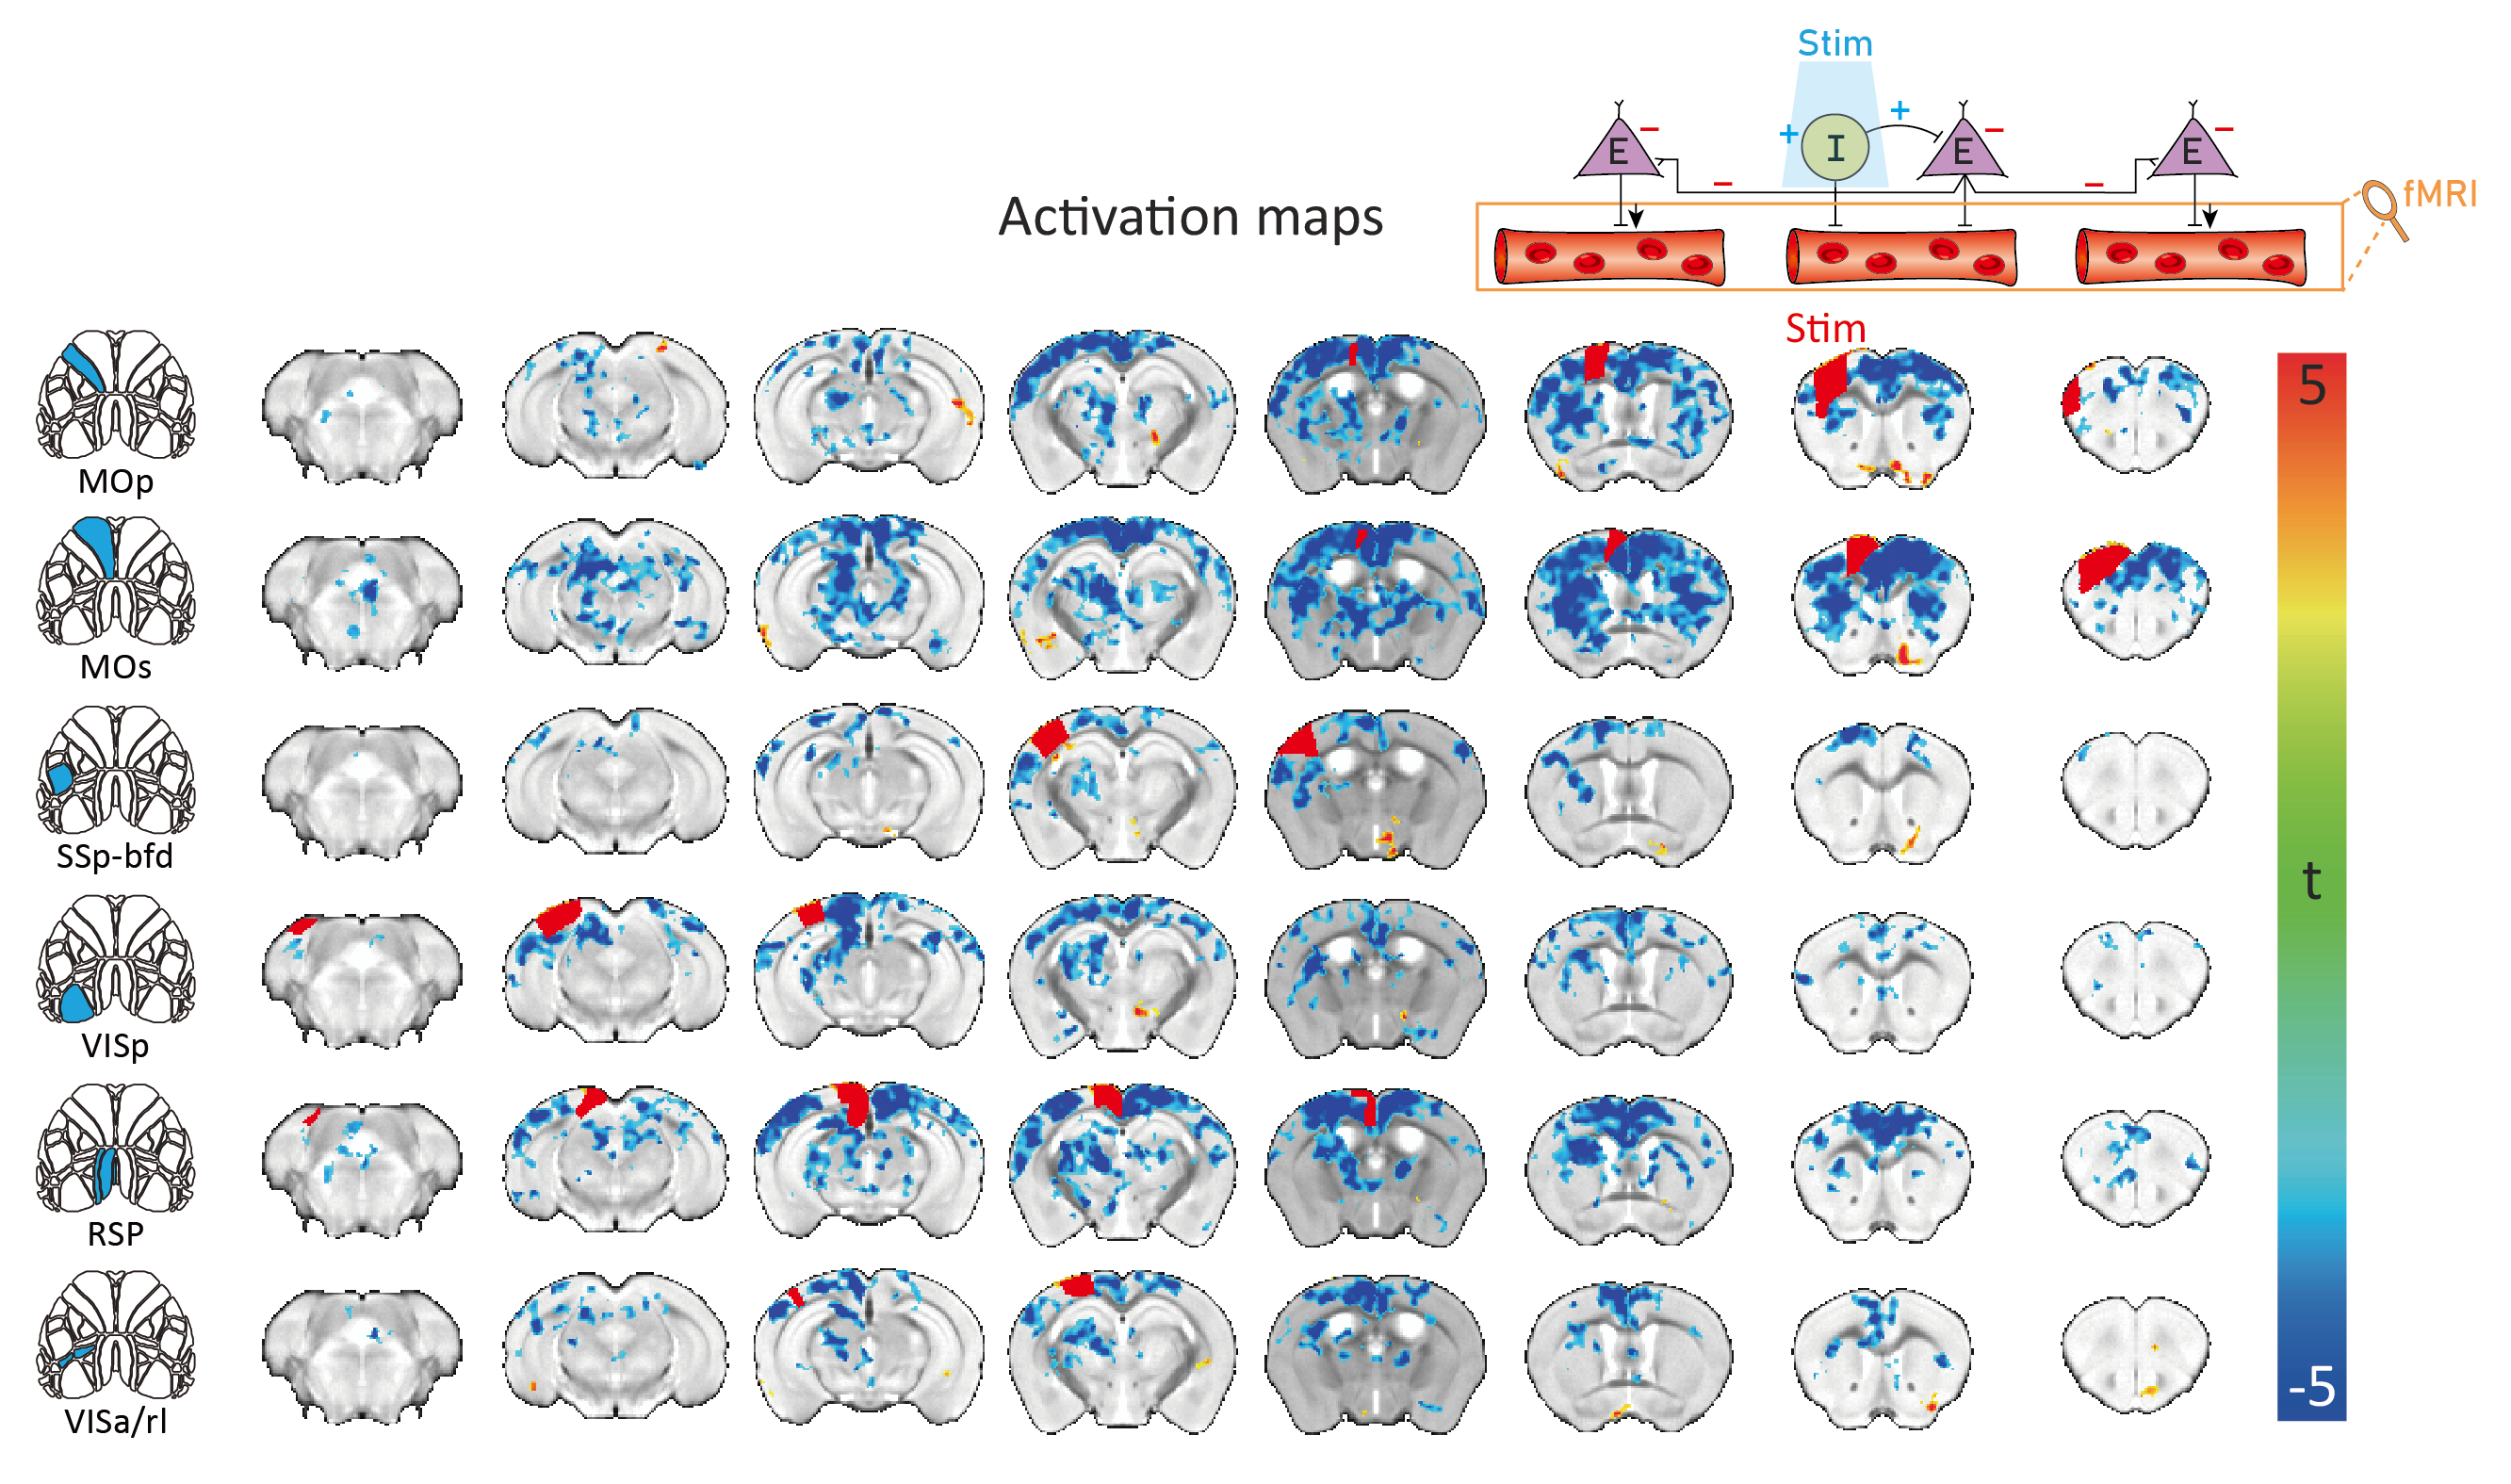
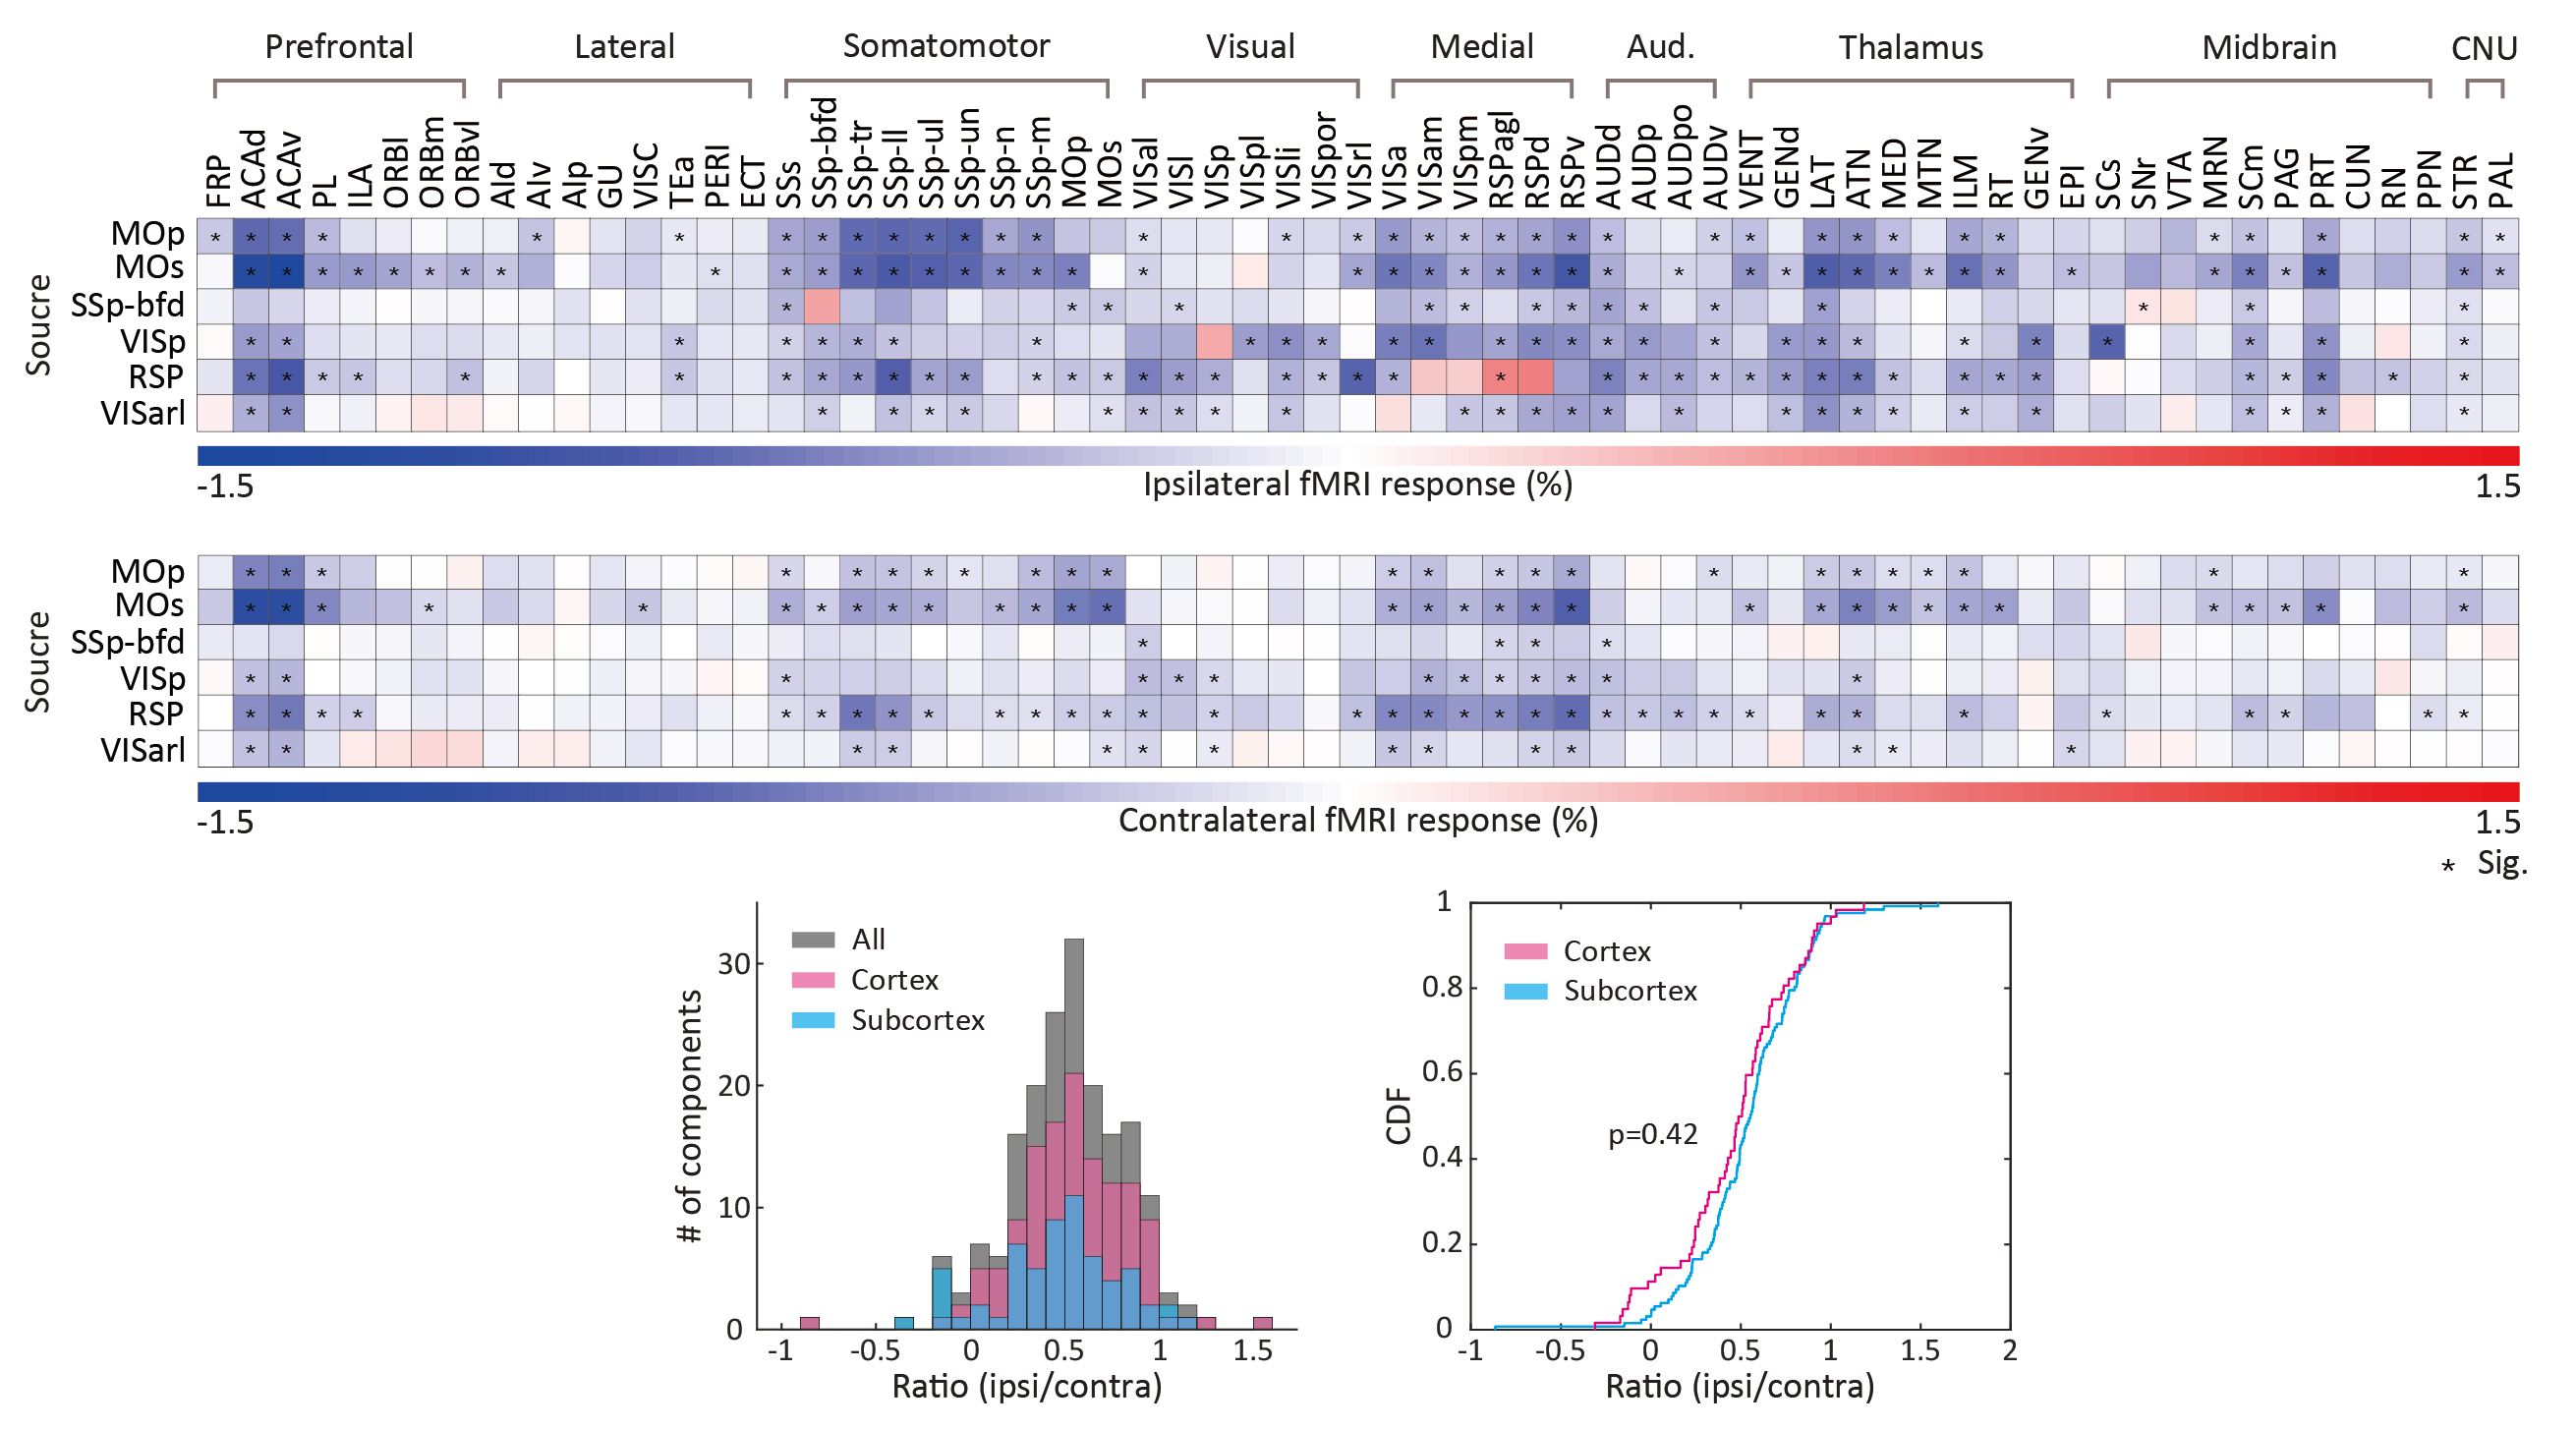
As revealed in our previous work, the optogenetic stimulation of VGAT-expressing inhibitory neurons induced multi-phasic hemodynamic responses at the stimulation sites (Figure 2), while monotonic CBV decreases were observed at other connected regions3 (Figure 3). Moreover, we found depth-dependent responses – the later positive responses are more prominent in superficial layers. Notably, the poststimulus positive response is much greater than that in previous work using the same mouse model3,4. Next, we focused on the suppression of resting-state functional connections pertinent to the stimulation regions (Figure 3). Stimulation of 6 cortical regions led to brain-wide deactivation in downstream cortical and subcortical regions. The response patterns were summarized in ROI-based response matrices, where 65 Allen atlas-based ROIs were defined from the cortex, thalamus, midbrain, and cerebral nuclei (CNU; striatum and pallidum) (Figure 4). Note that response patterns are similar in the ipsilateral and contralateral hemispheres, and there was no cortical-subcortical difference in the distribution of the contralateral vs. ipsilateral ratio.Discussion & Conclusion
We have successfully acquired resting-state EC upon multisite stimulation of VGAT inhibitory neurons. The inhibitory neuron-mediated deactivation was efficient to detect activity reduction throughout the brain, thereby it offers insights into resting-state connectivity. There are several discussion points in our study. First, the stimulation site response exhibited unexpectedly strong poststimulus vasodilation, which has not been reported in previous studies using the same mouse model3,4. As the population of subtype GABAergic neurons is layer-dependent, we speculate that this phenomenon results from the expanded coverage of activation by patterned optogenetic stimulation, whereas the coverage of conventional fiber-based stimulation is limited to the nearby area8. Further layer-dependent studies are required to address this issue. Second, we found robust resting-state EC toward the contralateral hemisphere. Although homotopic bilateral coactivation is commonly observed in conventional resting-state FC studies, the measured resting-state EC reaches nonhomotopic areas even in the subcortex. This might be due to polysynaptic connections, as suggested by a previous structure-function relationship study9. Finally, we averaged 7-10 trials per each animal to boost fMRI sensitivity. As the resting-state FC continuously varies over time, even under anesthesia10, the separation of trials according to the brain state would provide a better understanding of brain connectivity.Acknowledgements
This research was supported by the Institute of Basic Science (IBS-R015-D1).References
1. Damoiseaux, J. S. et al. Consistent resting-state networks across healthy subjects. Proceedings of the National Academy of Sciences 103, 13848-13853 (2006).
2. Van Den Heuvel, M. P. & Pol, H. E. H. Exploring the brain network: a review on resting-state fMRI functional connectivity. European Neuropsychopharmacology 20, 519-534 (2010).
3. Moon, H. S. et al. Contribution of excitatory and inhibitory neuronal activity to BOLD fMRI. Cerebral Cortex 31, 4053-4067 (2021).
4. Jung, W. B., Jiang, H., Lee, S. & Kim, S.-G. Dissection of brain-wide resting-state and functional somatosensory circuits by fMRI with optogenetic silencing. Proceedings of the National Academy of Sciences 119, e2113313119 (2022).
5. Friston, K., Frith, C. & Frackowiak, R. Time‐dependent changes in effective connectivity measured with PET. Human Brain Mapping 1, 69-79 (1993).
6. Kim, S. et al. Whole-brain mapping of effective connectivity by fMRI with cortex-wide patterned optogenetics. bioRxiv, 2022.2007.2012.499420 (2022). https://doi.org:10.1101/2022.07.12.499420
7. Wang, Q. et al. The Allen mouse brain common coordinate framework: a 3D reference atlas. Cell 181, 936-953 (2020).
8. Pisanello, F. et al. Dynamic illumination of spatially restricted or large brain volumes via a single tapered optical fiber. Nature Neuroscience 20, 1180-1188 (2017).
9. Liang, H. & Wang, H. Structure-function network mapping and its assessment via persistent homology. PLoS Computational Biology 13, e1005325 (2017).
10. Gutierrez-Barragan, D. et al. Unique spatiotemporal fMRI dynamics in the awake mouse brain. Current Biology 32, 631-644.e6 (2022).
Figures