1033
Zero echo time MB-SWIFT functional MRI of orientation selective deep brain stimulation of the rat infralimbic cortex using tetrahedral electrode1A.I. Virtanen Institute, Kuopio, Finland, 2Center for Magnetic Resonance Research, Minneapolis, MN, United States
Synopsis
Keywords: Brain Connectivity, fMRI
In this study, the response of the amygdala to 3D orientation selective deep brain stimulation of the infralimbic cortex (IL) was followed using MB-SWIFT fMRI. The aims were to investigate how the fMRI response of the amygdala changes whilst changing the stimulation angle in the IL, and to detect the effects in resting-state functional connectivity when sustained 130 Hz stimulation of the IL at the most effective stimulation angle is used. The fMRI response of the amygdala showed dependence on the stimulation angle and inter-animal variation, which can be exploited for optimizing the stimulation effects.
Introduction
Radial 3D zero echo-time sequence titled Multi-Band Sweep Imaging with Fourier Transformation (MB-SWIFT)1 has been shown to be insensitive to movement- and susceptibility-induced artefacts2,3,4 while it provides similar functional contrast as spin-echo EPI3. These qualities make it a sound choice for deep brain stimulation (DBS) applications where images acquired with EPI sequence suffer from severe susceptibility artifacts in the vicinity of the electrodes.DBS of the subgenual anterior cingulate cortex (sgACC) has shown beneficial responses in individual patients suffering from treatment resistant depression5, but variable results in larger patient populations6. One likely reason for this variability is the challenging anatomy of sgACC with crossing neural tracts and individual local differences7. One potential method for improving the success of sgACC DBS is a recently introduced method of orientation selective stimulation (OSS) where the primary electric field direction can be adjusted at any angle on a plane around the electrode8.
In this study, a tetrahedral electrode allowing OSS in 3D was used to study the applicability of 3D-OSS in the infralimbic cortex (IL), the rat homologue of sgACC9,10. The aims of this study were to investigate how the amygdala response changes with varying stimulation angle at IL and to detect the effects in resting-state functional connectivity using MB-SWIFT fMRI during sustained 130 Hz stimulation of IL at the most effective stimulation angle.
Methods
Animal procedures were approved by the Finnish Animal Experiment Board. Adult male Sprague-Dawley rats (n = 25) were used. A custom-made tetrahedral electrode consisting of four tungsten wires (diameter 127 μm) was implanted in the left IL (Fig 1A,B, n=21). A 6-channel recording probe made of 50 μm nichrome wires was implanted to the left amygdala. For OSS, the stimulation angle was adjusted in steps of 45o on the plane connecting three electrodes at a time11 (Fig 1C).First, we determined how the angle of the stimulation current vector in the IL modifies the fMRI responses (n=9) and the local field potentials (LFP, n=12) in the amygdala. The most effective stimulation angle for each animal was selected based on maximum amygdala activation. Then, the ability of the most effective stimulation to activate IL connected brain wide resting-state networks was assessed. For that, resting-state fMRI was measured in 10 min blocks first without stimulation, followed by 130 Hz continuous stimulation, and finally again without stimulation.
fMRI data were acquired under isoflurane-medetomidine anesthesia at 9.4 T with a 22-mm transmit-receive loop coil using MB-SWIFT sequence with the following parameters: TR=0.97 ms, 2036 spokes, temporal resolution ~2 s, excitation/acquisition bandwidths=192/384 kHz, matrix=643, FOV=4.0/3.2x4.0/3.2x4.0/6.4 cm3, and flip angle=5°.
The fMRI stimulation paradigm for exploring the effect of stimulation angle consisted of 60 s of rest and 18 s of stimulation, repeated three times, ending in 60 s of rest. Stimulation was achieved using 1-ms square, biphasic charge balanced pulses. The pulse amplitude was 1.0-1.4 mA with 20 Hz stimulation frequency in the angle dependence experiments, and 0.3-0.8 mA in the resting-state fMRI experiments.
Tractography was performed to assess the orientation of the fiber bundles connecting the IL and amygdala. For that, ex vivo diffusion MRI data (n=4) were acquired at 9.4 T using a 20-mm quadrature volume RF-coil as a transceiver. A 3D SE-EPI sequence with the following parameters was used: TR/TE=300/25 ms, 8 segments, 2 averages, matrix=144x128x192, spatial resolution=100×100×100 μm3; b-values 1500, 2500 and 4500 s/mm2 with 17, 30 and 35 directions, respectively; δ=4.9 ms, and Δ=10.8 ms.
The fMRI data were processed using similar pipeline as earlier2 using MATLAB, Aedes, ANTs, Python 3.6.9, and SPM8.
Results
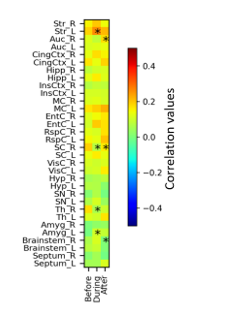
The fMRI response of the amygdala showed dependence on the stimulation angle (Fig 2A), and inter-animal variation was seen. Despite the resting period of 2-3 min between scans and the randomization of the stimulation angles, some adaptation to stimulation was detected during the experiment. Because adaptation may affect the determination of the most effective direction, the most effective angle was determined for different animals from the LFP measurements that used fewer stimulation pulses. The amygdala evoked responses depended systematically on the IL stimulation field orientation (Fig 2B) and yielded the maximum response in group level in near vertical field orientation in accordance with tractography (Fig 3). The fMRI responses to stimulation could be robustly detected next to the electrodes both at IL and at amygdala (Fig 4). The sustained 130 Hz stimulation with the most effective angle increased functional connectivity between IL and amygdala on the stimulation side (Fig 5).Discussion
The rat IL is an intersection with highly variable axonal fiber orientation. IL stimulation yielded variable fMRI and local evoked responses in amygdala depending on the stimulation angle. At the group level, the highest amygdala LFP responses arose from the most vertical stimulation orientation, which was aligned with the main axonal bundle connecting IL with amygdala (Fig 3).Conclusion
MB-SWIFT fMRI has high potential to be used for optimization of DBS in individual subjects as it can detect activation robustly also in the vicinity of electrodes. Furthermore, it can be utilized for resting-state fMRI to investigate stimulation invoked changes in the functional connectivity. Novel tetrahedral multichannel electrode provides flexibility for OSS in 3D.Acknowledgements
This work was supported by NIH grants P41 EB027061, U01 NS103569, Erkko foundation, and the Academy of Finland.
References
1. Idiyatullin, D, Corum, CA, Garwood, M. Multi-Band-SWIFT. J Magn Reson. 2015;25119-25.
2. Paasonen J, Laakso H, Pirttimäki T, et al. Multi-band SWIFT enables quiet and artefact-free EEG-fMRI and awake fMRI studies in rat. Neuroimage. 2020;206:116338.
3. Lehto LJ, Idiyatullin D, Zhang J, et al. MB-SWIFT functional MRI during deep brain stimulation in rats. Neuroimage. 2017;159:443-448.
4. Laakso H, Lehto LJ, Paasonen J et al. Spinal cord fMRI with MB‐SWIFT for assessing epidural spinal cord stimulation in rats. Magn Reson Med. 2021;86(4):2137–2145.
5. Mayberg HS, Lozano AM, Voon V, et al. Deep brain stimulation for treatment-resistant depression. Neuron. 2005;45(5):651-60.
6. Holtzheimer PE, Husain MM, Lisanby SH, et al. Subcallosal cingulate deep brain stimulation for treatment-resistant depression: a multisite, randomised, sham-controlled trial. Lancet Psychiatry. 2017;4(11):839-849.
7. Howell B, Choi KS, Gunalan K, et al. Quantifying the axonal pathways directly stimulated in therapeutic subcallosal cingulate deep brain stimulation. Hum Brain Mapp. 2019;40(3):889-903.
8. Lehto LJ, Slopsema JP, Johnson MD, et al. Orientation selective deep brain stimulation. J Neural Eng. 2017;14(1):016016.
9. Gabbott PLA, Warner TA, Jays PRL, Bacon SJ. Areal and synaptic interconnectivity of prelimbic (area 32), infralimbic (area 25) and insular cortices in the rat. Brain Res. 2003;993:59–71.
10. Uylings HB, Groenewegen HJ, Kolb B. Do rats have a prefrontal cortex? Behav. Brain Res. 2003;146:3–17.
11. Lehto LJ, Filip P, Laakso H, et al. Tuning Neuromodulation Effects by Orientation Selective Deep Brain Stimulation in the Rat Medial Frontal Cortex. Front Neurosci. 2018;12:899.
Figures
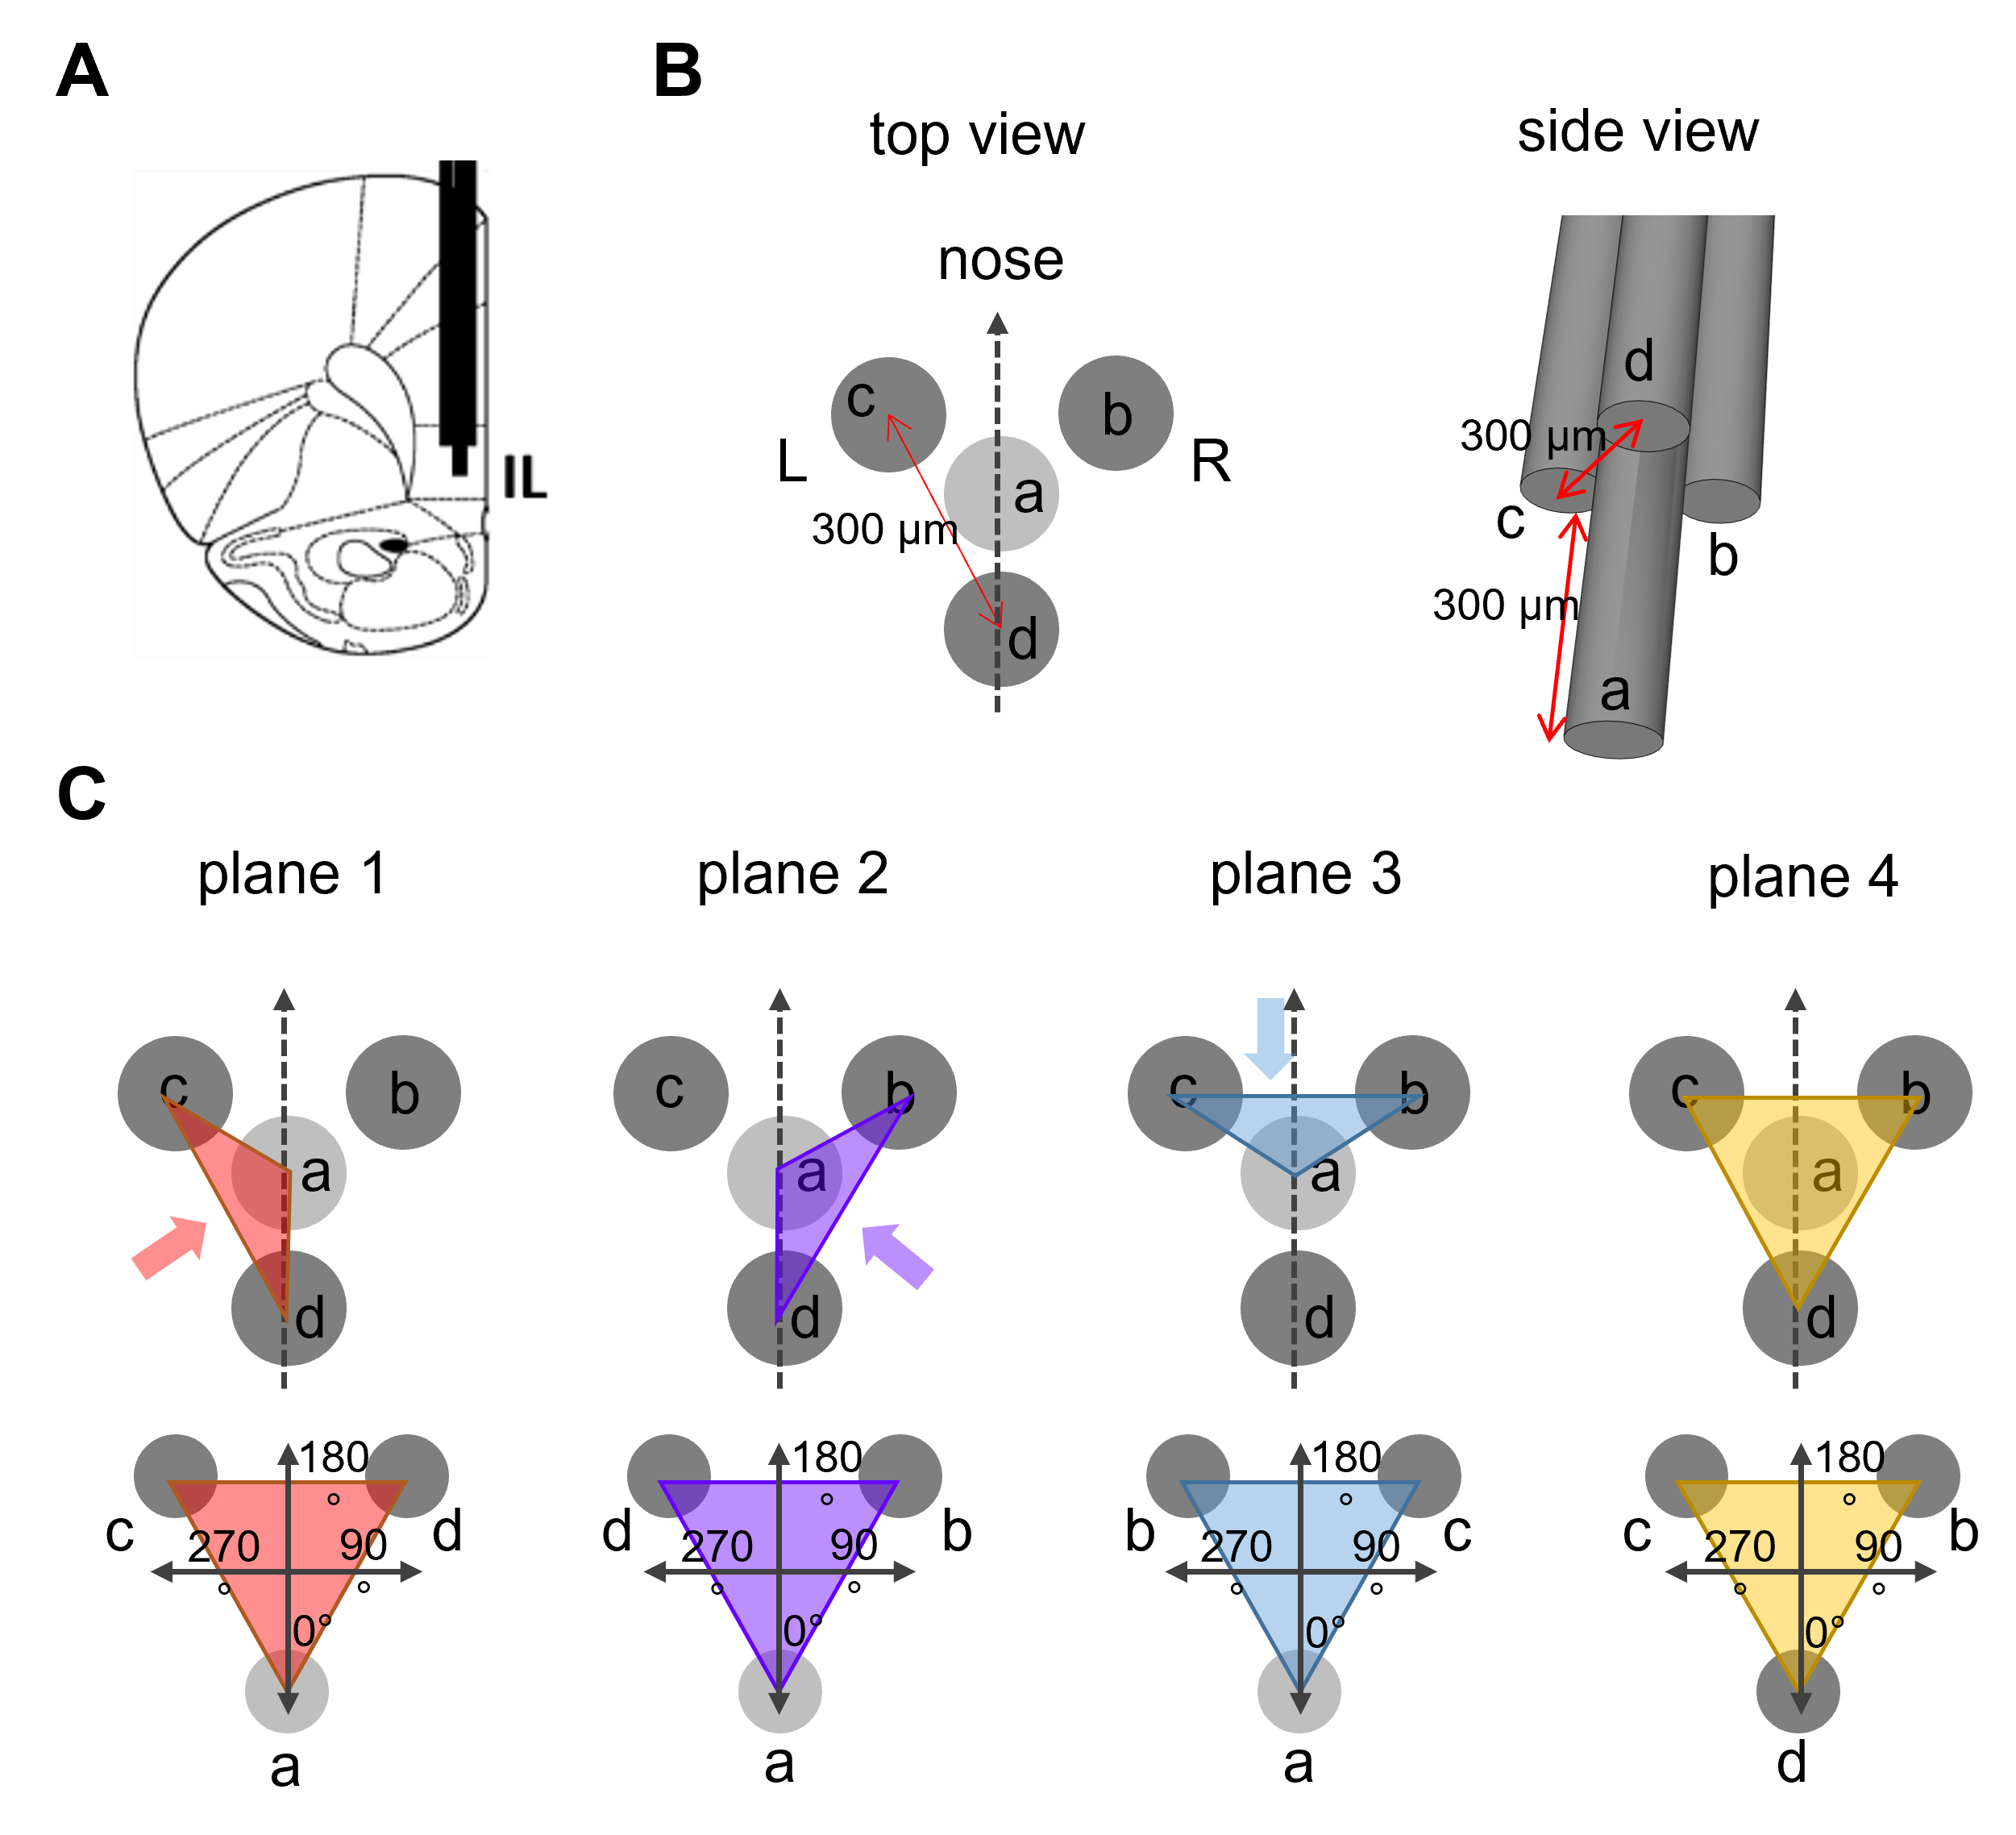
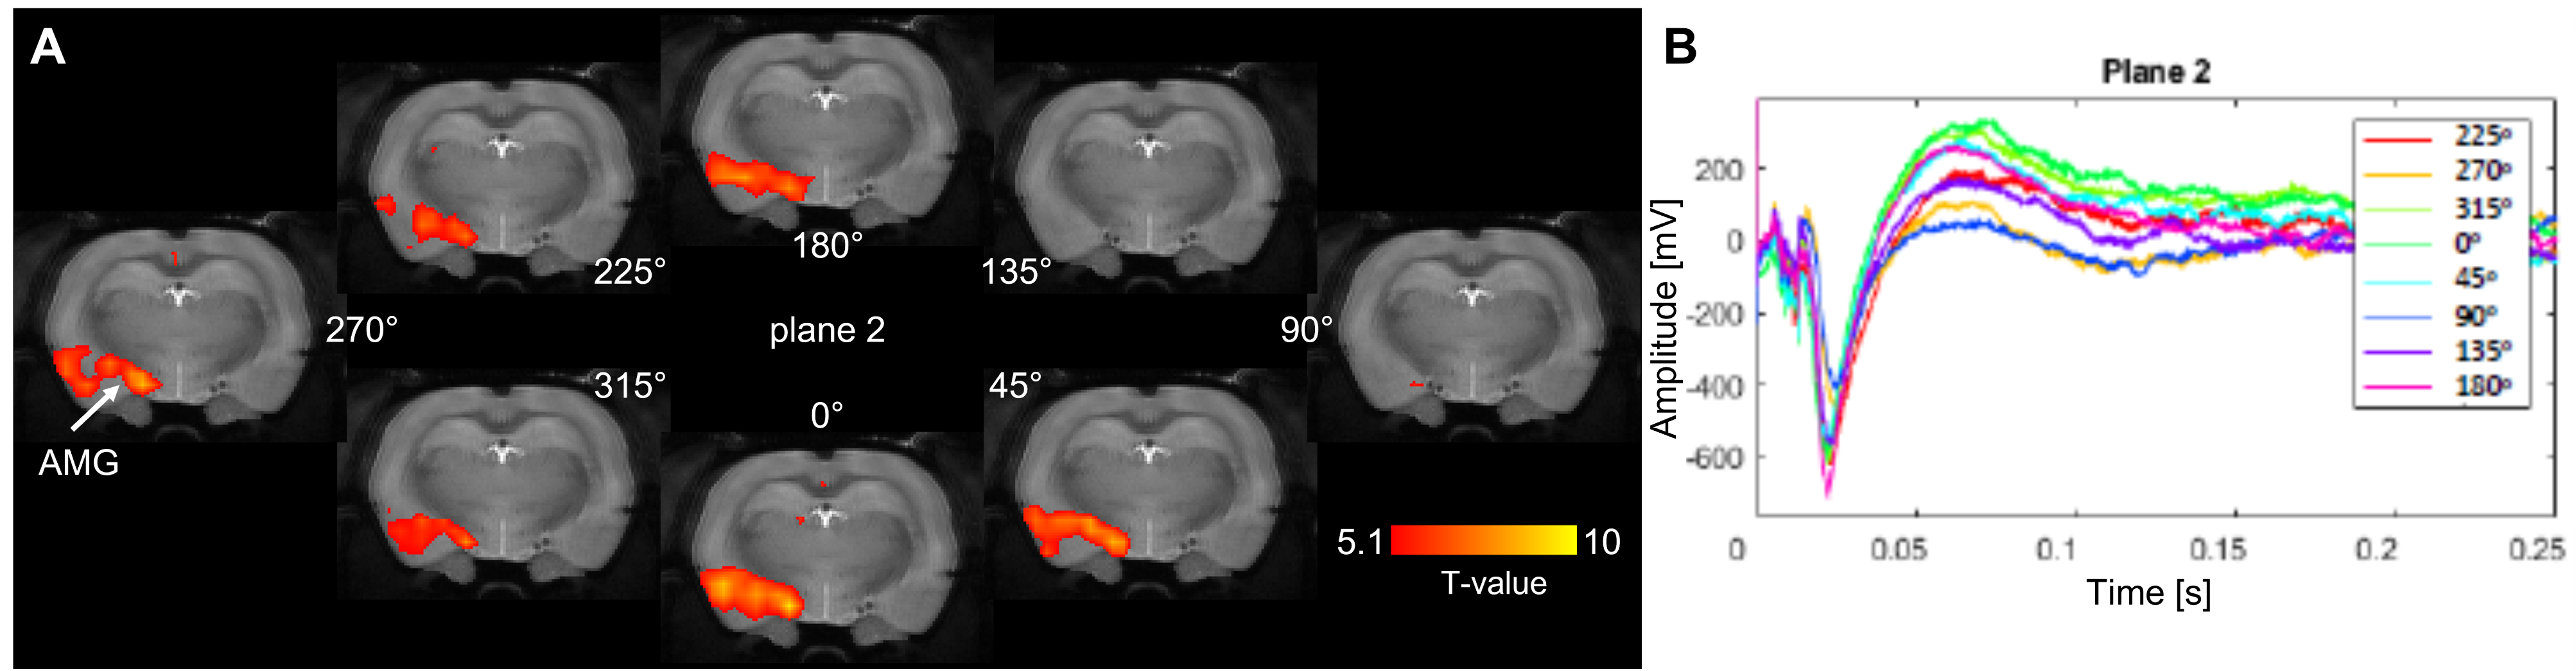
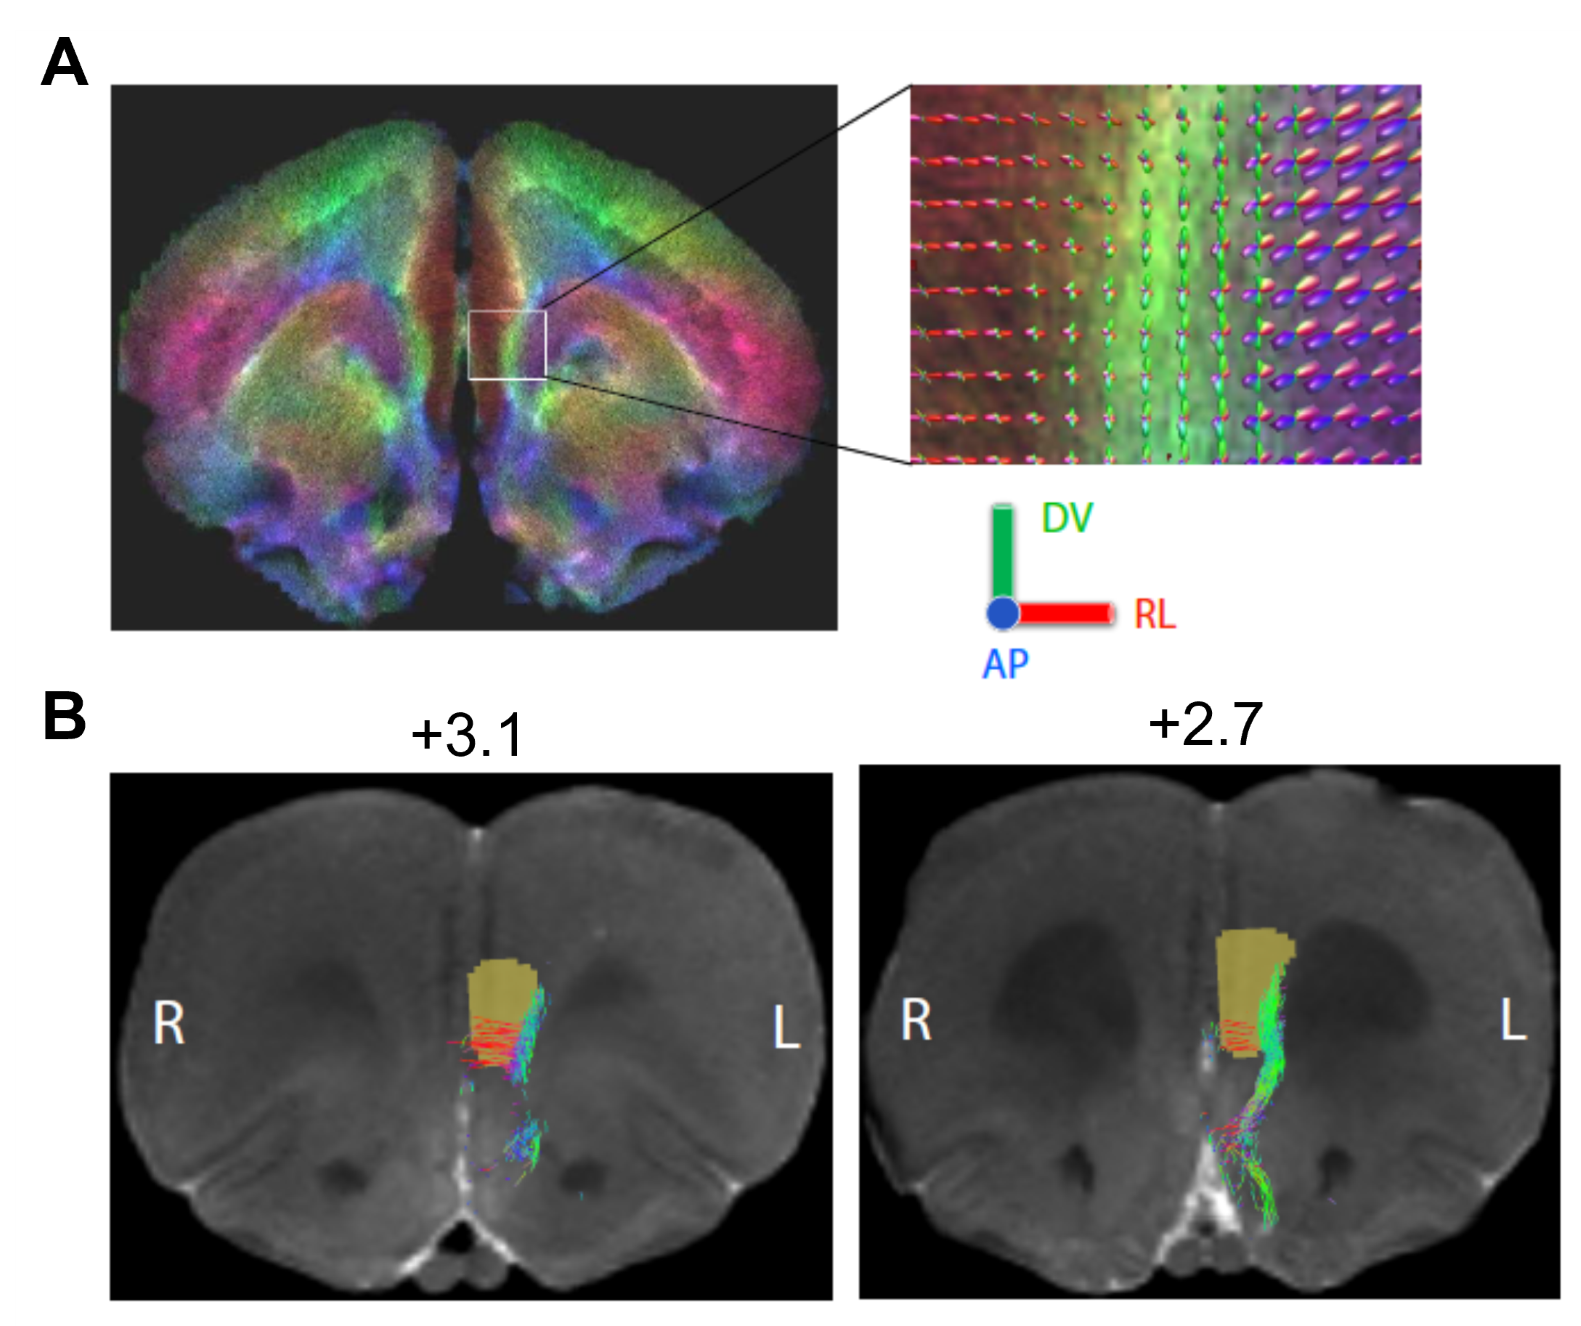
Figure3. Tracing of connections between infralimbic cortex (IL) and amygdala. Whole brain tractography of a rat ex vivo brain at the level of IL (A). The color coding indicates different principal directions of fibers: red = medial-lateral, green = dorsal-ventral, blue = anterior-posterior. The inset shows fiber orientation distributions in each voxel. Probabilistic tractography of fibers connecting IL with amygdala shown on two 100-μm coronal MRI slices (distance from bregma indicated) (B). The brown region-of-interest was used as a seed in the propagation of the tracts.
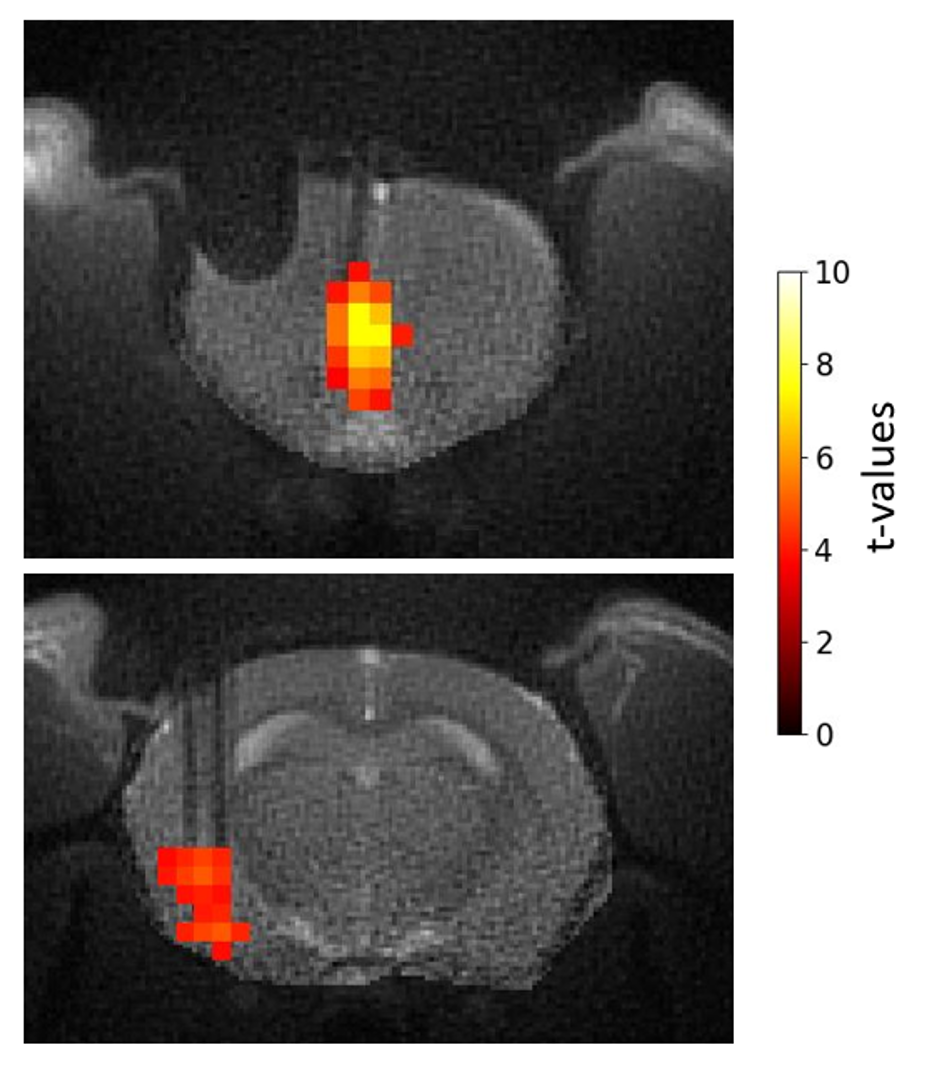
Figure 4. Example of activation maps of one rat at the level of IL (top) and amygdala (bottom) in response to 130 Hz IL stimulation at the most effective direction.