1031
Comparing Techniques for Multi-Site Harmonization of Structural Connectivity1Computer Science, Vanderbilt University, Nashville, TN, United States, 2Biomedical Engineering, Vanderbilt University, Nashville, TN, United States, 3Vanderbilt Memory and Alzheimer's Center, Vanderbilt University Medical Center, Nashville, TN, United States, 4Vanderbilt Genetics Institute, Vanderbilt University School of Medicine, Nashville, TN, United States, 5Department of Neurology, Vanderbilt University Medical Center, Nashville, TN, United States, 6Department of Radiology and Radiological Sciences, Vanderbilt University Medical Center, Nashville, TN, United States, 7Department of Medicine, Vanderbilt University Medical Center, Nashville, TN, United States, 8Laboratory of Behavioral Neuroscience, National Institute on Aging, National Institutes of Health, Baltimore, MD, United States, 9Laboratory of Behavioral Neuroscience, National Institute on Aging, Baltimore, MD, United States, 10Vanderbilt University Institute of Imaging Science, Vanderbilt University, Nashville, TN, United States
Synopsis
Keywords: Brain Connectivity, Diffusion/other diffusion imaging techniques
Tractography is a method to reconstruct white matter microstructure from DWI information and connectomics maps this reconstruction to a graph representation. We compute modularity, assortativity, global efficiency, and average betweenness centrality on this graph. We model changes in these measures with age and sex using DWI for healthy patients from two sites. Data from different sites requires harmonization to remove site-effects. We compare performances of ComBat and LinearRISH harmonization techniques at reducing CoV and removing confounding site-effects from associated linear models. We find that ComBat is effective at both and using LinearRISH in addition acts synergistically at harmonizing site differences.INTRODUCTION
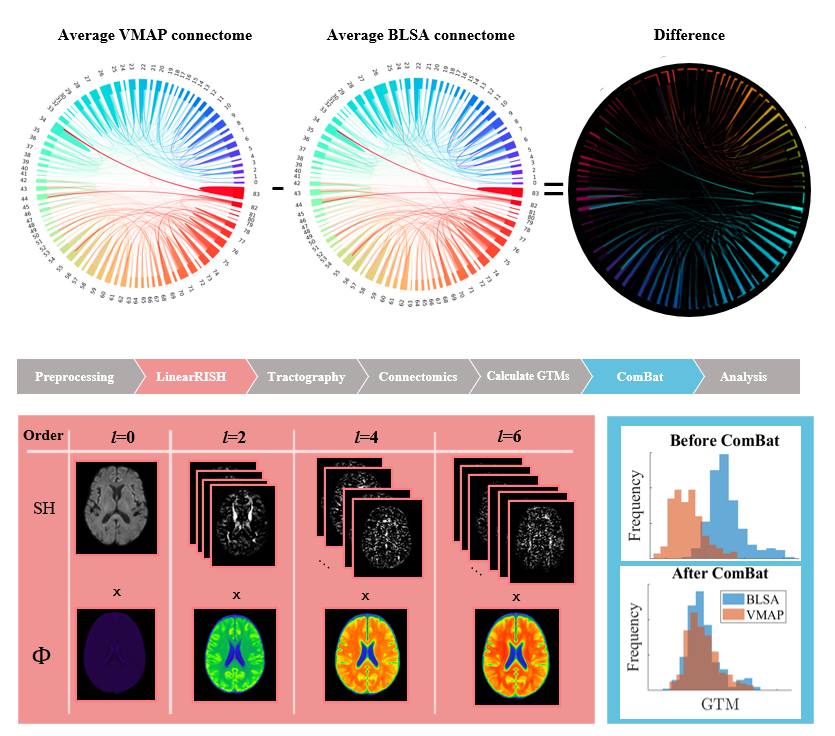
Diffusion weighted imaging (DWI) is a non-invasive, in-vivo imaging modality 1. Tractography is a method to reconstruct white matter microstructure from DWI information 2–4. Connectomics is the mapping of this reconstruction to a graph representation called a connectome 5. Using this graph representation, we can use established graph theory analyses to understand the connectivity of the brain. Graph theory measures (GTMs) quantify brain community, resilience, efficiency, and centrality6. Ideally, larger patient populations yield greater statistical power to detect these changes. Large human imaging studies often achieve this by leveraging imaging collected from multiple sites. Unfortunately, data from different sites are often not directly comparable due to differences in data acquisition and/or scanners and introduce confounding differences for graph theory analysis 7 8,9. Two common approaches to removing these effects are LinearRISH and Combined association testing (e.g., ComBat) 10. The impact of these harmonization methods on graph theoretical analysis is not well understood (Figure 1).METHODS
We characterize four complex GTMs (modularity, characteristic path length, global efficiency, and betweenness centrality) in 117 participants from the Baltimore Longitudinal Study of Aging (BLSA) with 1:1 sex and age matched participants from the Vanderbilt Memory and Aging Project (VMAP). The population contains healthy patients aged 59 to 92 with 64 women. We evaluate two harmonization techniques, ComBat (feature harmonization) and LinearRISH (DWI harmonization), on their ability to harmonize site differences while preserving microstructural changes associated with aging.Tractography and connectomics
For tractography, we used the MRTrix default probabilistic tracking algorithm11. We generated 10 million streamlines per acquisition. After, we converted the tractogram to a connectome using the Desikan-Killany atlas 12 with 84 cortical parcellations from Freesurfer 13.
We compute modularity, average betweenness centrality, assortativity, and global efficiency for each connectome using the Brain Connectivity Toolbox (BCT) Matlab implementation 6.
Harmonization
We used the Matlab implementation of ComBat to perform feature-level harmonization on the GTMs 14. ComBat creates a multivariate linear mixed effects regression model whose parameters are optimized with an empirical Bayes approach. Such model corrects for multiplicative and additive site effects. It is a computationally inexpensive harmonization method and is performed at the end of processing on the GTM data (Figure 1).
LinearRISH is a harmonization technique that scales rotation invariant features of DWI to remove scanner specific differences in white matter for a group of age matched subjects 15. It is applied before tractography and consists of: extracting spherical harmonic (SH) coefficients for all orders l=0,2,4,6 and degrees, registering to common space, computing the scale map (Φ) from VMAP to BLSA, registering and applying the scale map to VMAP SH coefficients, and finally converting back to the signal intensity domain.
Performance evaluation
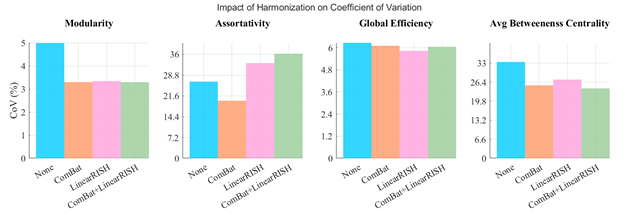
First, we characterize across dataset coefficients of variation (CoV), a common metric used in harmonization studies 7. Coefficient of variation (CoV) of a group of measurements is the ratio of the standard deviation and mean multiplied by 10016. Here, we compare CoV before and after each harmonization technique is applied to VMAP and BLSA.
We fit linear models with site, age, and sex effect variables with the following formula:
$$$ GTM = 1 + Sex+Age+Site $$$
RESULTS
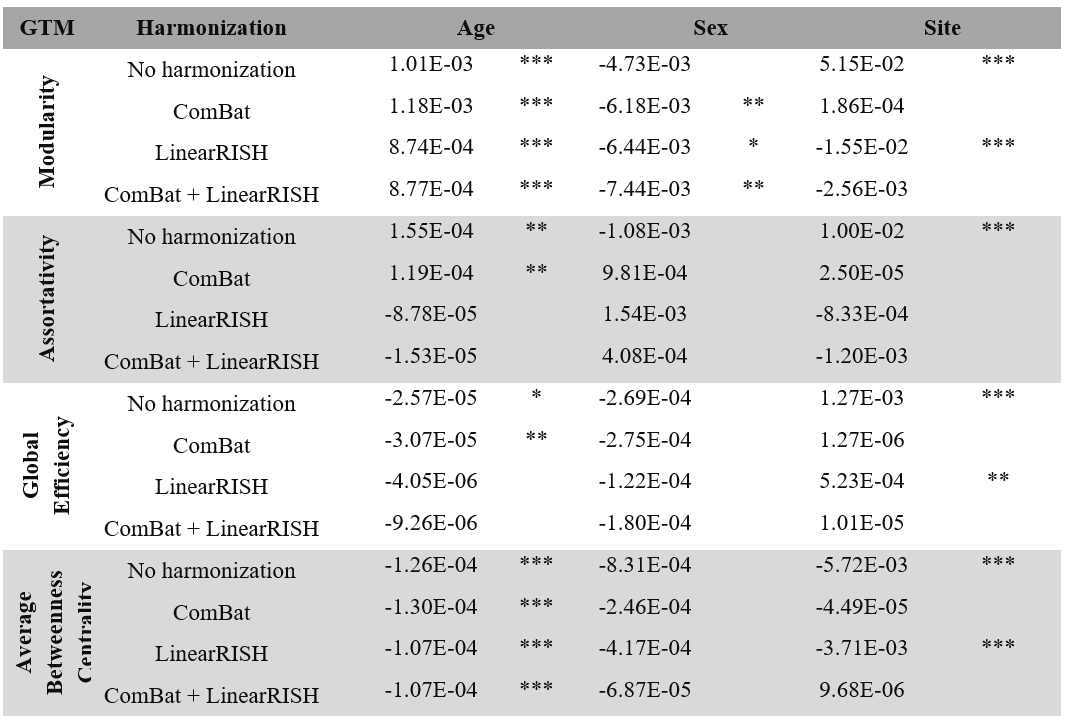
While both methods reduced CoV for all measures, only ComBat reduced CoV for assortativity (Figure 2). Modularity and average betweenness centrality experience a stronger decrease when ComBat and LinearRISH are used in combination indicating they behave synergistically for certain GTMs.In Table 1 we report the linear model coefficients of each effect (age, sex, and site) with their significance. Effective harmonization techniques will remove site-related contributions. We examine the linear model site effect significance before and after harmonization.
DISCUSSION
No harmonization method achieves lowest CoV consistently across all graph measures; however, ComBat improves CoV from baseline for each GTM. LinearRISH has similar performance to ComBat in all measures except assortativity where it introduces a significant increase in variation. The combined harmonization offers some additional improvement to variation in all except assortativity.Without harmonization, each GTM has a significant site effect present and confounding the model. After applying ComBat alone or with LinearRISH, the site effect is no longer significant. For very strong covariates (age in modularity and average betweenness centrality) we find similar effect sizes across harmonization methods. ComBat and LinearRISH seem to be additive. However, LinearRISH alone is not enough for three of the four GTMs studied. Weaker effects (age in assortativity and global efficiency) disappear when using LinearRISH. This could be caused by a biasing effect in the DWI that LinearRISH corrects.
In summary, ComBat is effective at decreasing CoV of data from multiple sites and removing significant site effect from derived data models. ComBat and LinearRISH have the capacity to work synergistically and create a combined decrease in variation and increase in model strength.
We advise caution when implementing these methods. LinearRISH is applied before tractography and thus affects downstream tasks. In future studies we hope to characterize the potential bias introduced in RISH template construction.
CONCLUSION
Overall, we recommend harmonizing multi-site studies with ComBat with LinearRISH but caution to check the assumptions for each method to ensure neither introduces additional confounding bias.Acknowledgements
This work was conducted in part using the resources of the Advanced Computing Center for Research and Education at Vanderbilt University, Nashville, TN. This work was supported by the National Institutes of Health (NIH) under award numbers K01EB032989, K24-AG046373, K01-AG073584, and R01-AG034962, the National Science Foundation (NSF) under award number 2040462, the Alzheimer’s Association under award IIRG-08-88733, the Vanderbilt Clinical Translational Science Awards UL1-TR000445 and UL1-TR002243, and Vanderbilt’s High-Performance Computer Cluster for Biomedical Research under award S10-OD023680. This research was conducted with the support from the Intramural Research Program of the National Institute on Aging of the NIH. The content is solely the responsibility of the authors and does not necessarily represent the official views of the NIH or NSF.References
1. Conturo, T. E. et al. Tracking neuronal fiber pathways in the living human brain. Applied Physical Sciences 96, 10422–10427 (1999).
2. Essayed, W. I. et al. White matter tractography for neurosurgical planning: A topography-based review of the current state of the art. Neuroimage Clin 15, 659–672 (2017).
3. Mori, S. & van Zijl, P. C. M. Fiber tracking: principles and strategies - a technical review. NMR Biomed 15, 468–480 (2002).
4. Zhang, J. et al. Three-dimensional anatomical characterization of the developing mouse brain by diffusion tensor microimaging. Neuroimage 20, 1639–1648 (2003).
5. Bullmore, E. & Sporns, O. Complex brain networks: graph theoretical analysis of structural and functional systems. Nat Rev Neurosci 10, 186–198 (2009).
6. Rubinov, M. & Sporns, O. Complex network measures of brain connectivity: uses and interpretations. Neuroimage 52, 1059–1069 (2010).
7. Vollmar, C. et al. Identical, but not the same: Intra-site and inter-site reproducibility of fractional anisotropy measures on two 3.0 T scanners. Neuroimage 51, 1384–1394 (2010).
8. Magnotta, V. A. et al. MultiCenter Reliability of Diffusion Tensor Imaging. Brain Connect 2, 345 (2012).
9. Matsui, J. T. Development of image processing tools and procedures for analyzing multi-site longitudinal diffusion-weighted imaging studies. (2014) doi:10.17077/ETD.LRTGIVKX.
10. Fortin, J. P. et al. Harmonization of multi-site diffusion tensor imaging data. Neuroimage 161, 149–170 (2017).
11. (ISMRM 2010) Improved Probabilistic Streamlines Tractography by 2nd Order Integration Over Fibre Orientation Distributions. https://archive.ismrm.org/2010/1670.html.
12. Klein, A. & Tourville, J. 101 labeled brain images and a consistent human cortical labeling protocol. Front Neurosci 0, 171 (2012).
13. Fischl, F. B. FreeSurfer. (2012) doi:10.1016/j.neuroimage.2012.01.021.
14. Jfortin1/ComBatHarmonization: Harmonization of multi-site imaging data with ComBat. https://github.com/Jfortin1/ComBatHarmonization.
15. Mirzaalian, H. et al. Harmonizing Diffusion MRI Data Across Multiple Sites and Scanners. doi:10.1007/978-3-319-24553-9_2.
16. Abdi, H. Encyclopedia of Research Design. (2010).
Figures