1030
Electrophysiological correlates of BOLD events with high cofluctuation amplitude in the resting human brain1Institute for Systems and Robotics - Lisboa and Department of Bioengineering, Instituto Superior Técnico, University of Lisbon, Lisboa, Portugal, 2Basque Center on Cognition, Brain and Language, Donostia - San Sebastián, Spain
Synopsis
Keywords: Brain Connectivity, fMRI (resting state)
fMRI studies have shown that the large-scale organization of resting-state functional brain networks can be largely explained by a small fraction of events exhibiting high cofluctuation amplitude. However, their neurobiological relevance remains unclear. We investigated the electrophysiological origins of high cofluctuation amplitude BOLD events using concurrent EEG-fMRI data acquired from humans. We found that high amplitude cofluctuations were associated with higher delta power and lower alpha power. This association was specifically observed when considering delays ~6s between EEG and BOLD signals, supporting its neurovascular origin and suggesting that high cofluctuation BOLD events have a neurophysiological origin.Introduction
Several fMRI studies have shown that the large-scale organization of functional brain networks observed in resting-state can be largely explained by a small fraction of brief, spontaneous events exhibiting high signal or cofluctuation amplitude across the brain [1-7]. Modelling functional connectivity (FC) in terms of high-amplitude cofluctuation events has recently been linked to better subject identifiability and brain-behaviour correlation [6,8]. However, not only does the origin of these events remain unclear, but also their neurobiological relevance has been questioned as they can also be derived from null models of static FC [9,10]. To our knowledge, only one previous study has addressed this question in rats, by showing a relationship with the amplitude of local field potentials [11]. Here, we aim to shed further light on the electrophysiological origins of high cofluctuation amplitude BOLD events using concurrent EEG-fMRI data acquired from humans.Methods
Simultaneous EEG-fMRI data was collected from 14 healthy subjects during 7 mins of eyes-open resting state. BOLD-fMRI data were acquired on a 3T Siemens Vida system with a 64-channel head coil using 2D-EPI (TR/TE=1260/30ms, GRAPPA=2, SMS=3, 60 slices, 2.2mm isotropic resolution). EEG data were acquired at 5000Hz using a 32-channel MR-compatible EEG system (Brain Products).fMRI preprocessing using FSL included: distortion correction, motion realignment, high-pass filtering, and nuisance regression of realignment parameters, motion outliers, and average CSF and WM signals. Preprocessed data were then parcellated using the AAL atlas (90 regions), bandpass filtered (0.01-0.2Hz), and z-scored. For each time frame (TR), the instantaneous cofluctuation between each pair of regions was computed as the product of their BOLD signals, yielding edges time series [6]. The cofluctuation amplitude was quantified by computing the root sum of squares (RSS) across all edges in each TR, yielding an RSS timeseries. High cofluctuation amplitude TR’s (high-RSS) were identified in each subject as those exhibiting an RSS significantly above the distribution of 1000 surrogates (p<0.001). An equal number of low-RSS TRs was also identified.
EEG data analysis using Matlab included: reduction of gradient and pulse artifacts, downsampling to 250Hz, bandpass filtering to 0.3-70Hz, robust re-referencing, ICA denoising, and interpolation of signal amplitude outliers (>mean±4SD). For each TR, the relative band power was extracted for the delta (2-4Hz), theta (4-8Hz), alpha (8-12Hz) and beta (12-20Hz) bands, through normalisation by the total power (2-20Hz) in each subject. Frequencies <2Hz and >20Hz were discarded to minimise residual artifact contamination.
The relationship between the fMRI RSS and the EEG relative bandpower in each channel was estimated by fitting a linear mixed effects model across all time frames and subjects with subject as random factor. Multiple delays between the EEG and fMRI signals were considered: 0-12.6s in steps of TR=1.26s. The EEG bandpower was also compared specifically between high and low RSS time frames using a Wilcoxon test. For the joint EEG-fMRI analyses, TRs that were fMRI motion outliers and/or contained >2% of EEG outliers in >1 channel were discarded. All statistical tests were FDR-corrected for multiple comparisons (across channels, frequency bands and delays).
Results
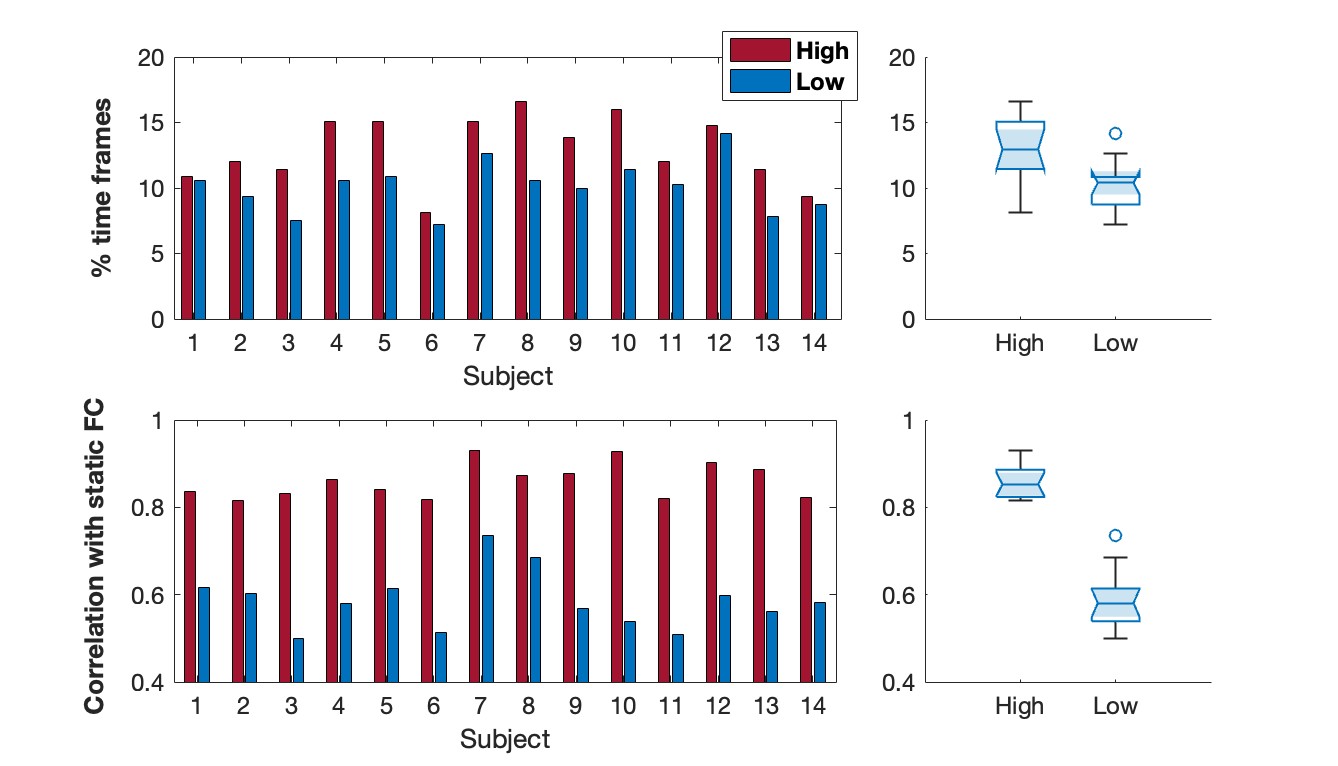
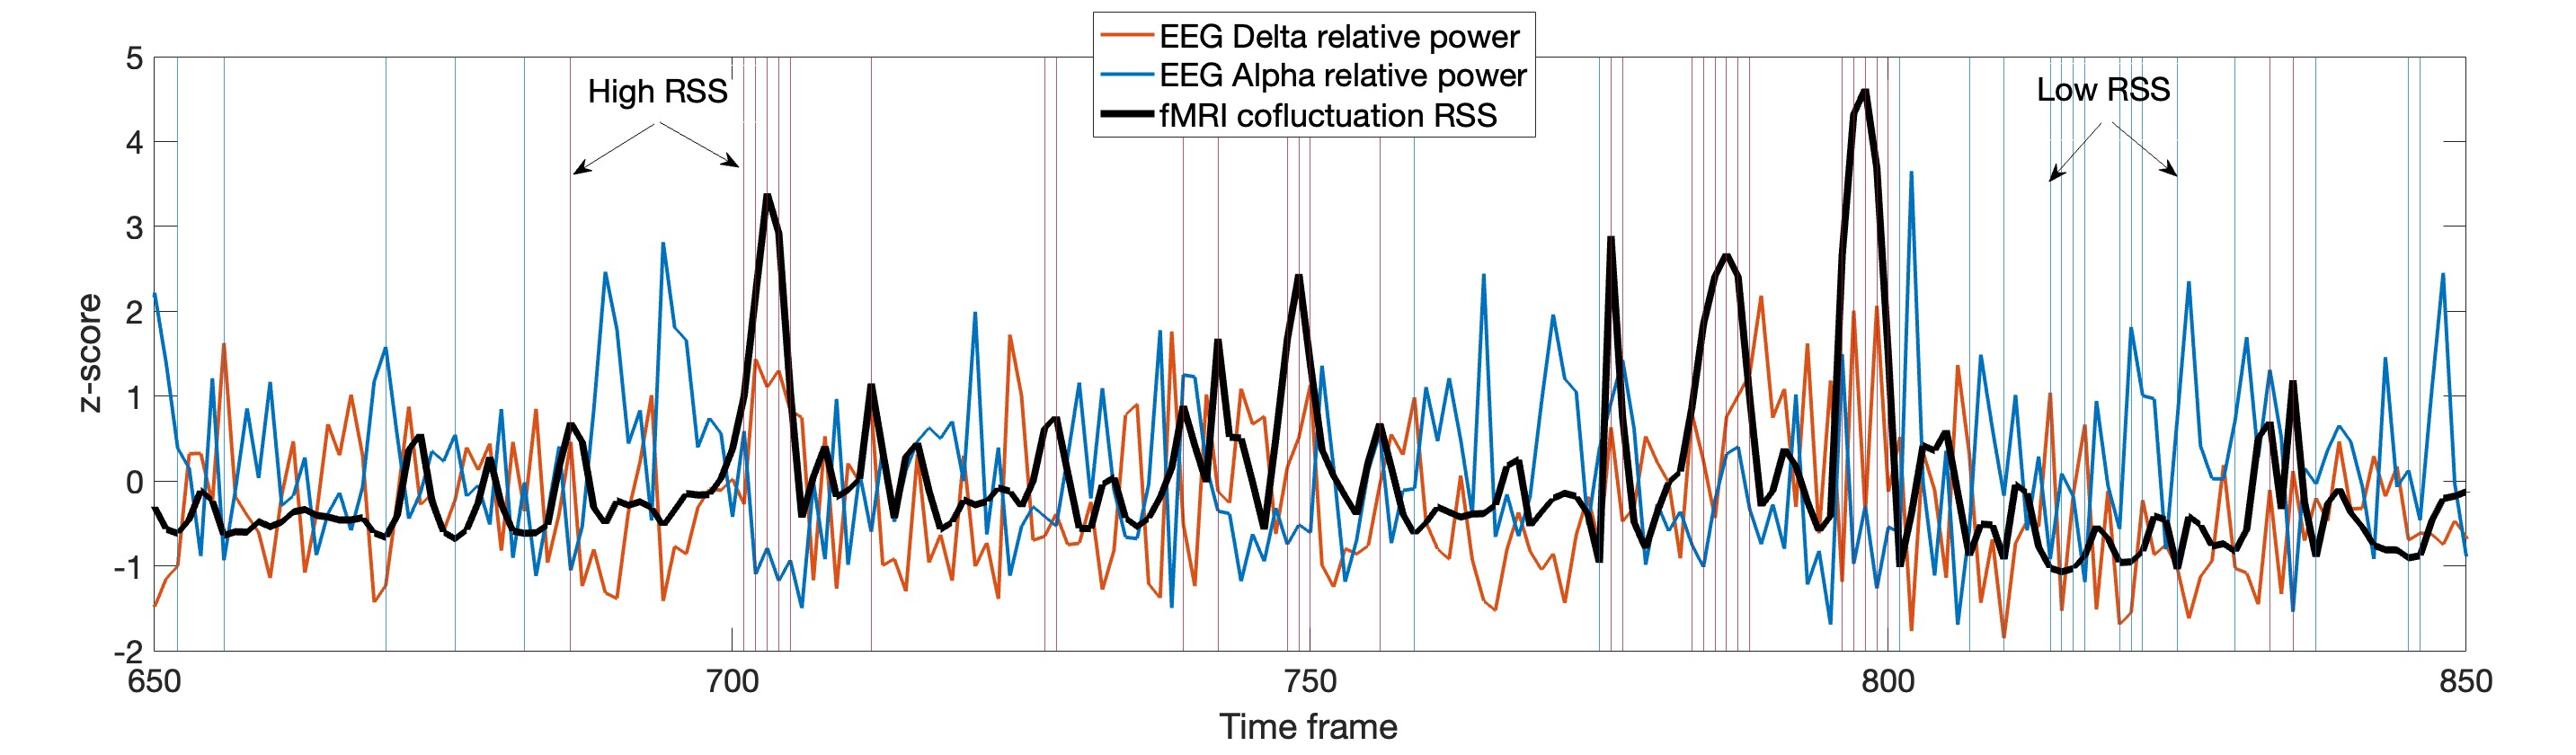
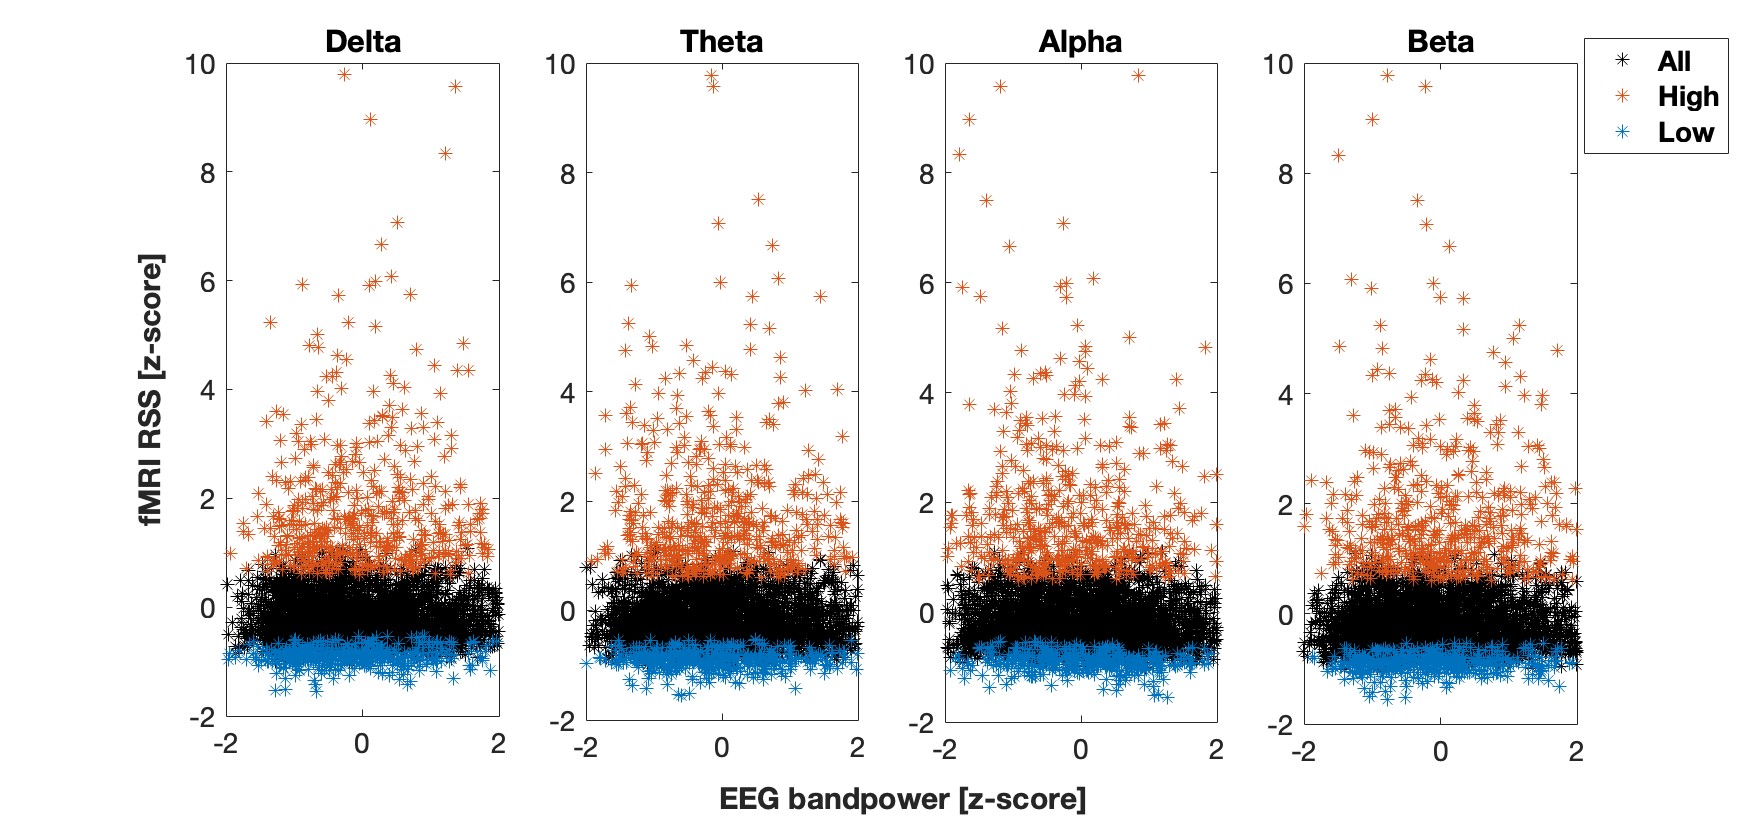
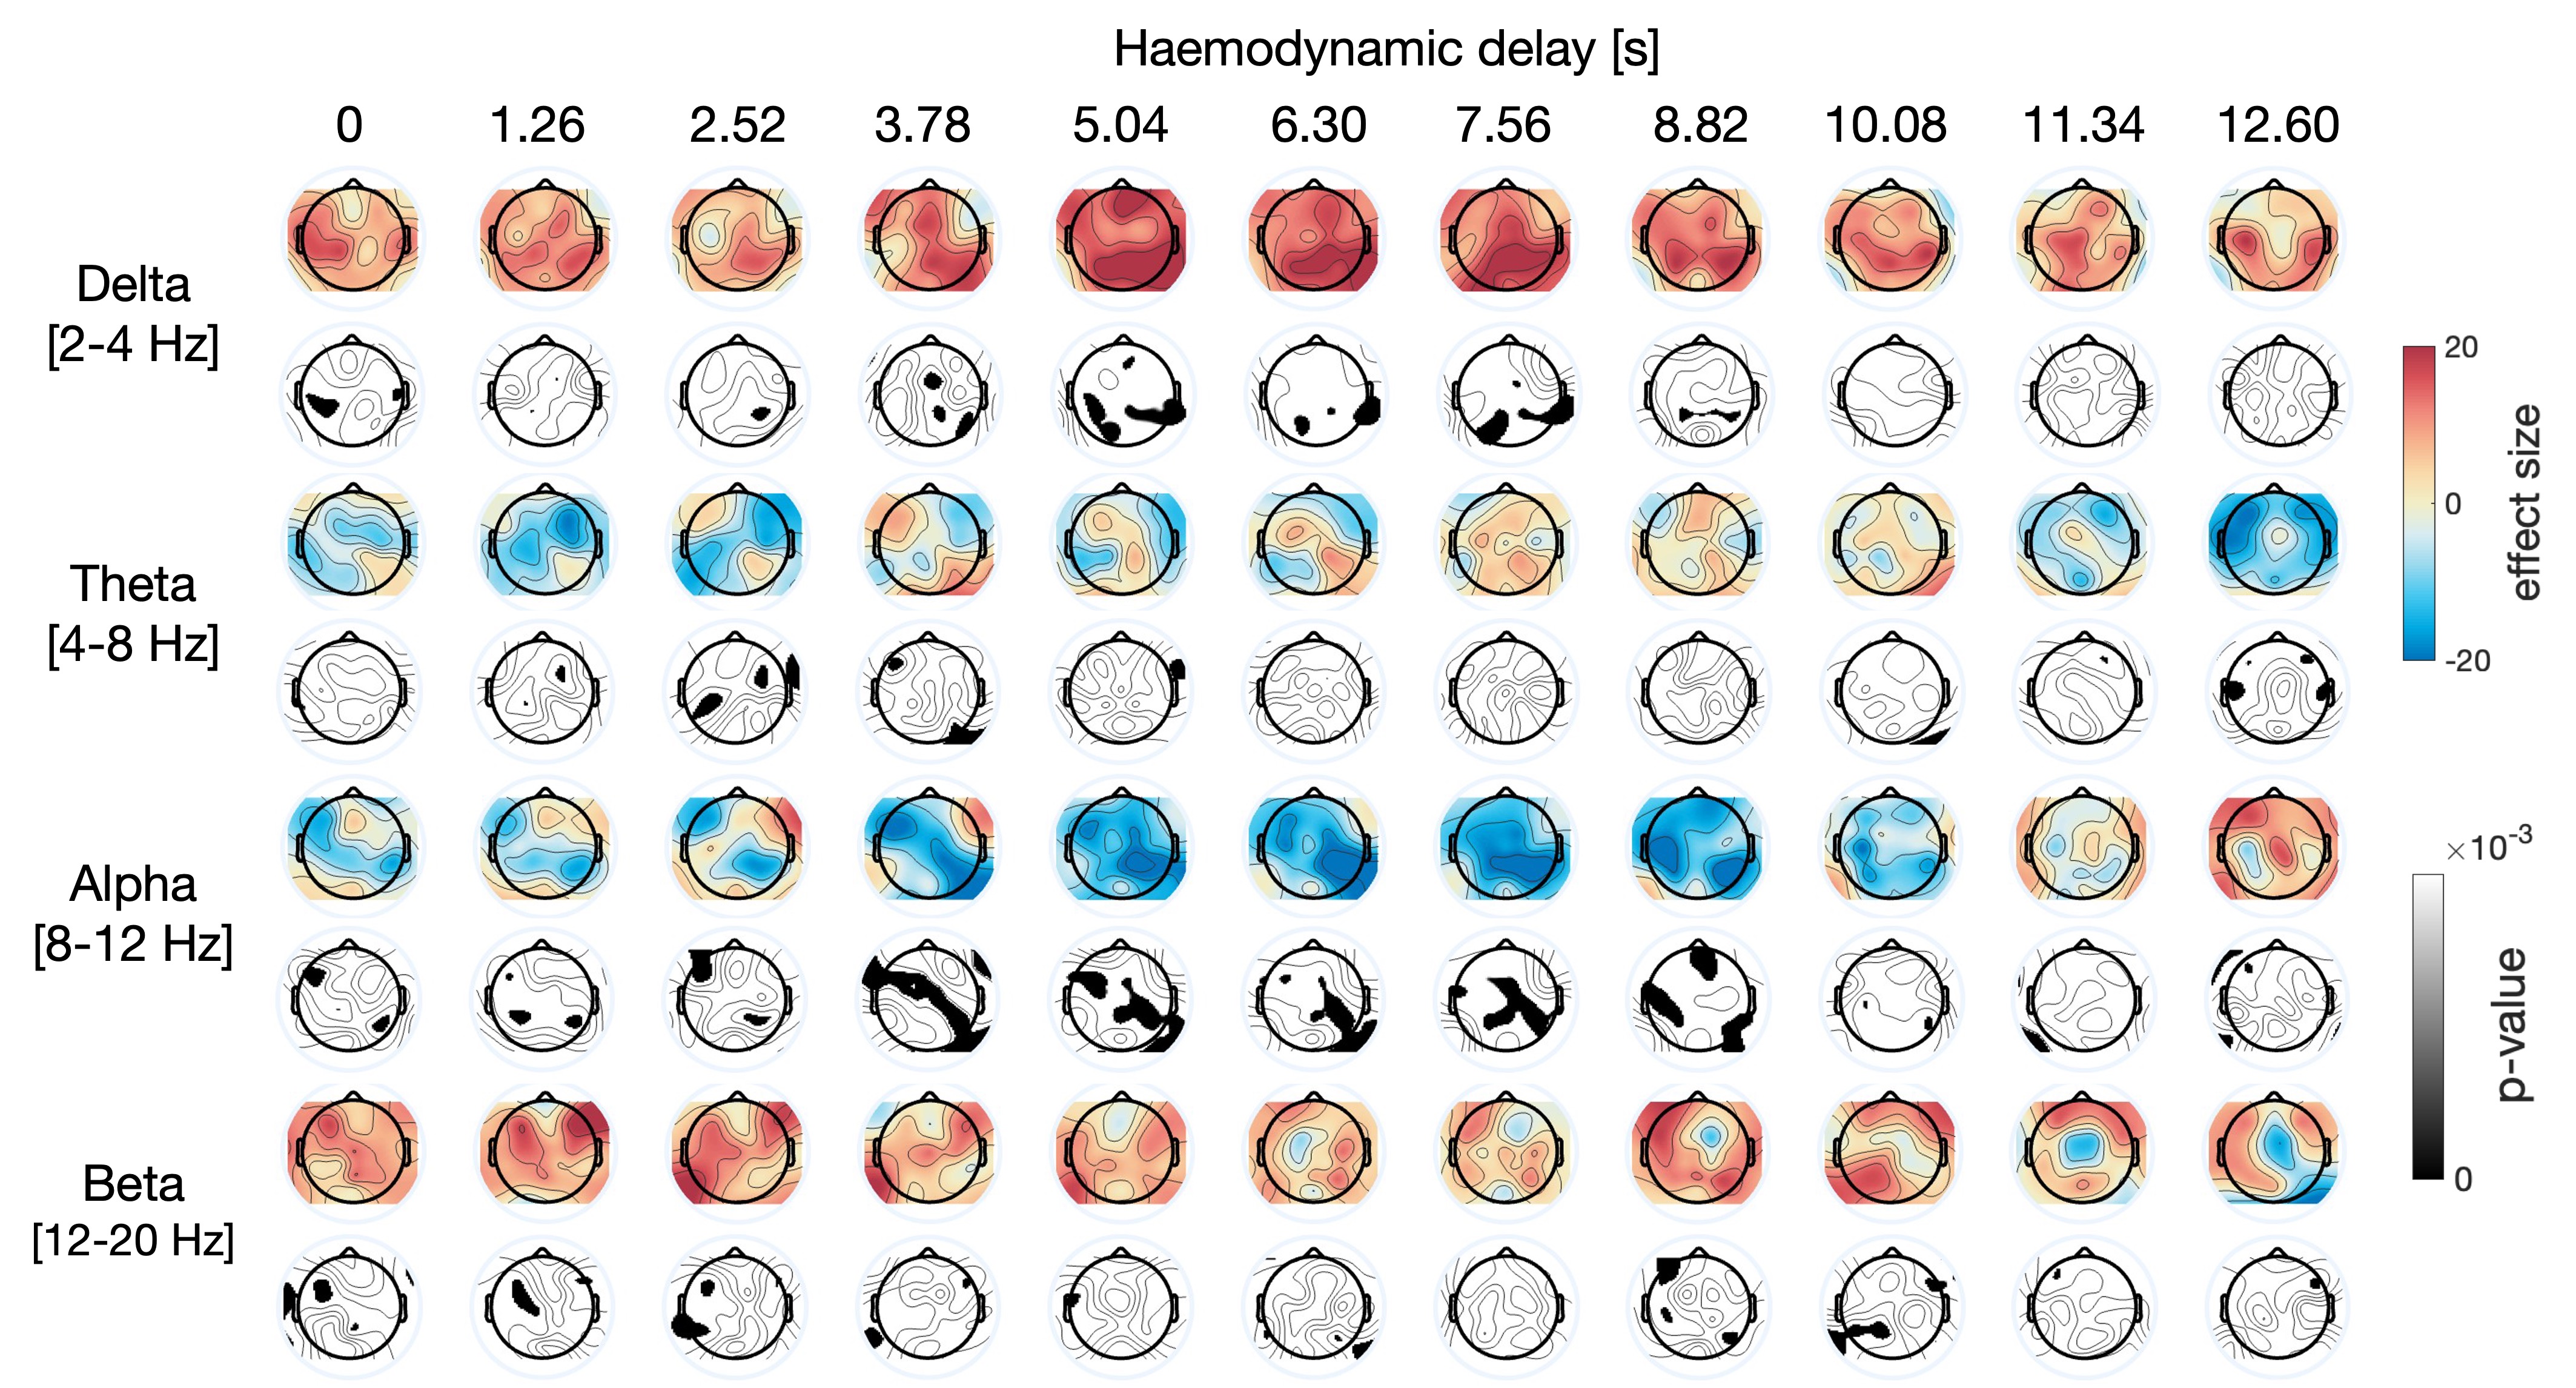
The identification of high/low cofluctuation time frames is described in Fig.1. On average, 13/11% of frames exhibited high/low RSS after exclusion of outliers (Fig.1-Left). Significantly more outliers overlapped with the low relative to high RSS frames, which should be further investigated in the future. The connectivity matrix computed by Pearson correlation across all time points was significantly more correlated with the one computed from high compared to low RSS points, in agreement with [6] (Fig.1-Right).The relationship between fMRI RSS and EEG relative bandpower is illustrated in Fig.2, over a representative time interval, for the delta and alpha frequency bands, in a specific EEG channel and for a specific haemodynamic delay. The correlation between high RSS and increased delta / decreased alpha power can be appreciated. This is also evident in the scatter plot of fMRI RSS vs. EEG relative bandpower across all time frames, and for all frequency bands, presented in Fig.3, for the same channel and delay, showing higher delta power and lower alpha power in high RSS points.
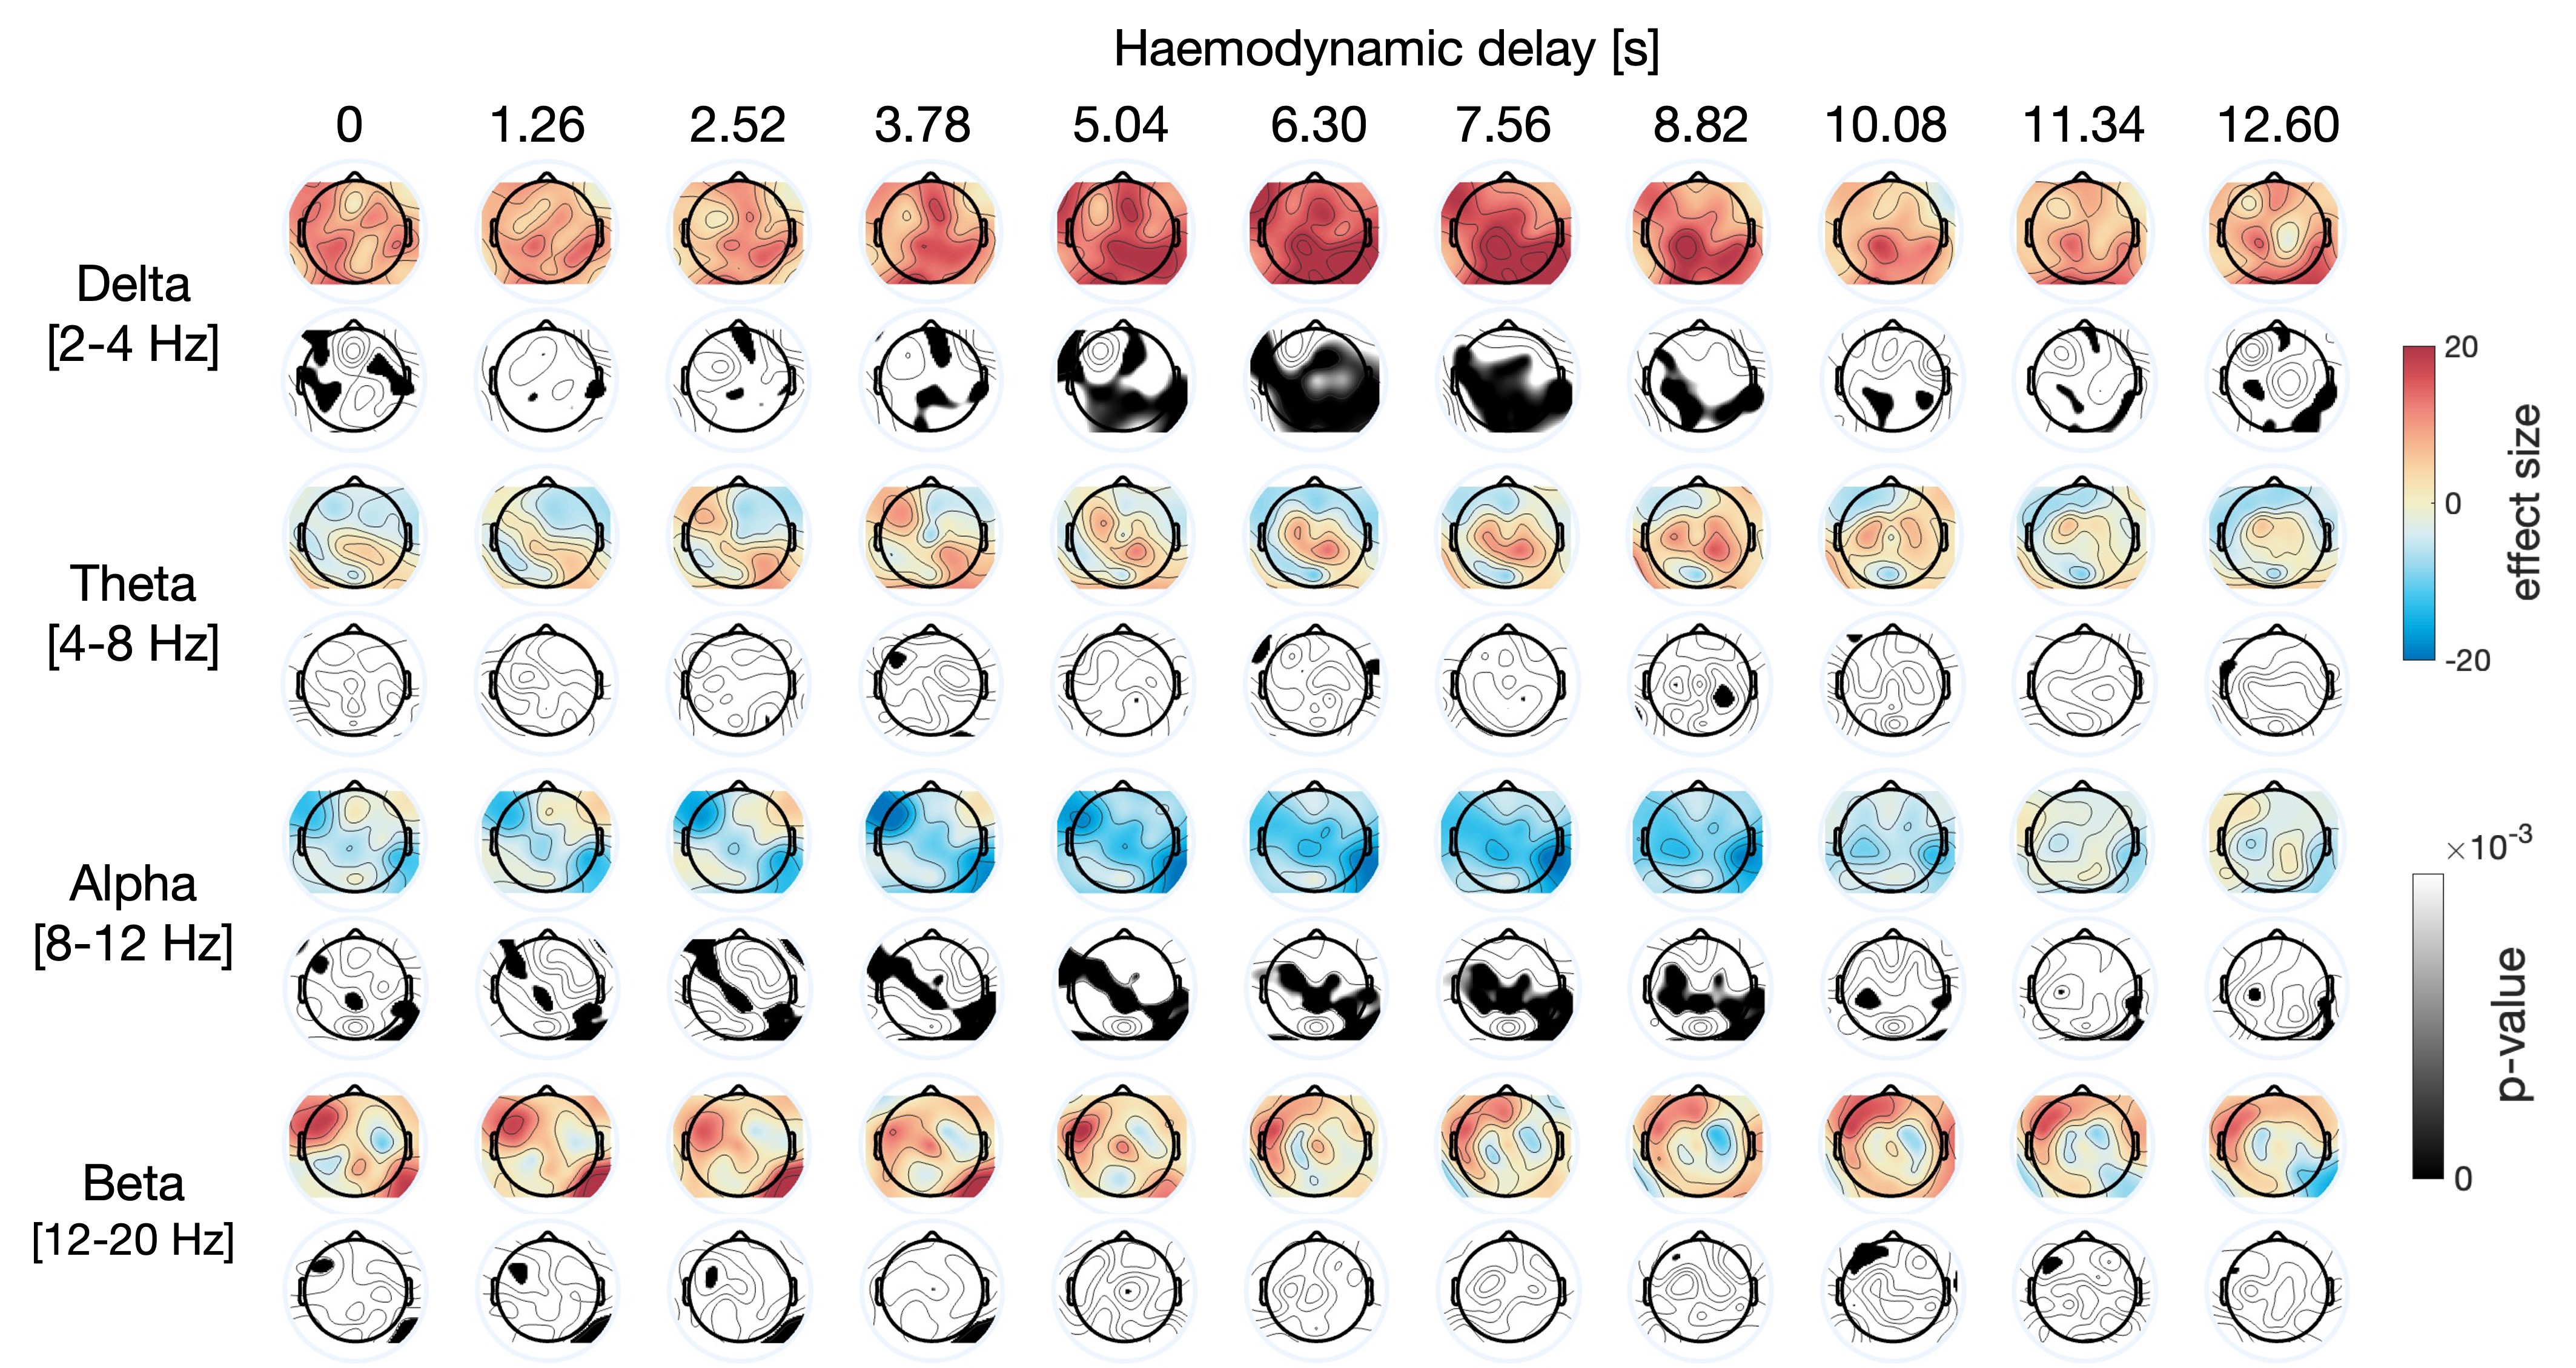
The results of the linear mixed effects modeling are presented in Fig.4. Significant correlations were found between fMRI RSS and EEG bandpower in several channels, mostly between 4 and 6s delays, consistently with the range of haemodynamic delays commonly observed in BOLD-fMRI. Specifically, RSS increased with delta power across posterior brain regions and decreased with alpha power mostly in central and parietal brain regions. These findings were consistent with the comparison of EEG bandpower exclusively between high and low RSS time frames, presented in Fig.5.
Discussion
We provide evidence of a relationship between the amplitude of BOLD cofluctuations across the brain and concurrent electrophysiology in humans. Specifically, we found that high amplitude cofluctuations were associated with higher delta power and lower alpha power. This association was specifically observed when considering delays ~6s between EEG and BOLD signals, supporting its neurovascular origin. Our results are consistent with previous findings of a negative correlation between dynamic FC and EEG alpha power [12], and suggest that BOLD events have a neurophysiological origin. Future work will aim to cluster the high-RSS events and examine their electrophysiological correlates.Acknowledgements
This research was funded by an EMBO Scientific Exchange Grant, the Portuguese Science Foundation through grants PTDC/EMD-EMD/29675/2017, LISBOA-01-0145-FEDER-029675 and UIDB/50009/2020, and the Spanish Ministry of Economy and Competitiveness (RYC-2017-415 21845), the Basque Government (BERC 2018-2021, PIB_2019_104), the Spanish Ministry of Science, Innovation and Universities (PID2019-105520GB-100).References
1.Petridou N, Gaudes CC, Dryden IL, Francis ST, Gowland PA: Periods of rest in fMRI contain individual spontaneous events which are related to slowly fluctuating spontaneous activity. Hum Brain Mapp 2013; 34:1319–29.
2.Liu X, Duyn JH: Time-varying functional network information extracted from brief instances of spontaneous brain activity. Proc Natl Acad Sci U S A 2013; 110:4392–4397.
3.Allan TW, Francis ST, Caballero-Gaudes C, et al.: Functional Connectivity in MRI Is Driven by Spontaneous BOLD Events. PLoS One 2015; 10:e0124577.
4.Tagliazucchi E, Siniatchkin M, Laufs H, Chialvo DR. The voxel-wise functional connectome can be efficiently derived from co-activations in a sparse spatio-temporal point-process. Frontiers in neuroscience. 2016 Aug 23;10:381.
5.Karahanoğlu FI, Van De Ville D: Transient brain activity disentangles fMRI resting-state dynamics in terms of spatially and temporally overlapping networks. Nat Commun 2015; 6:7751.
6.Esfahlani FZ, Jo Y, Faskowitz J, et al.: High-amplitude cofluctuations in cortical activity drive functional connectivity. Proc Natl Acad Sci U S A 2020; 117:28393–28401.
7.Keilholz S, Caballero-Gaudes C, Bandettini P, Deco G, Calhoun V. Time-resolved resting-state functional magnetic resonance imaging analysis: current status, challenges, and new directions. Brain connectivity. 2017 Oct 1;7(8):465-81.
8.Cutts S.A., Faskowitz J., Betzel RF, Sporns O: Uncovering individual differences in finescale dynamics of functional connectivity. Cerebral Cortex (2022).
9.Novelli L, Razi A. A mathematical perspective on edge-centric brain functional connectivity. Nature communications. 2022 May 16;13(1):1-3.
10.Ladwig Z, Seitzman BA, Dworetsky A, Yu Y, Adeyemo B, Smith DM, Petersen SE, Gratton C. BOLD cofluctuation ‘events’ are predicted from static functional connectivity. Neuroimage 2022; 260:119476.
11.Zhang X, Pan WJ, Keilholz SD. The relationship between BOLD and neural activity arises from temporally sparse events. Neuroimage. 2020 Feb 15;207:116390.
12.Tagliazucchi E, von Wegner F, Morzelewski A, Brodbeck V, Laufs H: Dynamic BOLD functional connectivity in humans and its electrophysiological correlates. Front Hum Neurosci 2012; 6:339.
Figures