1027
A Brain-Behavior Interaction Analysis for Dyadic Brain Responses during Eye Contact between Parents and Children1Zuckerman Mind Brain Behavior Institute, Columbia University, New York, NY, United States, 2Teacher's College, Columbia University, New York, NY, United States, 3Teacher's College, Columbia Unviersity, New York, NY, United States, 4Biomedical Engineering, Columbia University, New York, NY, United States, 5Psychology, Columbia University, New York, NY, United States
Synopsis
Keywords: Brain Connectivity, Neuroscience
By combining hyperscan fMRI (hfMRI) and the facial action coding system (FACS), we introduce a new brain-behavior interaction analysis that can identify the underlying brain networks for perception and expression for different emotions during eye contact. It consists of three steps. 1) The affective facial muscle movements are encoded by facial action units (FAU) using FACS. 2) The specific emotional FAUs subserve the regressors for the univariant analysis on hfMRI data. 3) The brains’ activation maps are transformed into brain networks by multivariant analysis. It provides an approach to quantify affective interaction and emotional states.Introduction
The emotional bond between parents and children can be manifest in their eye contact. To quantitatively model dyadic brain responses to such affective interactions is essential for better understanding parent-child social relations and emotional states. By combining hyperscan fMRI (hfMRI)1 and the facial action coding system (FACS)2, we introduce a new brain-behavior interaction analysis that can identify the underlying brain networks for perception and expression for different emotions during eye contact. It can potentially quantify both children’s attachments3 to their parents, parents’ external regulations to their children4, as well as other social behaviors.Methods and Materials
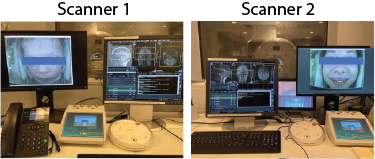
The proposed brain-behavior interaction analysis consists of three steps. 1) The affective facial muscle movements are encoded by facial action units (FAU) using FACS. 2) The specific emotional FAUs subserve the regressors for the univariant analysis on hfMRI data. 3) The brains’ activation maps are transformed into brain networks by multivariant analysis.The hfMRI with parent-child pairs was conducted in two Siemens Prisma 3T scanners, see Fig. 1. To make sure dyads can see the entire face of each other, the coil setup replaced the anterior part of the 32ch head array with the 4ch flex array placed above the forehead. The functional scans on both scanners were synchronized by a standalone PC via ethernet. The visual communication between parents and children in different scanners was carried out by two in-bore high-resolution video cameras (MRC Inc., Germany).
A total of 14 parent-child pairs (28 participants) completed the eye contact experiment (simultaneously opening and closing their eyes every 20s in total 400s). The fMRI protocol consists of one structural T1 MPRAGE, one multiband gradient-echo EPI (TE 30ms, TR 1s, voxel size 3x3x3mm3 MB factor 3, measurement 400), and one dual-echo field mapping. Face videos were recorded with ffmpeg and a Video Capture Card to capture feed from the MRC Camera with zero dropped frames.
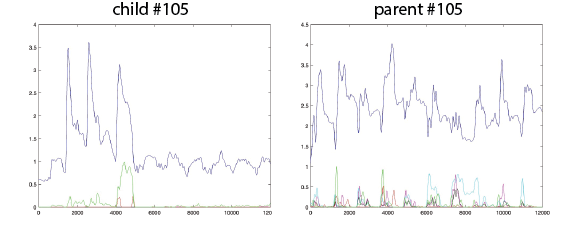
Step 1: All videos were analyzed with OpenFace 2.0 to capture FAU movements of the face muscles throughout the 400s collection period. This process resulted in 17 FAU dimensions with amplitude values between 0 (no movement) and 5 (maximally observed movement) from an individually scaled neutral baseline across 12,000 frames per participant (30 fps across 400s). Average success was .93, and average confidence was .89. Each dimension of the raw FAU data was then smoothed with a Nadaraya-Watson kernel estimator (bandwidth = 30) and then decimated to 400 samples to align with the fMRI data acquisition. The correlation between the smoothed decimated then interpolated data and the raw data was .82. The emotional time series of happy, sad, surprise, fear, anger, and disgust for each participant were generated based on FACS.
Step 2: For the hfMRI data, the univariant analysis was carried out by FSL/FEAT (Cambridge, UK). At the first-level analysis, the individual functional data were regressed by the event-related emotional time series and the block design of eye open and close. The activation map regressed by one’s own emotional time series formed expression map; the activation map regressed by other’s emotional time series became perception map.
Step 3: The brain networks of expression and perception were generated by multivariant analysis using an in-house developed program. It applies PCA on each activated parcellate, convert the fMRI time series of all voxels in the parcellate from brain space to eigen space, and compute mutual information (MI) between two parcellates. Thus, the brain network’s nodes are activated parcellates, edges are the MI between any of parcellate pairs.
Results
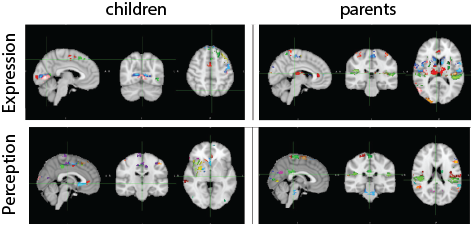
Each emotional time series is composed with a set of action units (AU). For happy, it is derived from AU6 and AU12; for sad, it is from AU1, AU4, and AU15, etc. The six emotional time series for parent and child are exemplified with the parent-child pair #105, Fig. 2.Since the main affective reaction during eye contact between parents and children is happy/joy, the group average of children’s and parents’ happy expression and perception maps are given in Fig. 3, here p-value<0.005 and z-score=1.6 (here threshold is lower for later multivariant analysis). The parcellations are based on Harvard-Oxford Cortices and Subcortices Atlas. Each parcellate is threshold by 50% probability.
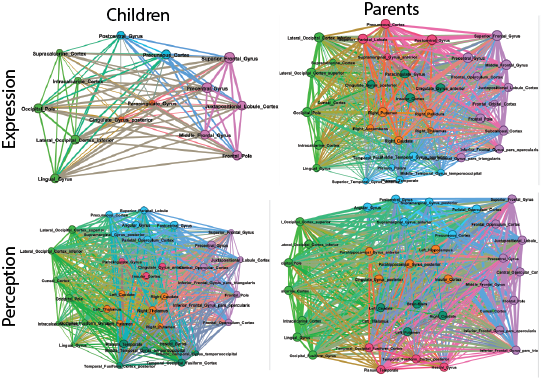
Children’s and parents’ brain networks for happy expression and perception are shown in Fig. 4. Here, the dimension reduction cut off the lower than 5% explained variance. The edges are selected based on p-value <0.05 in the G-test.
Discussions
Initial network analysis suggests that the expression networks are simpler than the perception networks; children’s brain networks are simpler than parents’. For example, the salience network (anterior cingulate cortex – Insular) is not manifest in children’s expression network, which is consistent with literature. The eigen centrality of children’s networks is the highest at superior frontal gyrus, whereas parents’ is at the precentral and postcentral gyri.Conclusions
The brain-behavior interaction analysis provides an approach to quantify affective interaction and emotional states. It potentially can transform the evidence-based parent-child interaction study into a model-based analysis, which may have a significant impact on human social life, as well as improving parent-child interaction therapy for psychiatric diseases.Acknowledgements
The authors would like to thank for the grant support from NSF 1926789References
1 Koike, T., Sumiya, M., Nakagawa, E., Okazaki, S. & Sadato, N. What Makes Eye Contact Special? Neural Substrates of On-Line Mutual Eye-Gaze: A Hyperscanning fMRI Study. eNeuro 6, doi:10.1523/ENEURO.0284-18.2019 (2019).
2 Baltrusaitis, T., Zadeh, A., Lim, Y. C., & Morency, L. P. Openface 2.0: Facial behavior analysis toolkit. In 2018 13th IEEE international conference on automatic face & gesture recognition (FG 2018) (pp. 59-66). (2018).
3 Ulmer-Yaniv, A., Waidergoren, S., Shaked, A., Salomon, R., & Feldman, R. Neural representation of the parent-child attachment from infancy to adulthood. Social Cognitive and Afective Neuroscience, vol 17, iss 7, p. 609 (2022)
4 Silvers, J., Callaghan, B., VanTieghem, M., Choy, T., O'Sullivan, K., & Tottenham, N. An exploration of amygdala-prefrontal mechanisms in the intergenerational transmission of learned fear. Develomental Science, 2021;24:e13056. https://doi.org/10.1111/desc.13056 (2021)
Figures