1026
The cerebellum modulates non-linear behavior of motor planning areas in variable grip-force visuomotor task1Department of Brain and Behavioral sciences, Università di Pavia, Pavia, Italy, 2Department of Diagnostic Radiology, College of Applied medical sciences, King Abdulaziz University, Jeddah, Saudi Arabia, 3Department of Mental Health and Dependence, ASST, Pavia, Italy, 4Brain Connectivity Center, IRCCS Mondino Foundation, Pavia, Italy, 5Department of Neuroinflammation, UCL Queen Square Institute of Neurology, NMR Research Unit, Queen Square Multiple Sclerosis Centre, London, United Kingdom
Synopsis
Keywords: Brain Connectivity, fMRI (task based), Cerebellum
The hemodynamic response to neuronal stimuli can be both linear and nonlinear with the applied grip-force of a “squeeze-ball” task, controlled by a visual cue. Dynamic Causal Modelling was applied here to understand the causal effective between-region connectivity shaping the hemodynamic response recorded by functional-MRI. Effective connectivity resulted non-symmetric, with strong excitation from visual to motor areas. Results indicated primary visual cortex linear modulation of the cerebellar response, which exerted nonlinear influence on cortical motor planning, suggesting activation hierarchy in the motor circuit with prominent cerebellar role. This result may have important implications for understanding pathological changes affecting neural mechanisms.Introduction
Task-based functional MRI (fMRI) studies based on a “squeeze-ball” task controlled by a visual cue have highlighted the influence of different levels of applied grip-force (GF) in modulating the Blood Oxygen Level Dependent (BOLD) signal. Polynomial expansion of BOLD-GF signals has been used to fit the hemodynamic response (non)linearity and define the subtending visuomotor network1,2.What is still unknown is the causal relation driving these responses between regions. Dynamic Causal Modelling (DCM) is a framework widely used to establish causal relationships between temporal events by estimating the direct influences (i.e., effective connectivity) between interconnected regions3,4.
We applied DCM to investigate the direct causal influences amongst the regions embedded in the cerebro-cerebellar network activated during a previously published visuomotor task. The selected regions were related to the applied task and included the bilateral Primary Visual Cortex (V1), left Primary Motor Cortex (M1), left Supplementary Motor Area and left Premotor Cortex (SMA-PMC), left Cingulate Cortex (CC), left Superior Parietal Lobule (SPL), and right Cerebellum (CRBL).
For the first time, visuomotor effective connectivity and GF linear and nonlinear modulations in visuo-to-plan pathways (V1 - CRBL - SMA-PMC) were quantified, providing an insight on the causal influences at the origin of nonlinear responses recorded in the investigated network.
Methods
Subjects and MRI acquisition: 21 right-handed healthy volunteers were analyzed (22±4years, 9males). A 3DT1 MPRAGE volume (TR/TE/TI=6.9/3.1/824ms, flip angle=8°, 1x1x1mm3) and three T2*-weighted GE-EPI fMRI series (TR/TE=2500/35ms, flip angle=90°, 3x3x3mm3 200 volumes) were acquired on a 3T Philips Achieva scanner1,2.fMRI paradigm: An event-related visuomotor paradigm was implemented using 75 active trials equally divided among 5 different GFs (20%,30%,40%,50%,60%) of each subject's maximum voluntary contraction)1,2.
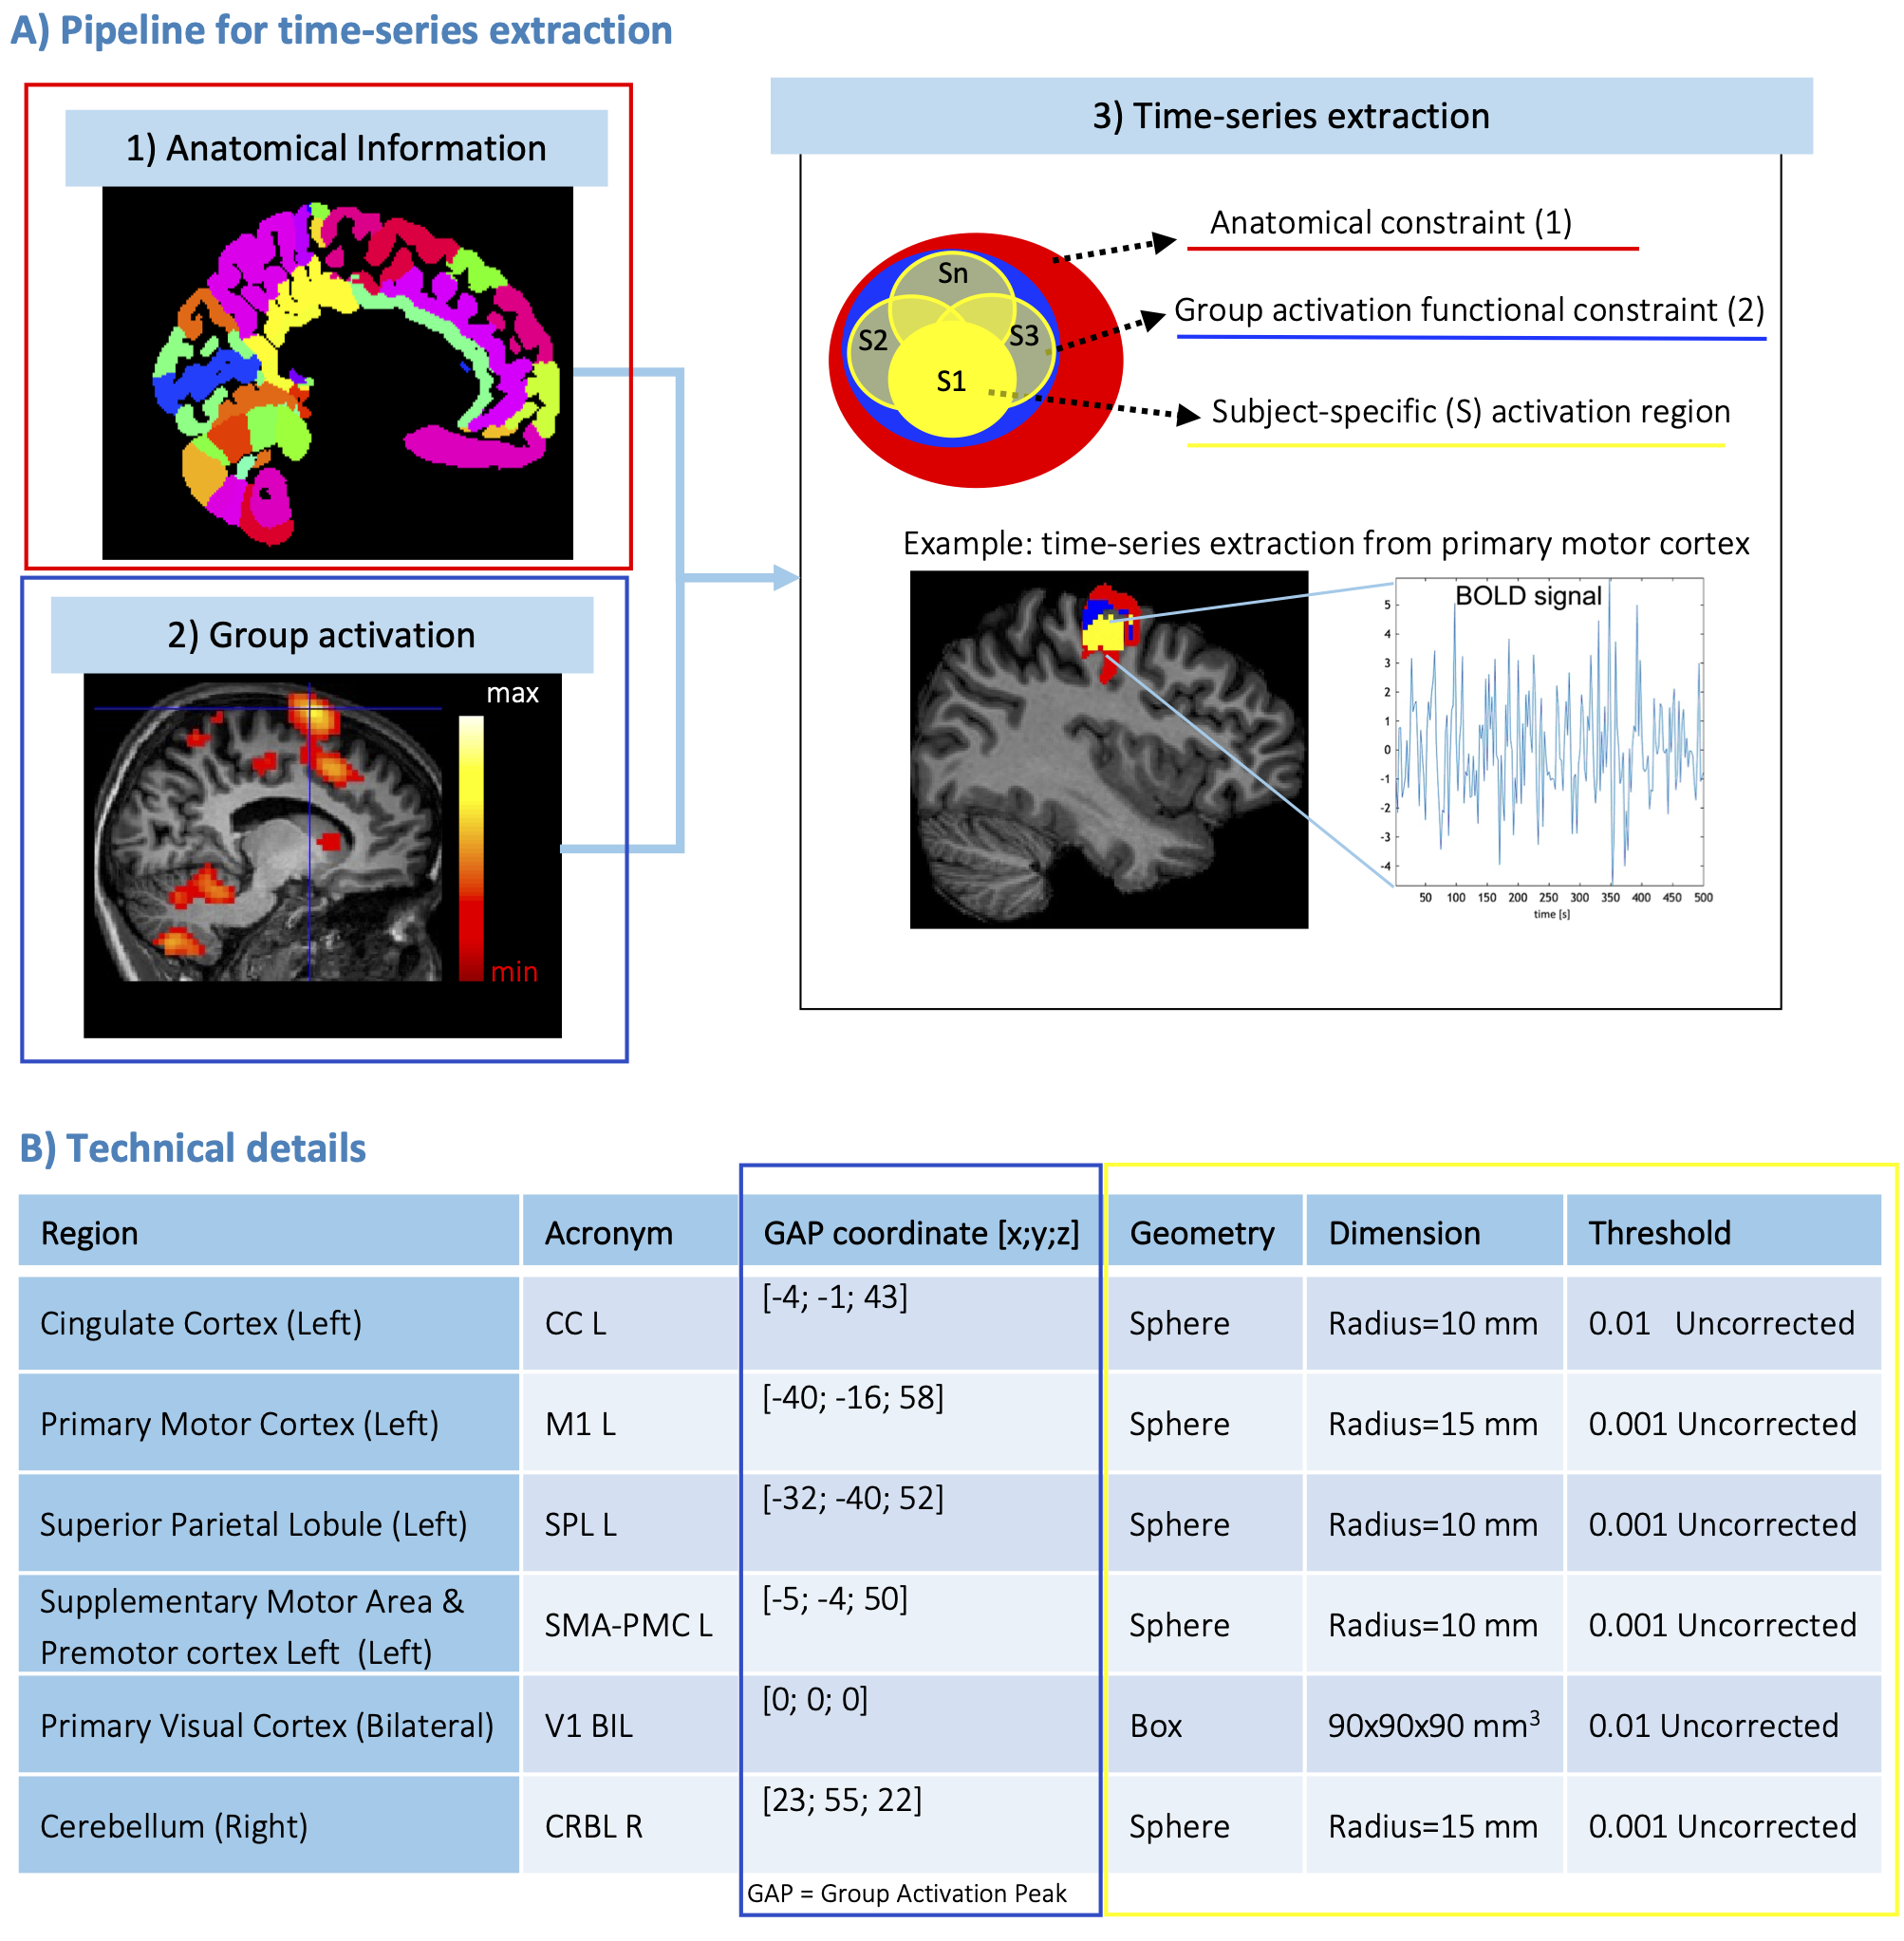
Regions-specific time-series extraction: fMRI images were pre-processed (SPM12). For each subject, a geometrical mask was defined for brain regions embedded in the network by using anatomical (i) and functional (ii) constraints (Figure1A). (i) Anatomical parcellation was computed by merging Brodmann5 and SUIT6 atlases. (ii) Second-level analysis was performed to compute the group activation peak. Then, time-series were extracted from a subject-specific geometrical mask including significantly-activated voxels restricted to anatomical and functional constraints (Figure1B).
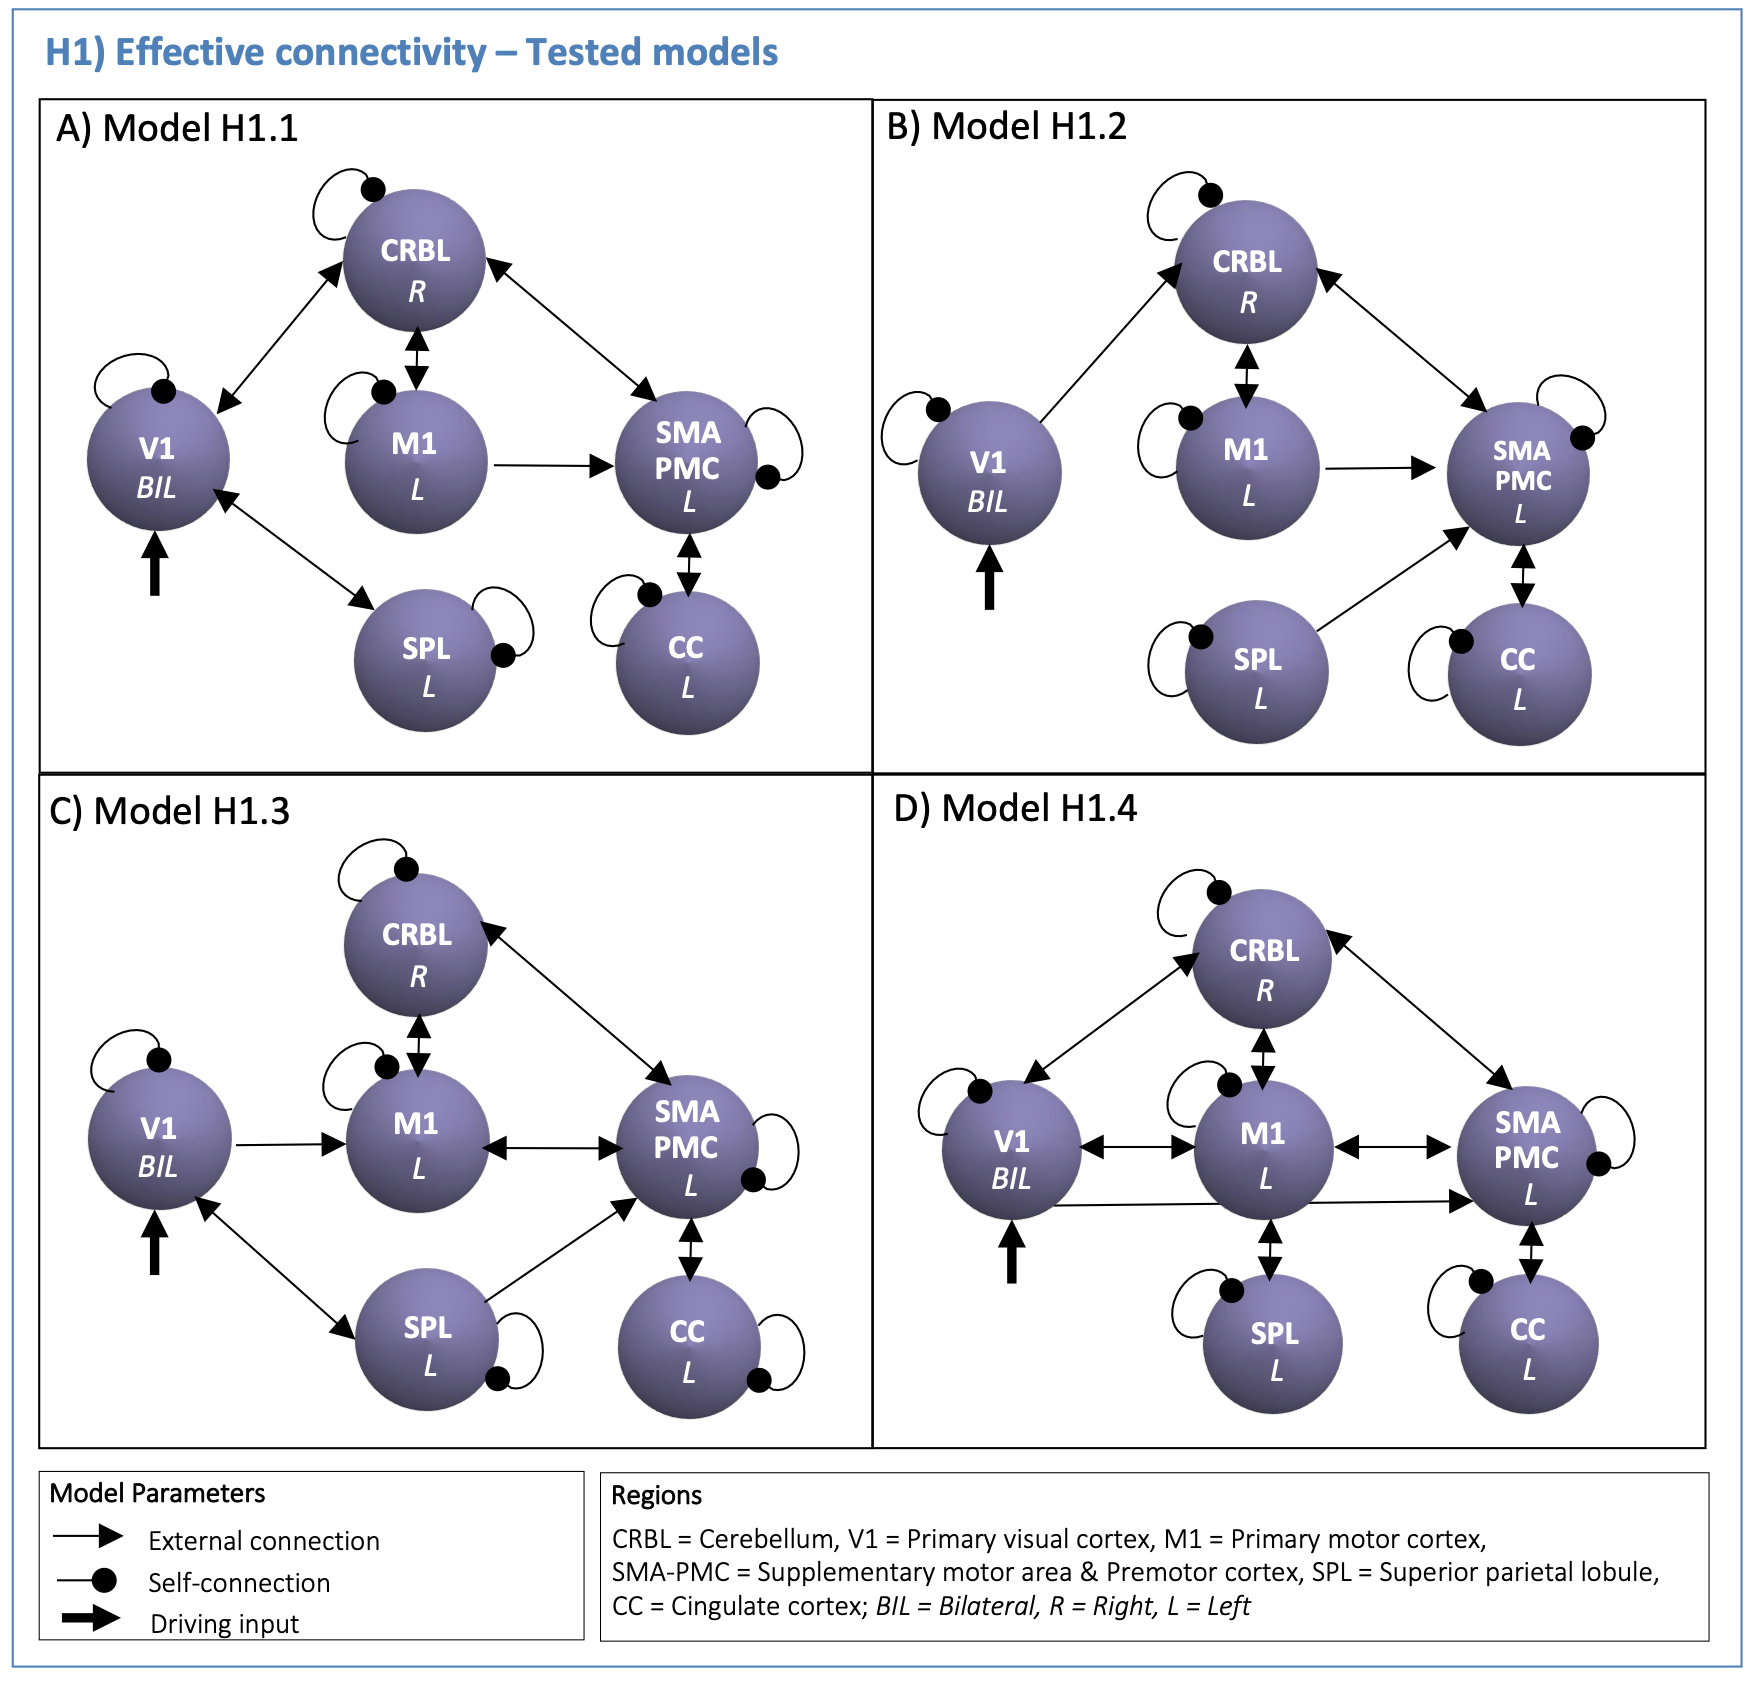
DCM Analysis: DCM models were defined to test the visuomotor network effective connectivity (H1, Figure2) and GF modulatory effects in the visuo-to-plan pathway (H2, Figure3).
(H1): According to the task nature, V1 was defined as the driving region. Based on prior knowledge7–12, four hypotheses on the inward and outward connections were defined to quantify the effective connectivity (H1-models in Figure2). First-level analysis estimated all H1-models with Bayesian model inversion, quantifying the effective connectivity strength [Hz] of each pair of regions. Second-level bayesian model selection with Fixed Effects (BMS-FFX)13 estimated the posterior probabilities resulting from first-level analysis to identify the H1-winning-model, i.e. the model maximizing the likelihood with experimental fMRI time-series.
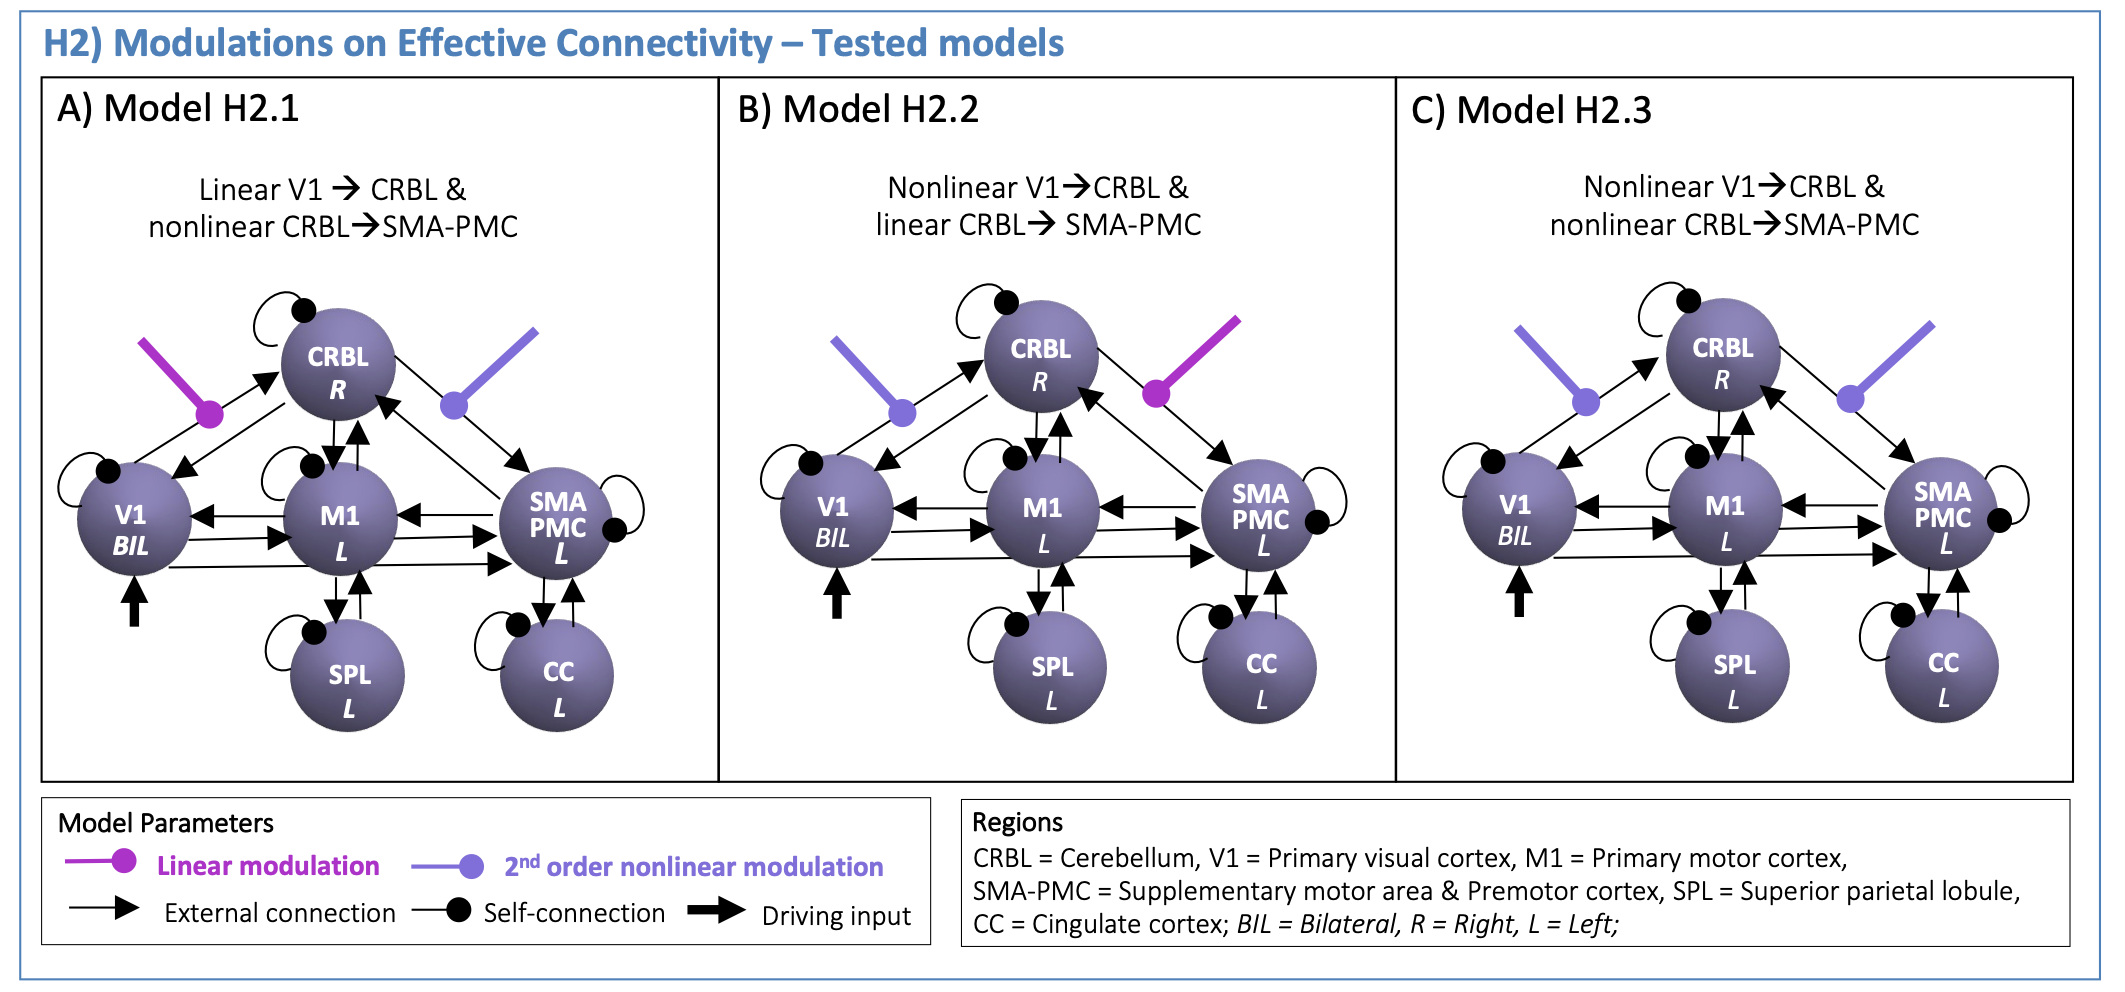
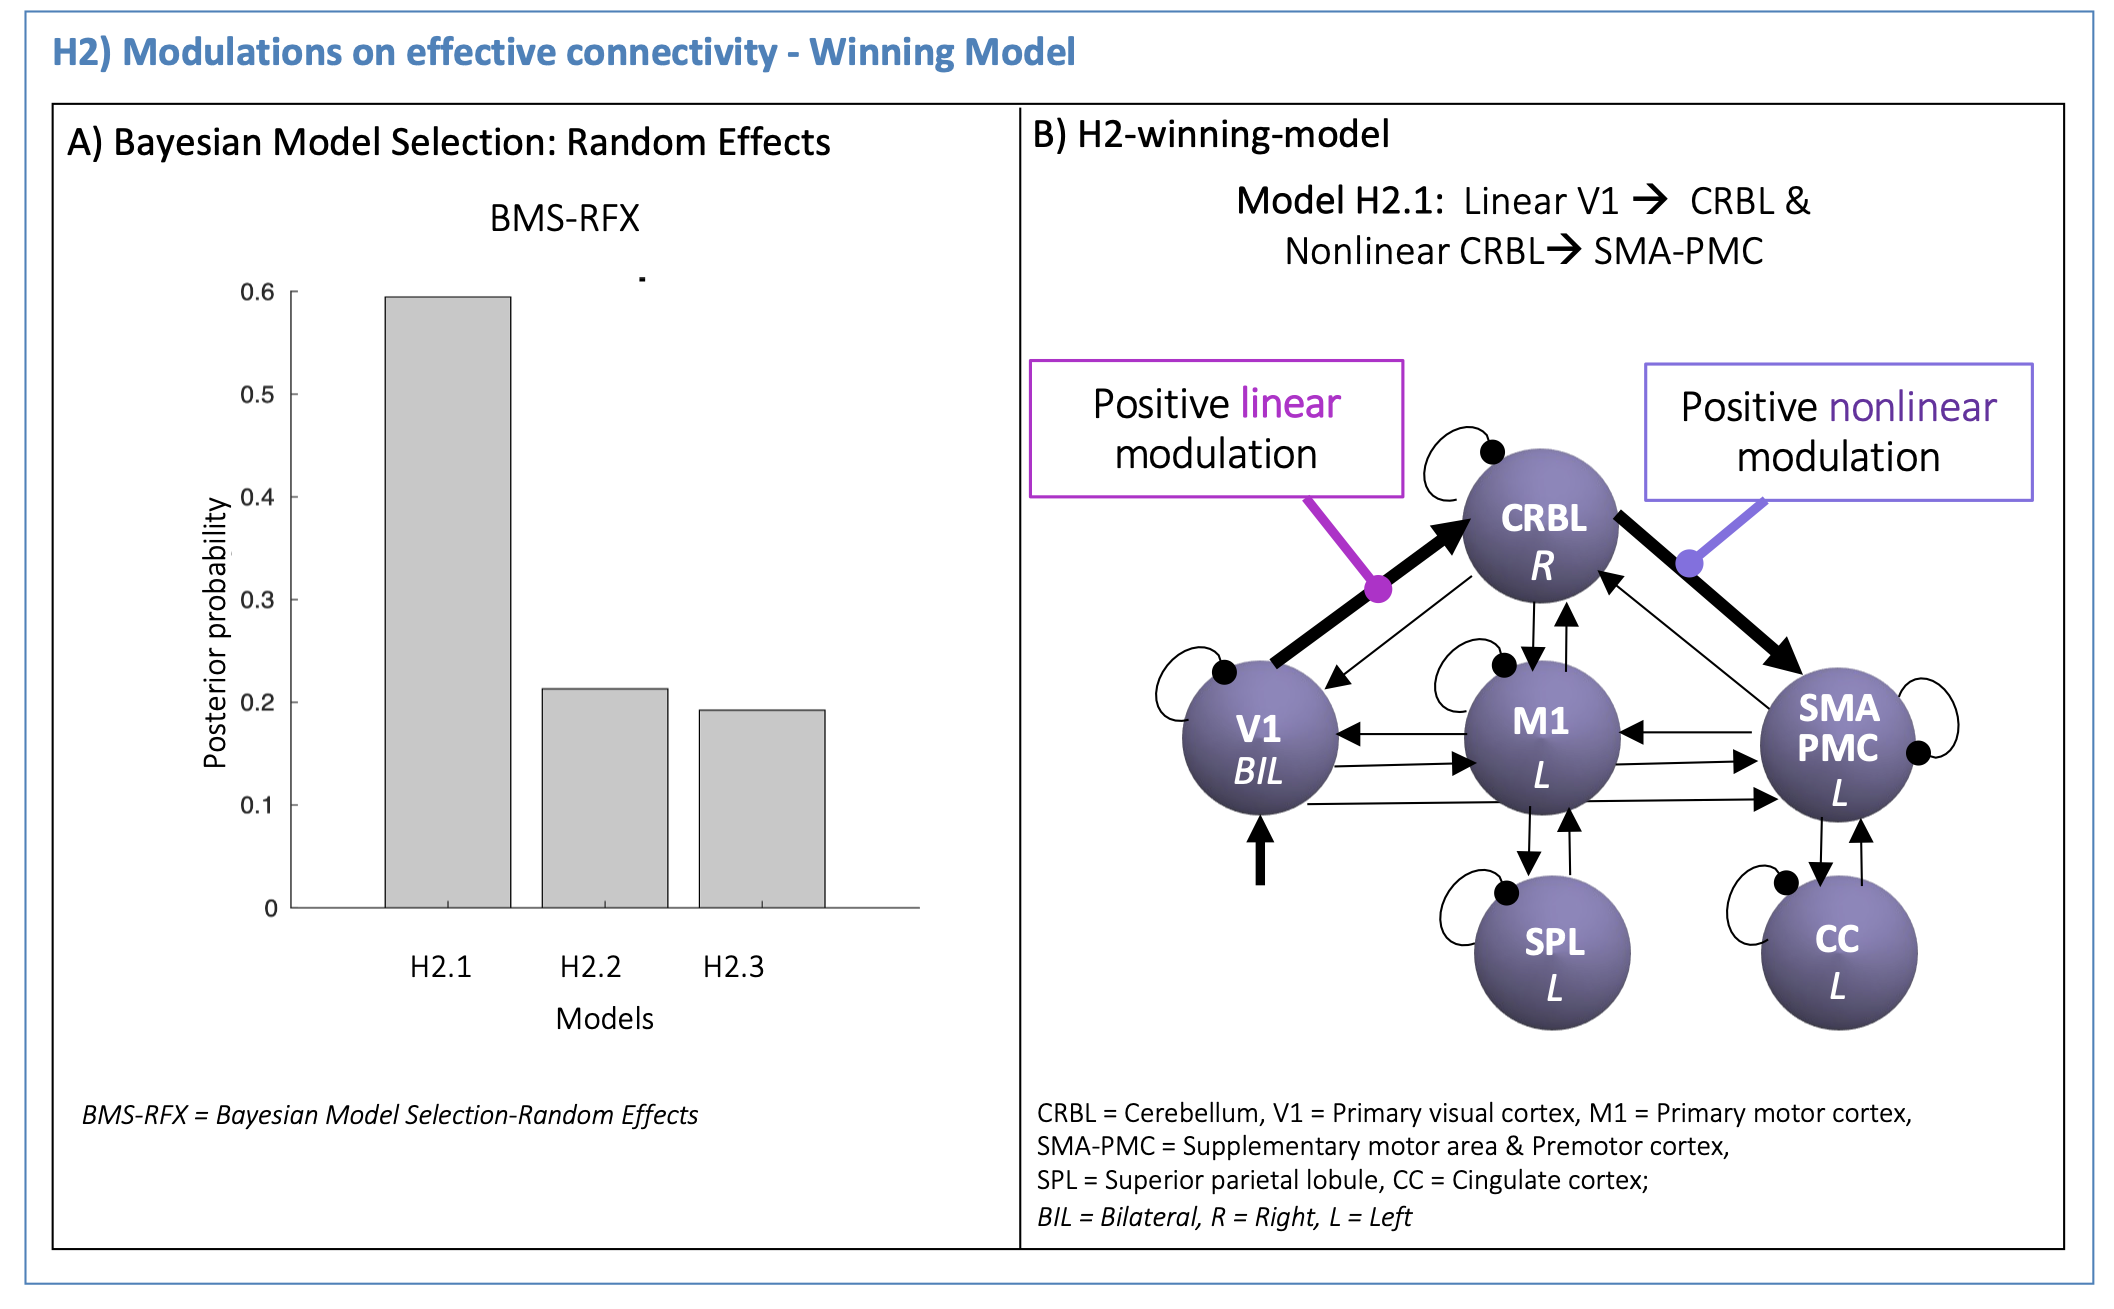
(H2): The H1-winning-model was used to set the effective connectivity. First and second order polynomial expansions of the BOLD-GF relationship were tested as modulatory effects on V1 - CRBL - SMA-PMC path. Different configurations were specified (H2-models in Figure3) to investigate how visual input drives the CRBL response (from V1 to CRBL) and how this affects the cerebellar-cortical motor planning initiation (from CRBL to SMA-PMC). A second-level Bayesian model selection was performed to determine the H2-winning-model, with random effects (BMS-RFX)13 integrating the inter subject variability in the shape of region-specific BOLD responses.
Results
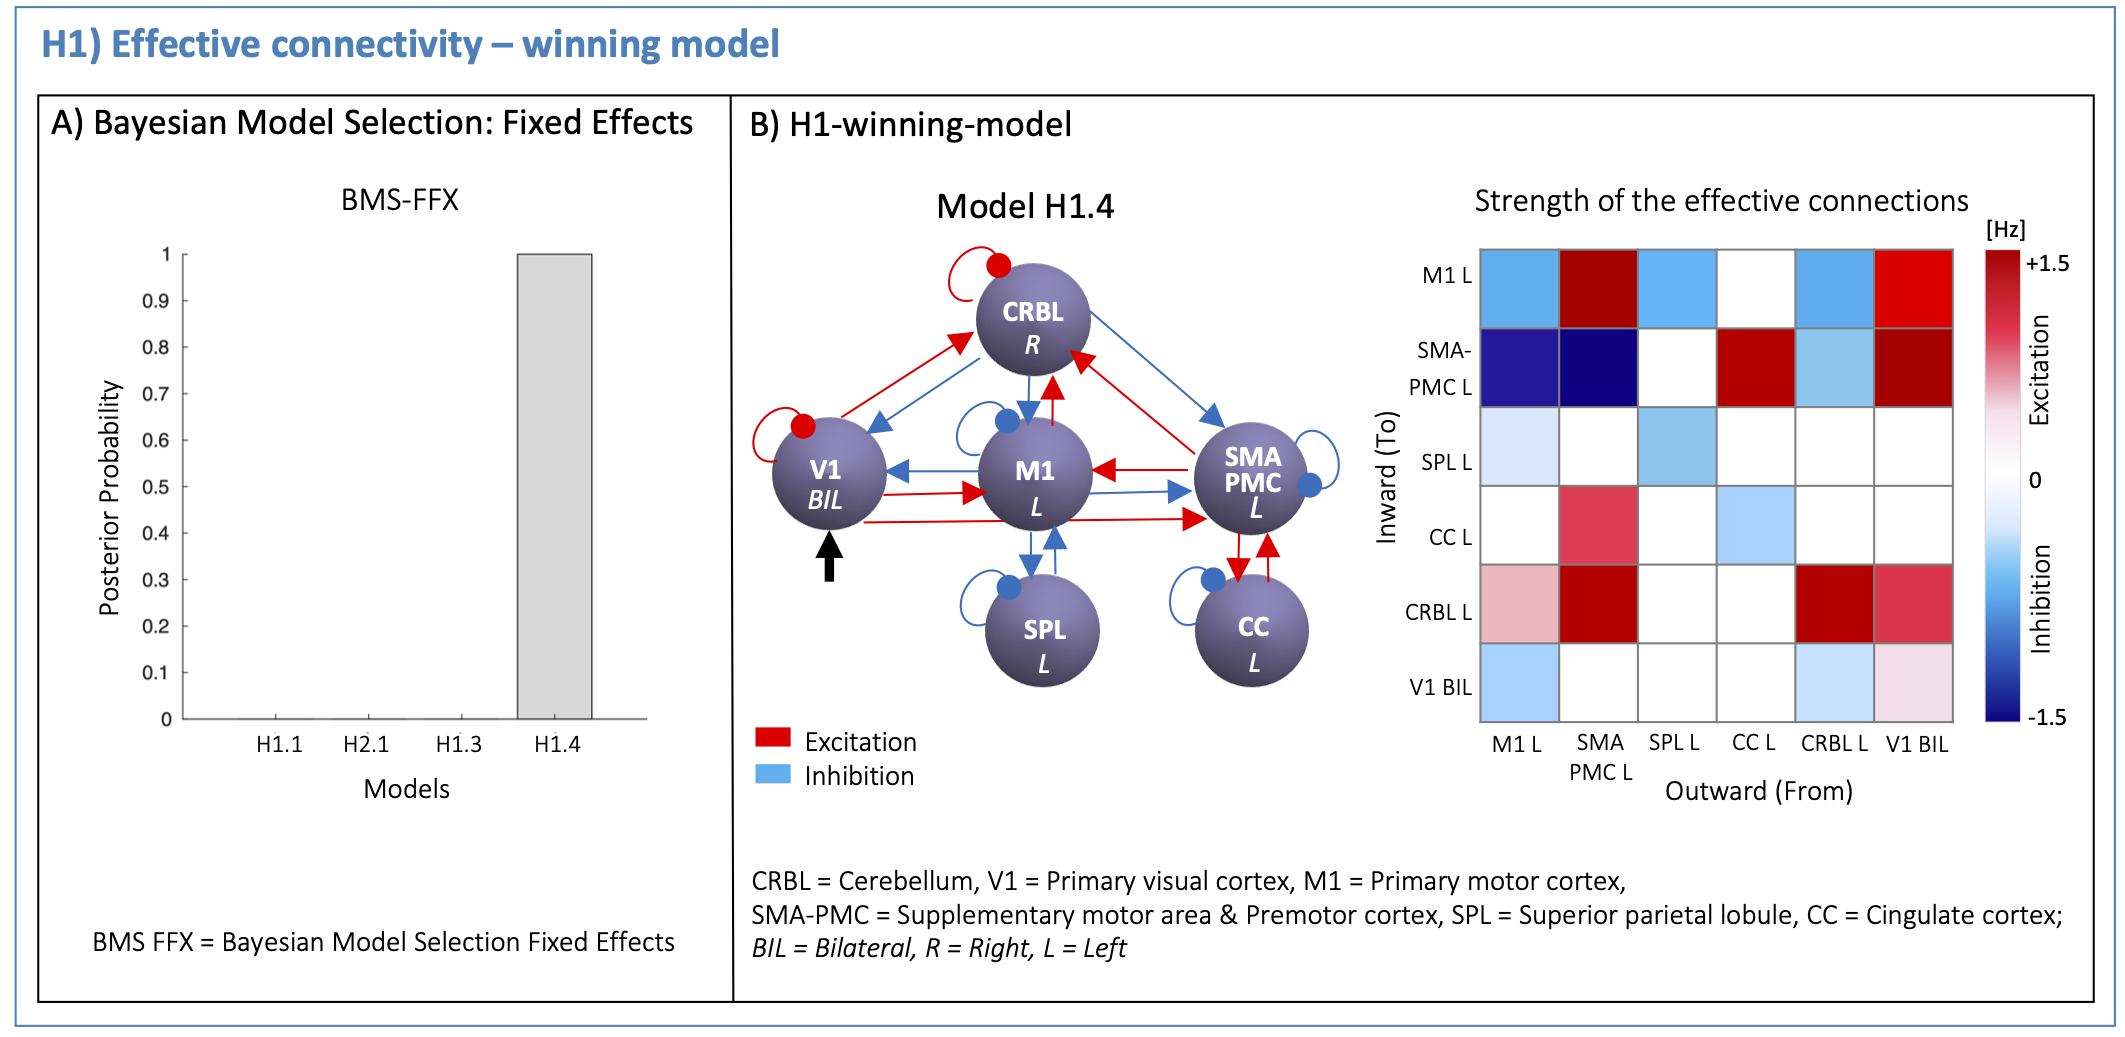
The H1-winning-model (posterior probability>90%, Figure4A) showed highly non-symmetric excitatory(red) and inhibitory(blue) influences as positive and negative effective connectivity, respectively. The V1 driving activity highly excited CRBL, SMA-PMC and M1, remarkably influencing motor planning and execution (Figure4B). The H2-winning-model (Figure5A) revealed linear positive V1 modulation to CRBL, which in turns, originated nonlinearities in SMA-PMC activity (Figure5B).Discussion and Conclusion
For the first time, DCM was used to understand the causal relations at the basis of different hemodynamic responses to a visuomotor task.The effective connectivity matrix was highly non-symmetric both in terms of inward/outward connections and their excitatory/inhibitory nature, supporting the evidence of a visuomotor network hierarchical activation. Effective connectivity resulted in a feedback/feedforward cerebro-cerebellar loop, confirming the mutual influences of cerebro-cerebellar activations. V1 influenced motor planning areas (CRBL and SMA-PMC) with similar strength to that of M1 on CRBL. Interestingly, this result is consistent with the fact that the task used a visual stimulus for starting the motor plan, and also to give feedback on its execution; in this context, the CRBL may have been the key integrator of motor prediction with error detection in plan execution.
Analysis of GF modulation on the BOLD signal of the visuo-to-plan pathway disentangled the GF shaping of BOLD in driving path (from V1 to CRBL) and motor planning initiation (from CRBL to SMA-PMC). CRBL modulated the complex activation in SMA-PMC, suggesting a hierarchical organization of motor planning activity with the cerebellum driving cortical motor planning.
Here we focused on the visuo-to-plan path of the H1-winning-model to understand signal propagation from visual input to motor planning. Further analyses should add other paths of the model, such as V1 to SMA-PMC, to compare visuo-cerebellar with visuo-cortical driving paths. Moreover it will be interesting to include the highly-nonlinear behavior of CC and SPL, which might provide an insight on the causal influences driving action selection and visual attention, respectively8,9.
Acknowledgements
ED and FP receive funding from H2020 Research and Innovation Action Grants Human Brain Project (#785907, SGA2 and #945539, SGA3). ED receives funding from the MNL Project “Local Neuronal Microcircuits” of the Centro Fermi (Rome, Italy). CGWK receives funding from Horizon2020 (#945539), BRC (#BRC704/CAP/CGW), MRC (#MR/S026088/1), Ataxia UK, MS Society (#77), Wings for Life (#169111). CGWK is a shareholder in Queen Square Analytics Ltd.References
[1] Alahmadi AAS, Samson RS, Gasston D, et al. Complex motor task associated with non-linear BOLD responses in cerebro-cortical areas and cerebellum. Brain Struct. Funct. 2016;221(5):2443–2458.
[2] Casiraghi L, Alahmadi AAS, Monteverdi A, et al. I See Your Effort: Force-Related BOLD Effects in an Extended Action Execution–Observation Network Involving the Cerebellum. Cereb. Cortex 2019;29(3):1351–1368.
[3] Friston KJ, Harrison L, Penny W. Dynamic causal modelling. Neuroimage 2003;19(4):1273–1302
[4] Friston KJ, Preller KH, Mathys C, et al. Dynamic causal modelling revisited. Neuroimage 2019;199(February 2017):730–744.
[5] Mai J, Majtanik M. Human Brain in Standard MNI Space. 1st Editio. Elsevier; 2017.
[6] Diedrichsen J. A spatially unbiased atlas template of the human cerebellum. Neuroimage 2006;33(1):127–138.
[7] Asemi A, Ramaseshan K, Burgess A, et al. Dorsal anterior cingulate cortex modulates supplementary motor area in coordinated unimanual motor behavior. Front. Hum. Neurosci. 2015;9:309.
[8] Grefkes C, Eickhoff SB, Nowak DA, et al. Dynamic intra- and interhemispheric interactions during unilateral and bilateral hand movements assessed with fMRI and DCM. Neuroimage 2008;41(4):1382–1394.
[9] Keisker B, Hepp-Reymond MC, Blickenstorfer A, et al. Differential force scaling of fine-graded power grip force in the sensorimotor network. Hum. Brain Mapp. 2009;30(8):2453–2465.
[10] Macar F, Coull J, Vidal F. The supplementary motor area in motor and perceptual time processing: fMRI studies. Cogn. Process. 2006;7(2):89–94.
[11] Buckner RL, Krienen FM, Castellanos A, et al. The organization of the human cerebellum estimated by intrinsic functional connectivity. J. Neurophysiol. 2011;106(5):2322–2345.
[12] Yu C, Liu Y, Li J, et al. Altered functional connectivity of primary visual cortex in early blindness. Hum. Brain Mapp. 2008;29(5):533–543.
[13] Penny WD, Stephan KE, Daunizeau J, et al. Comparing families of dynamic causal models. PLoS Comput. Biol. 2010;6(3)
Figures