1024
A Multi-Subject Deconvolution Algorithm for the Analysis of Naturalistic fMRI data
Eneko Uruñuela1, Clara Sava-Segal2, Megan Leung2, Emily S Finn2, and César Caballero-Gaudes1
1Basque Center on Cognition, Brain and Language, Donostia - San Sebastián, Spain, 2Department of Psychological and Brain Sciences, Dartmouth College, Hanover, NH, United States
1Basque Center on Cognition, Brain and Language, Donostia - San Sebastián, Spain, 2Department of Psychological and Brain Sciences, Dartmouth College, Hanover, NH, United States
Synopsis
Keywords: Brain Connectivity, fMRI, naturalistic paradigms
Collecting fMRI data during naturalistic paradigms has drawn considerable attention in human neuroscience as a way to investigate brain function in ecologically valid conditions. We introduce a novel method (multi-subject paradigm free mapping) to decipher BOLD events in a temporally agnostic manner, and explore concordant group activations and individual idiosyncrasies. Besides, it can operate at the fastest temporal and spatial resolutions of the data. We validate it on simulated and real naturalistic fMRI data, revealing events that track expected features of the stimulus. Overall, this technique substantially increases sensitivity in linking moment-to-moment brain activity to its underlying cause(s).Introduction
The number of studies collecting functional MRI data during naturalistic paradigms (e.g., movie-watching, narrative listening) to investigate brain function has increased considerably in recent years1. Naturalistic fMRI data is typically analyzed by inferring common responses across subjects (e.g., via intersubject correlation2) or by detecting changes in the amplitude and connectivity patterns (e.g., via point-change methods3, Hidden Markov Models4, or sliding window correlation5) and associating them to the paradigm events. Here, we introduce a novel method for naturalistic fMRI data analysis called multi-subject paradigm free mapping (msPFM) that overcomes limitations (e.g., low temporal and spatial resolution) of these previous approaches. msPFM blindly estimates shared and individualized neuronal-related activity without using the paradigm’s temporal information by solving a multi-variate regularized least-squares problem for hemodynamic deconvolution6 of the fMRI signal across multiple subjects. Unlike previous methods, this formulation allows the algorithm to operate at the fastest temporal resolution (TR), and the highest spatial resolution (voxel). As a proof of concept, we validate automatically detected events against known features of the stimulus (movie) to show that the algorithm recovers meaningful and interpretable causes of brain activity.Theory
We hereby describe the msPFM algorithm for multi-echo fMRI data, but note that it can be adapted for single-echo data. Let us define $$$\mathbf{Y}_{v,k} \in R^{T \times S}$$$ as the column-wise concatenation of the subject’s fMRI timecourses ($$$s=1,...,S$$$) for voxel (or region) $$$v$$$ acquired at echo time ($$$TE_k$$$), where $$$T$$$ is the number of timepoints (TRs) and $$$K$$$ is the number of TEs. Assuming that functional images of all subjects are aligned to the same space, and data is normalized to signal percentage change, the subjects’ $$$\mathbf{Y}_{v,k}$$$ matrices can be concatenated in rows and modelled in terms of the echo-time dependence of the BOLD response:7 $$$\left[ \begin{array}{c} \mathbf{Y}_{v,1} \\ \vdots \\ \mathbf{Y}_{v,K} \end{array} \right]=-\left[ \begin{array}{c} \text{TE}_1 \mathbf{HL} \\ \vdots \\ \text{TE}_k \mathbf{HL} \end{array} \right]\left[\mathbf{a}_{v,1} \dots \mathbf{a}_{v,S} \right] +\mathbf{N}$$$ or $$$\overline{\mathbf{Y}}_v =\overline{\mathbf{H}} \mathbf{A}_v +\mathbf{N}$$$, where $$$\overline{\mathbf{Y}}_v \in \mathbb{R}^{KT \times S}$$$, $$$\overline{\mathbf{H}} \in \mathbb{R}^{KT \times T}$$$ is the discrete convolution matrix with the time-shifted HRFs, $$$\mathbf{L} \in \mathbb{R}^{T \times T}$$$ is an integration operator, $$$\mathbf{A}_v \in \mathbb{R}^{T \times S}$$$ is the innovation signal of the neuronal-related activity that generates the BOLD response at voxel $$$v$$$, and $$$\mathbf{N} \in \mathbb{R}^{KT \times S}$$$ is assumed as random Gaussian noise.6 To estimate $$$A_v$$$, we propose to solve the following optimization problem:$$$\hat{\mathbf{A}}_v = \text{arg} \min_{\mathbf{A}_v} \| \overline{\mathbf{Y}} - \overline{\mathbf{H}} \mathbf{A} \|_2^2 + \rho \| \mathbf{D}\mathbf{A}_v \|_1 + (1 - \rho) \| \mathbf{D} \mathbf{A}_v \|_{2,1}$$$ where $$$\rho$$$ balances the tradeoff between the l1-norm that promotes sparse estimates for a given timepoint and subject (i.e., individualized responses), and the l2,1-norm that searches for synchronous estimates across subjects at each timepoint, while promoting sparsity across time (see Fig1B).8,9 $$$\mathbf{D} = \text{diag}(\lambda_1, \dots, \lambda_S) \in \mathbb{R}^{S \times S}$$$ is a diagonal matrix with subject-specific regularization parameters $$$\lambda_s$$$, which allows adjusting to the level of noise in each subject's fMRI signal. msPFM is solved using FISTA.10Methods
Simulations: Voxel time-series generated for 50 subjects (3 groups with different ideal BOLD time-courses), plus Gaussian noise. Experimental paradigm: 43 subjects scanned (3T Siemens Prisma, 64-channel coil, TR=1000ms,TE=[13.6,31.86,50.12ms],FA=60º,3x3x3mm3,52 slices,multiband=4) while watching a movie (12:26min:sec).Preprocessing: Despiking, head-motion realignment, affine coregistration to subject-specific T1-weighted image, nonlinear alignment to MNI template, multi-echo ICA denoising (tedana)11, smoothing with an isotropic full-width half-maximum of 4mm, and nuisance regression of the 6 realignment timeseries, their derivatives, and a linear trend. A shared-response model12 in BrainIAK13 was applied to account for individual’s functional topographies. Finally, the multi-echo fMRI data were converted to percent signal change and analyzed with the proposed msPFM algorithm using the Schaefer 1000 ROIs atlas to reduce computational cost.14Results
Figure 2 plots the simulation results. In general, msPFM can blindly estimate the neuronal-related activity from noisy BOLD signals (A) that contain shared responses across subjects and can also recover neuronal-related events that are not shared across subjects, i.e., individual differences (C and D), particularly during the main blocks of activity. Notably, msPFM is able to track the distinct timecourse of activity of a unique individual (green arrows). However, msPFM struggles to detect brief, isolated transients of activity, especially when these occur after longer events (red arrows).Figure 3 depicts the maps of the number of subjects having neural-related BOLD events at four relevant instances of the movie. Highly concordant activity is detected in up to 35 subjects (81%) in the visual cortex (t=82s and 690s), and the auditory and visual cortices (t=285s and 445s), which are expected due to the evoked stimuli at those specific times of the movie. Figure 4 illustrates a posterior-to-anterior cortical gradient in the event rate (# of functional events per minute), defined here as the number of positive changes in the innovation signal. The rate of events is much larger in regions of the primary and secondary visual cortices, followed by the regions of the auditory cortex, than in higher-order frontal regions.15,16 To further assess the functional specificity of the detected events, Figure 5 shows that the group sum of the activity-inducing signals in auditory and visual areas exhibit the largest correlations with changes in the audio envelope and the luminance of the movie, respectively.Acknowledgements
This research was funded by the Spanish Ministry of Economy and Competitiveness (RYC-2017- 415 21845), the Basque Government (BERC 2018-2021, PIB_2019_104, PRE_2020_2_0227), and the Spanish 416 Ministry of Science, Innovation and Universities (PID2019-105520GB-100), and the US National Institutes of Health grant R00MH120257.References
- Finn E.S., Glerean E., Hasson U., Vanderwal T. (2021). Naturalistic Imaging: The use of ecologically valid conditions to study brain function. NeuroImage, 247, Article 118776
- Chen, G., Taylor, P. A., Qu, X., Molfese, P. J., Bandettini, P. A., Cox, R. W., & Finn, E. S. (2020). Untangling the relatedness among correlations, part III: inter-subject correlation analysis through Bayesian multilevel modeling for naturalistic scanning. NeuroImage, 216, 116474.
- Hasson, U., Nir, Y., Levy, I., Fuhrmann, G., & Malach, R. (2004). Intersubject synchronization of cortical activity during natural vision. science, 303(5664), 1634-1640.
- Lee, C. S., Aly, M., & Baldassano, C. (2021). Anticipation of temporally structured events in the brain. Elife, 10.
- Simony, E., Honey, C. J., Chen, J., Lositsky, O., Yeshurun, Y., Wiesel, A., & Hasson, U. (2016). Dynamic reconfiguration of the default mode network during narrative comprehension. Nature communications, 7(1), 1-13.
- Uruñuela, E., Bolton, T. A., Van De Ville, D., & Caballero-Gaudes, C. (2022). Hemodynamic Deconvolution Demystified: Sparsity-Driven Regularization at Work. Aperture (accepted).
- Caballero-Gaudes, C., Moia, S., Panwar, P., Bandettini, P. A., & Gonzalez-Castillo, J. (2019). A deconvolution algorithm for multi-echo functional MRI: Multi-echo Sparse Paradigm Free Mapping. Neuroimage, 202, 116081.
- Uruñuela, E., Gonzalez-Castillo, J., Zheng, C., Bandettini, P., & Gaudes, C. C. (2022). Whole-brain multivariate hemodynamic deconvolution for multi-echo fMRI with stability selection. bioRxiv.
- Gramfort, A., Strohmeier, D., Haueisen, J., Hamalainen, M., & Kowalski, M. (2011, July). Functional brain imaging with M/EEG using structured sparsity in time-frequency dictionaries. In Biennial International Conference on Information Processing in Medical Imaging (pp. 600-611). Springer, Berlin, Heidelberg.
- Beck, A., & Teboulle, M. (2009). A fast iterative shrinkage-thresholding algorithm for linear inverse problems. SIAM journal on imaging sciences, 2(1), 183-202.
- DuPre, E., Salo, T., Ahmed, Z., Bandettini, P. A., Bottenhorn, K. L., Caballero-Gaudes, C., ... & Handwerker, D. A. (2021). TE-dependent analysis of multi-echo fMRI with* tedana. Journal of Open Source Software, 6(66), 3669.
- Chen, P. H. C., Chen, J., Yeshurun, Y., Hasson, U., Haxby, J., & Ramadge, P. J. (2015). A reduced-dimension fMRI shared response model. Advances in Neural Information Processing Systems, 28.
- Kumar, M., Anderson, M. J., Antony, J. W., Baldassano, C., Brooks, P. P., Cai, M. B., ... & Norman, K. A. (2021). BrainIAK: The brain imaging analysis kit. Aperture neuro, 1(4).
- Schaefer, A., Kong, R., Gordon, E. M., Laumann, T. O., Zuo, X. N., Holmes, A. J., ... & Yeo, B. T. (2018). Local-global parcellation of the human cerebral cortex from intrinsic functional connectivity MRI. Cerebral cortex, 28(9), 3095-3114.
- Sava-Segal, C., Richards, C., Leung, M., & Finn, E. S. (2022). Individual variability in neural event segmentation reflects stimulus content and interpretation. bioRxiv.
- Baldassano, C., Chen, J., Zadbood, A., Pillow, J. W., Hasson, U., & Norman, K. A. (2017). Discovering event structure in continuous narrative perception and memory. Neuron, 95(3), 709-721.
Figures
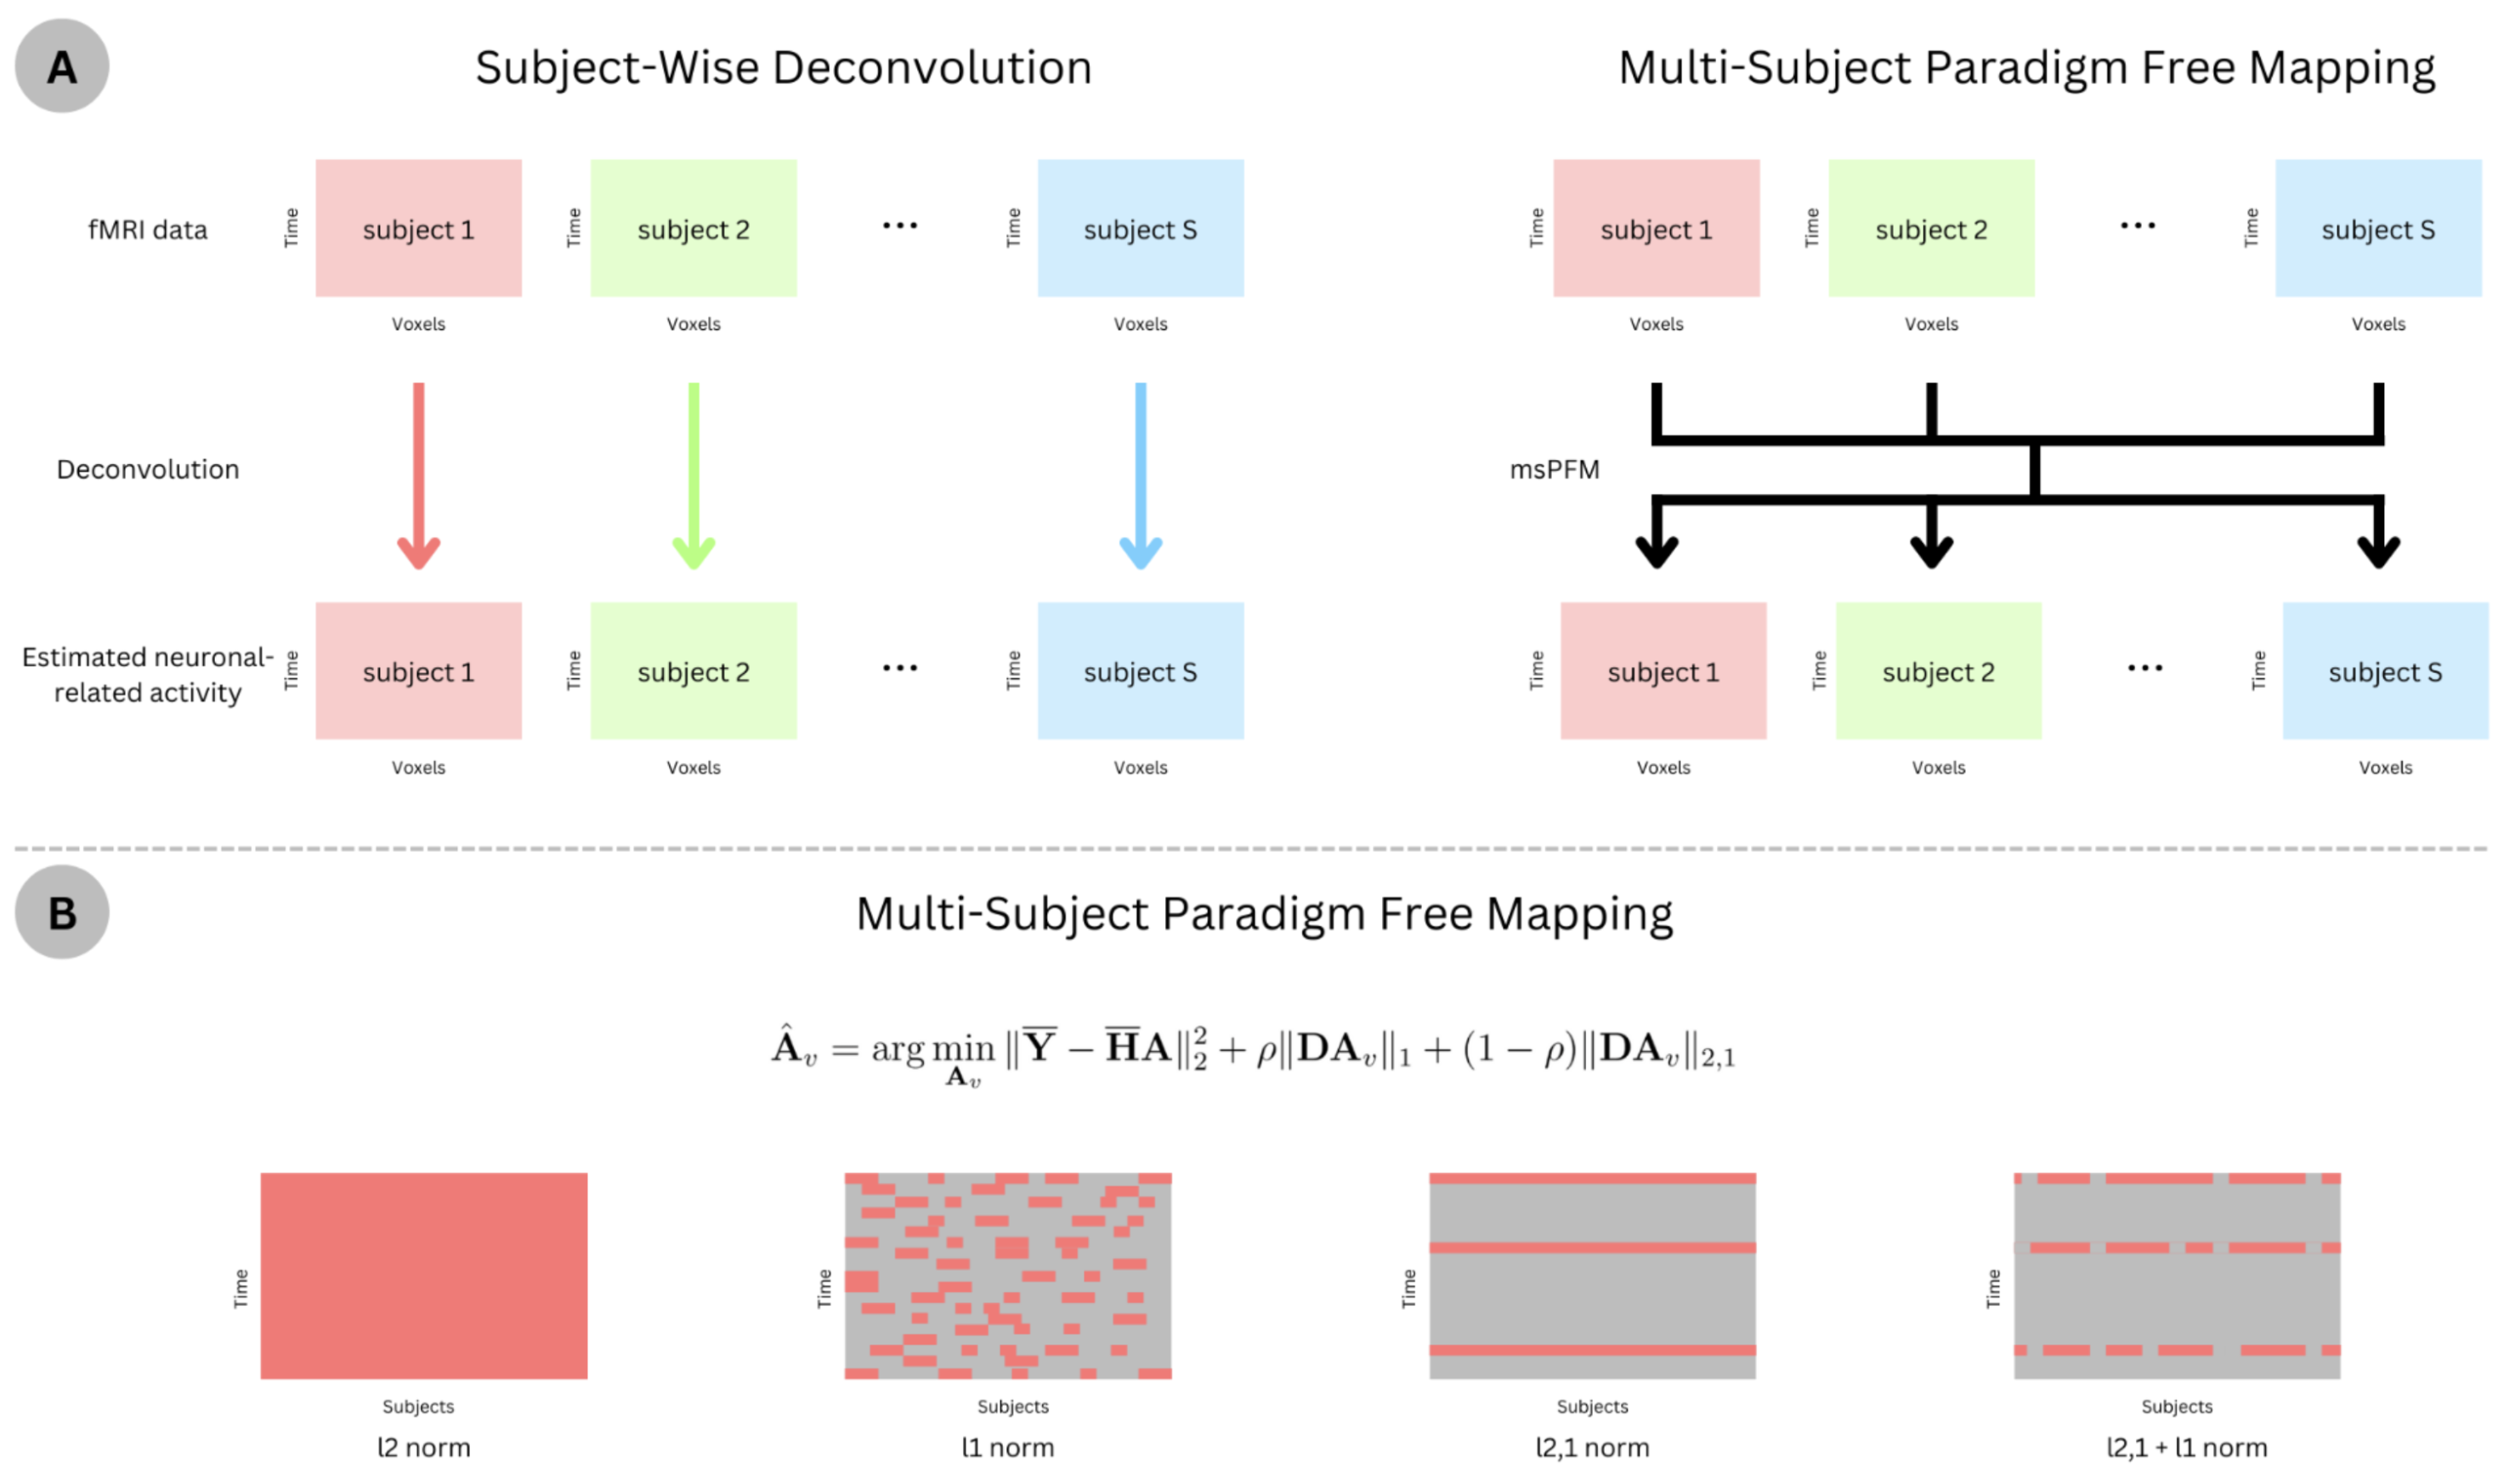
A) Schematic of applying deconvolution techniques subject-wise, where the estimation of activity in each subject is agnostic about the other subjects’ activity, versus the proposed multi-subject paradigm free mapping algorithm, where the estimation can leverage the common information across subjects while allowing for individual differences. B) Illustration of the estimated activity patterns promoted by different regularization terms. Red indicates non-zero activity.
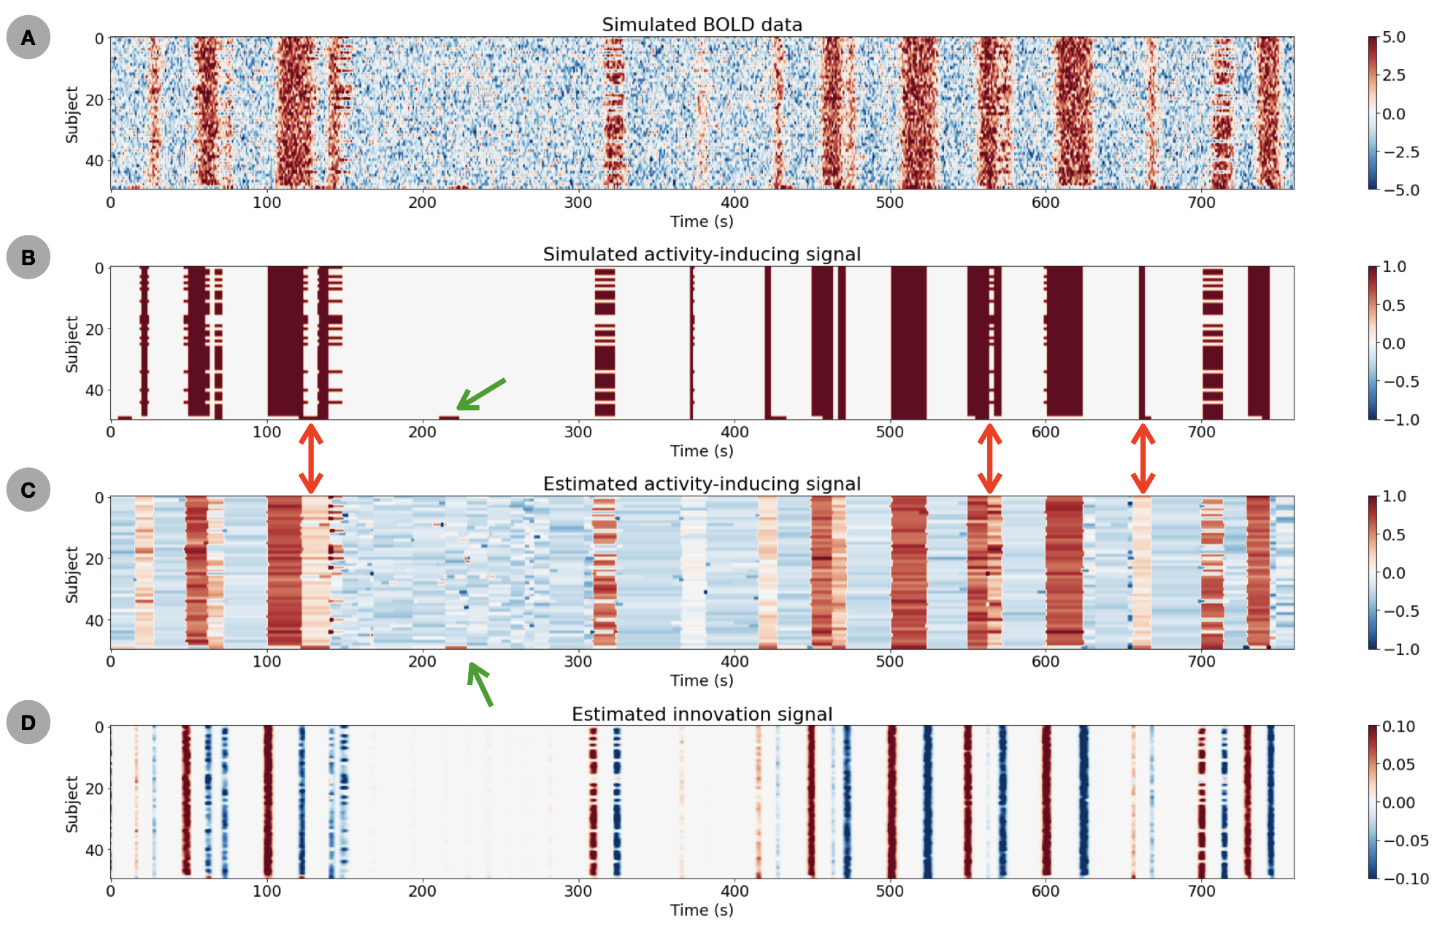
A) Simulated BOLD signal (convolution with HRF) plus noise. B) Corresponding simulated activity-inducing signal with 3 groups of subjects (n=35,14,1 subjects) with different activity patterns. C) estimates of the activity-inducing signal obtained with msPFM. D) estimates of the innovation signal (i.e., derivative of activity-inducing signal) obtained with the proposed msPFM method.
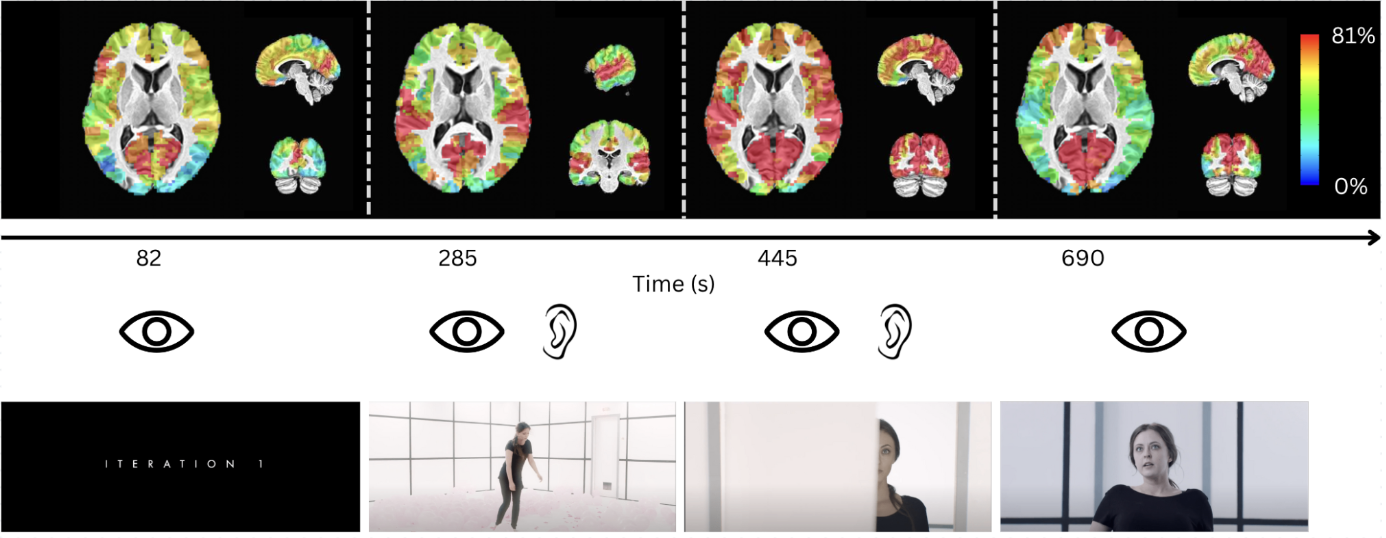
Maps of the number of subjects in whom a neuronal-related BOLD event was blindly detected by msPFM in four instances of the movie (colorbar ranges from 0% to 81% (35/43) of subjects). Scene screenshots corresponding to the selected TRs are shown below. A notable example is that while the maps at t=82s, 445s and 690s show consistent recruitment of occipital regions across subjects, only the later ones reveal the involvement of the fusiform gyrus associated with face processing.
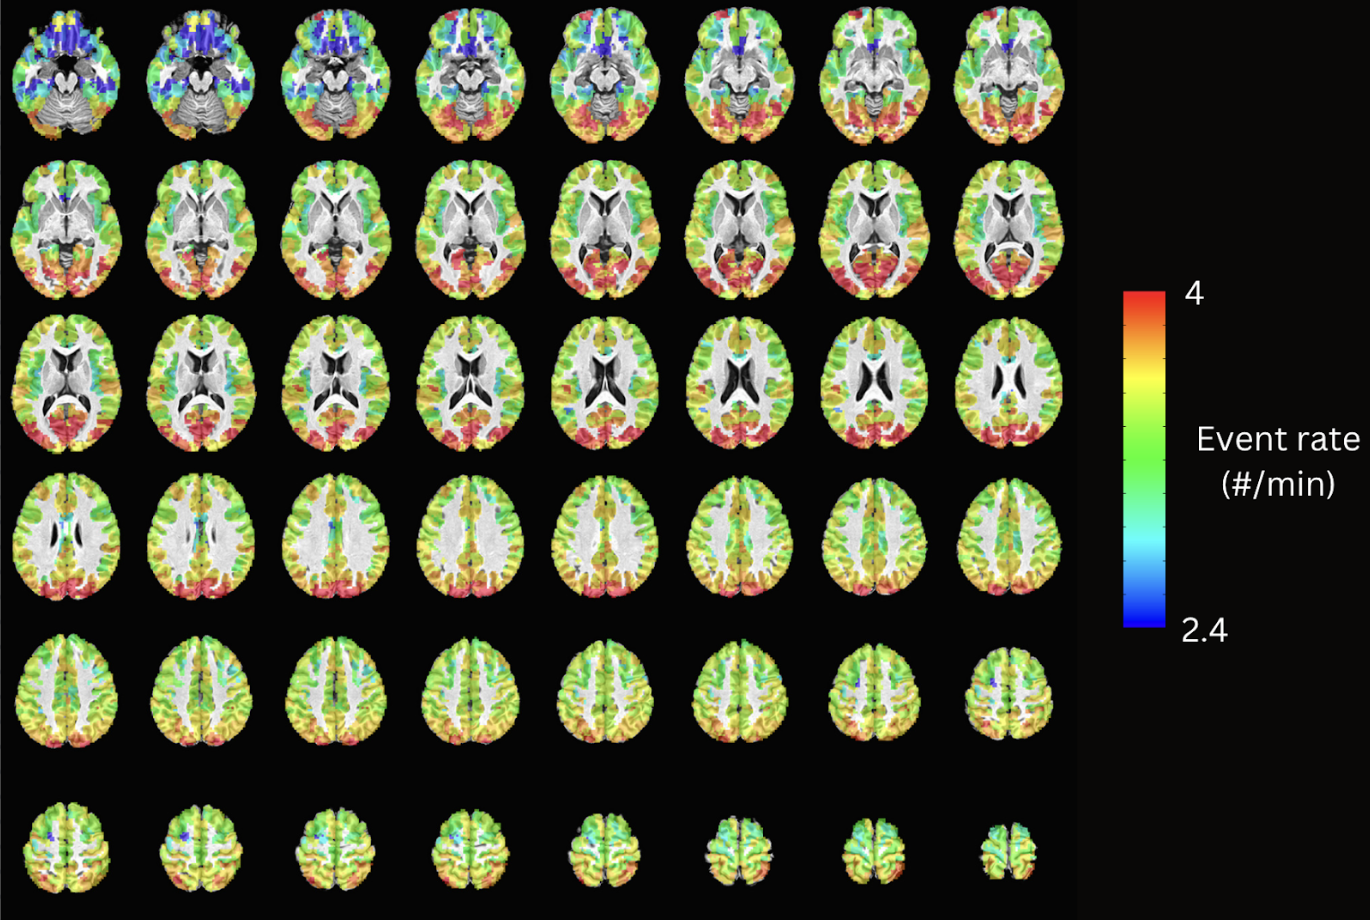
Maps of the event rate (i.e., number of detected neuronal-related events per minute). The observed cortical posterior-to-anterior gradient is in line with previous literature that studies naturalistic fMRI data using Hidden Markov Models, where posterior sensory areas such as the visual and auditory cortices show a higher frequency of events, while higher-order frontal areas show a slower frequency of events.
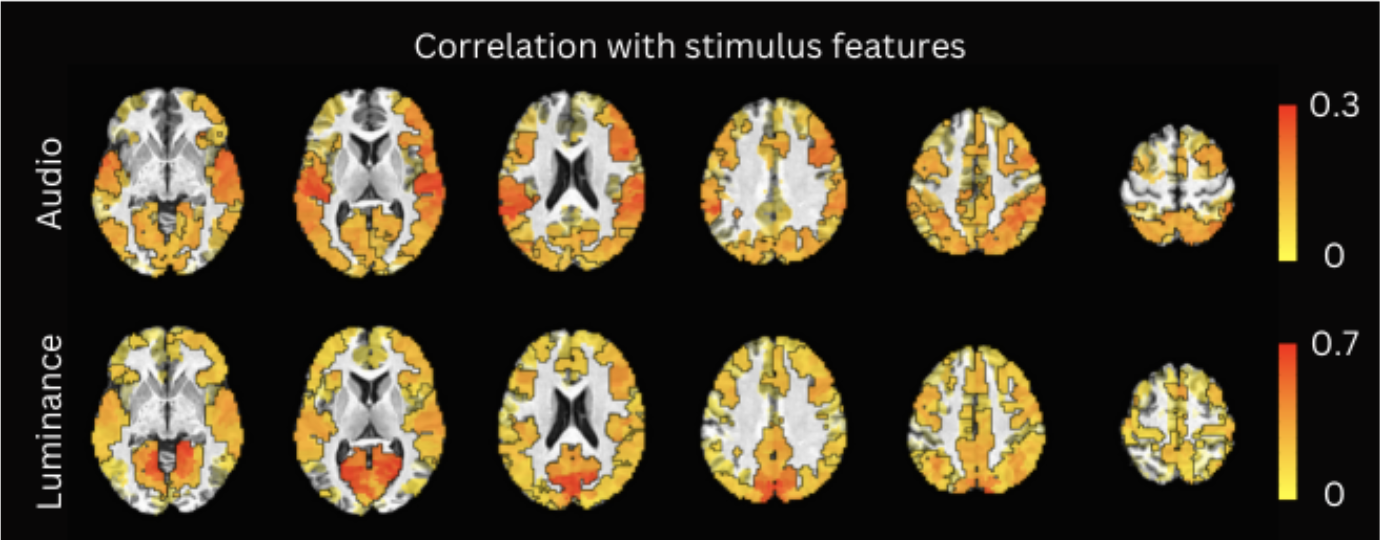
Correlation (Pearson’s) between the group sum of the estimated activity-inducing signals with changes in the movie’s audio envelope (row 1) and changes in brightness (row 2). Significant ROIs are depicted as opaque and outlined with black contours, while sub-threshold locations are shown with decreasing opacity as the ROI’s statistical significance decreases.
DOI: https://doi.org/10.58530/2023/1024