1013
2D Self-Navigation Improves Respiratory Motion Tracking Compared with 1D Self-Navigation in 3D Left Atrial LGE using XD-GRASP Reconstruction1Radiology, Northwestern University Feinberg School of Medicine, Chicago, IL, United States, 2Electrical and Computer Engineering, Northwestern University Feinberg School of Medicine, Evanston, IL, United States, 3Medicine, Cardiology, Hospital of the University of Pennsylvania, Philadelphia, PA, United States, 4Medicine, Cardiology, Northwestern University Feinberg School of Medicine, Chicago, IL, United States, 5Biomedical Engineering, Johns Hopkins University, Baltimore, MD, United States
Synopsis
Keywords: Motion Correction, Arrhythmia, Late Gadolinium Enhancement
Previously described left atrial (LA) late gadolinium enhancement (LGE) using a stack-of-stars k-space sampling pattern with XD-GRASP reconstruction may produce blurry LA wall due to signal variation of inversion-recovery-prepared 1D self-navigation caused by arrhythmia. We hypothesize 2D image self-navigation would be less sensitive to arrhythmia for motion tracking in XD-GRASP framework. In this study, we developed a free-breathing, LA LGE pulse sequence with isotropic spatial resolution using a stack-of-stars sampling pattern and 2D self-navigation and compared its performance against conventional 1D self-navigation in patients with atrial fibrillation. Results show that 2D self-navigation improves respiratory motion tracking compared with 1D.INTRODUCTION
Late gadolinium enhancement (LGE)1 is the gold standard for evaluation of myocardial fibrosis, including in the left atrium (LA)2. Our group has recently developed a free-breathing, LA LGE pulse sequence using a stack-of-stars k-space sampling pattern with XD-GRASP3 reconstruction, which used 1D self-navigation (1D-navi) oriented along the head-to-foot direction to track respiratory motion4. The 1D-navi signal was acquired immediately before LGE readout and used to assign each LGE readout into a respiratory state or bin using principal component analysis (PCA). However, PCA coefficients were frequently contaminated by sources of signal variation, such as 1) irregular inversion-recovery (IR) due to arrythmia in patients with atrial fibrillation (AF) and 2) 1D projection of body surface structures with bright signals (e.g., subcutaneous fat) that superimposes onto the relevant anatomical features (e.g., lung-liver interface) essential for tracking respiratory motion. This problem often translates into inconsistent PCA coefficient resulting in inaccurate respiratory motion tracking, which requires manual selection of a PCA coefficient that best tracks motion. We hypothesize that 2D image self-navigation (2D-navi) is less sensitive to signal variation of IR caused by arrhythmia compared with 1D-navi. In this study, we developed a free-breathing, LA LGE pulse sequence using a stack-of-stars sampling pattern with isotropic spatial resolution and 2D-navi and compared its performance against 1D-navi in patients with AF. Our benchmark for success was automation of XD-GRASP reconstruction.METHODS
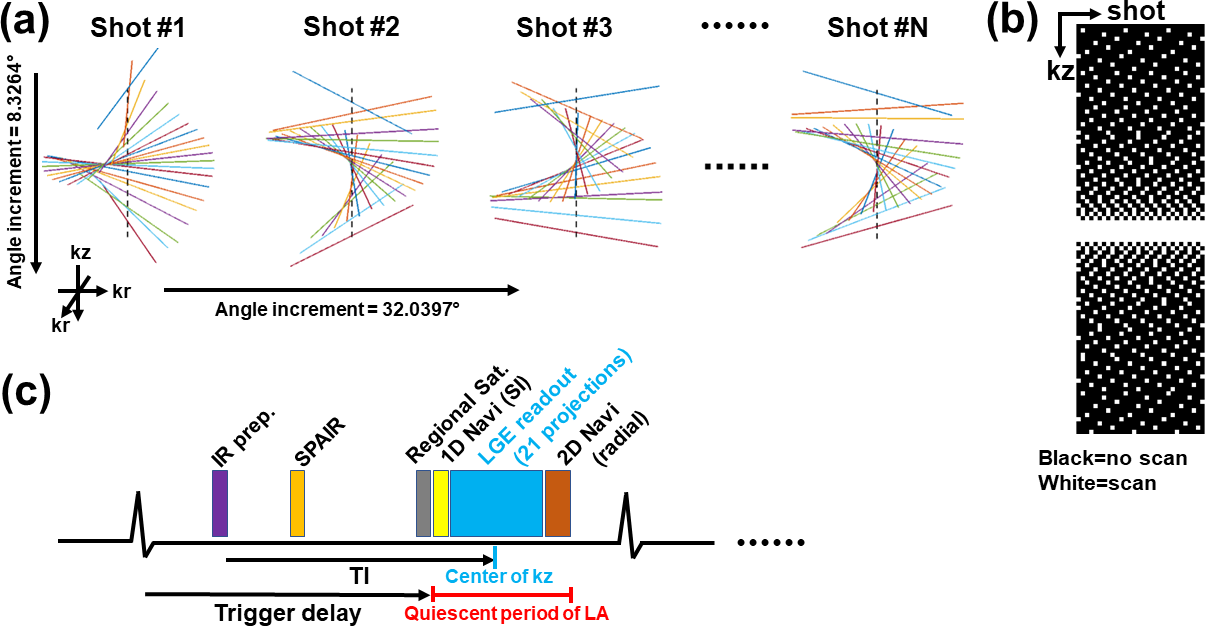
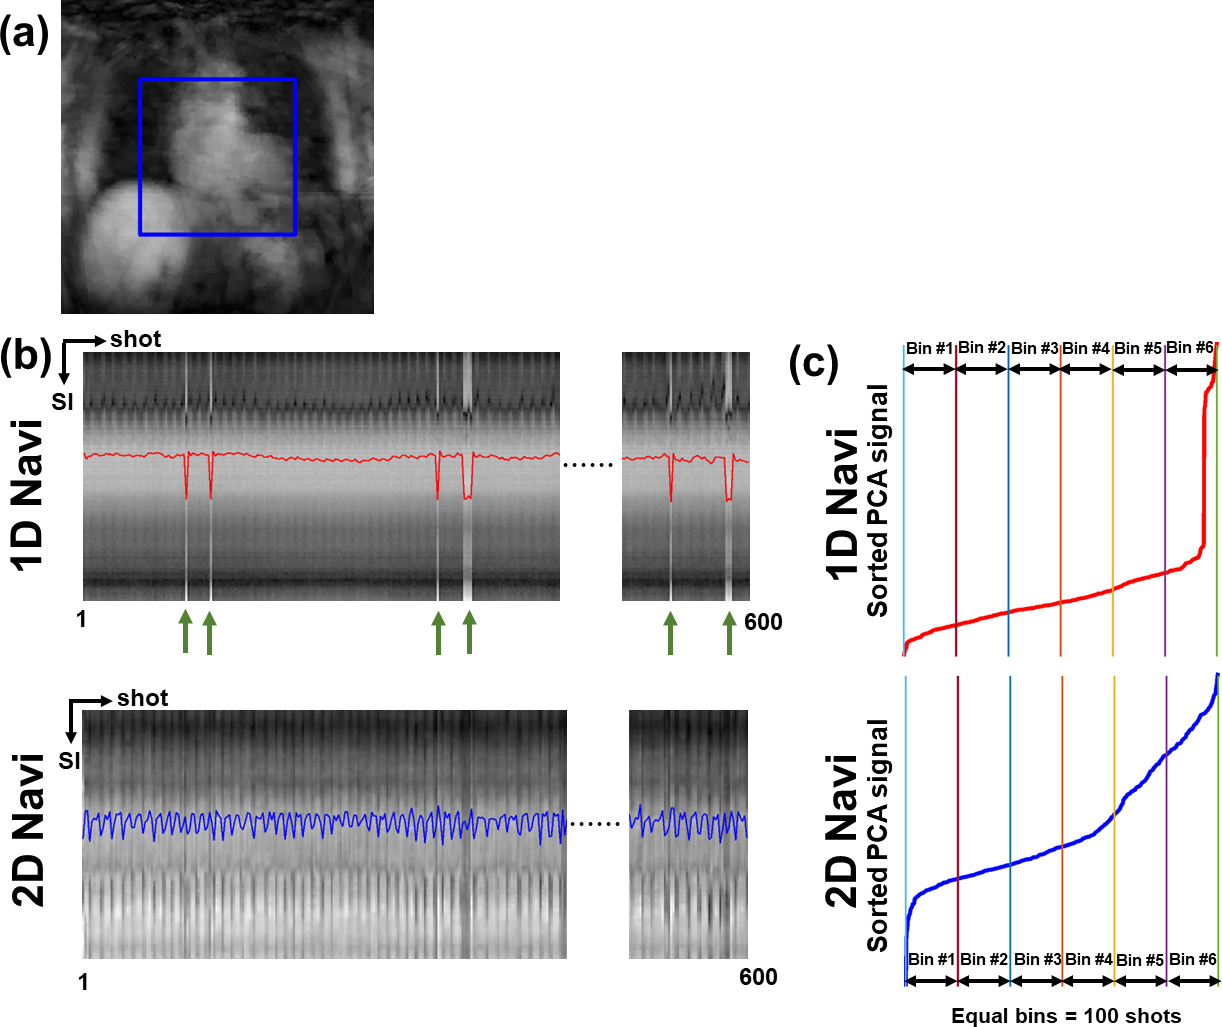
Pulse Sequence: We developed an IR 3D-isotropic stack-of-stars pulse sequence with variable density along slice direction (i.e., kz) and added 1D-navi (oriented along superior-inferior [SI] direction) and 2D-navi (6 radial projections at the center of kz with angle increment=32.0397°) acquisitions per heartbeat as shown in Figure 1. The relevant imaging parameters were: FOV=336x336x120 mm3 (coronal plane), reconstruction matrix=224x224x80, spatial resolution=1.5x1.5x1.5 mm3, 20% oversampling in kz (96 slices in total), flip angle=15°, TE/TR =2.11/4.76 msec, receiver bandwidth=421 Hz/pixel, spoiled gradient-echo readout, 21 radial projections per heartbeat (or shot) along kz with variable density, LGE readout duration=100 msec, projection angle increment of 8.3264° within shot and 32.0397° between shots, SPAIR fat suppression, ECG trigger every heartbeat, total scan duration=600 heartbeats, 3 regional saturation bands to suppress bright signals at the abdomen and arms. MRI Studies: We enrolled 9 patients with AF (7 males; 61.9 ± 12.3 yrs) and performed 3D-isotropic LA LGE at 20-30 min after administration of 0.2 mmol/kg of gadobutrol (Gadavist, Bayer). During the scan, all patients had arrhythmia ranging from light to severe (Min. and Max. coefficient of variation in individual R-R intervals=4.1% and 35.4%, respectively). The quiescent period of LA was identified using a free-breathing cine scan in 4-chamber view. Optimal TI was identified using a single-shot TI scout with 60 k-space ky-lines per shot with GRAPPA (R=2) at 5 consecutive heartbeats, which matches the readout timing of our 3D LGE. Image Reconstruction: We automated the XD-GRASP3 reconstruction pipeline to select the second PCA coefficient from 1D-navi and 2D-navi. For 1D-navi, we used the same method as previously described4. For 2D-navi, we performed compressed sensing (CS) to reconstruct a low-resolution 2D image (6 radial projections per frame per heartbeat) for 600 heartbeats, where temporal and spatial total variations were used as sparsifying transforms with regularization weights of 0.001 and 0.00025, respectively. Then we extracted the half-size FOV at the center of the 2D images and averaged along the left-right direction to create 1D-navi like signals capturing the respiratory motions along SI direction while excluding unwanted signals. PCA was applied to 1D-navi and pseudo-1D-navi, and the second coefficient was selected and ascending-sorted and then its corresponding LGE readouts were assigned equally into 6 respiratory bins (see Figure 2). Image Analysis: We calculated blur metric (0=sharp; 1=blur)5 in each slice of 6 respiratory 3D-volumes encapsulating the heart. We identified the top and bottom location of an internal organ (e.g., spleen or liver) among 6 respiratory states and measured the maximum displacement. Statistical Analysis: We compared all measurements between 1D-navi and 2D-navi by using a paired t-test. P<0.05 was considered statistically significant.RESULTS
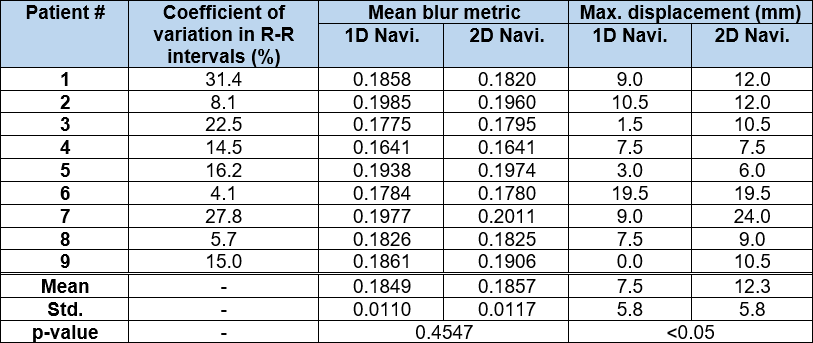
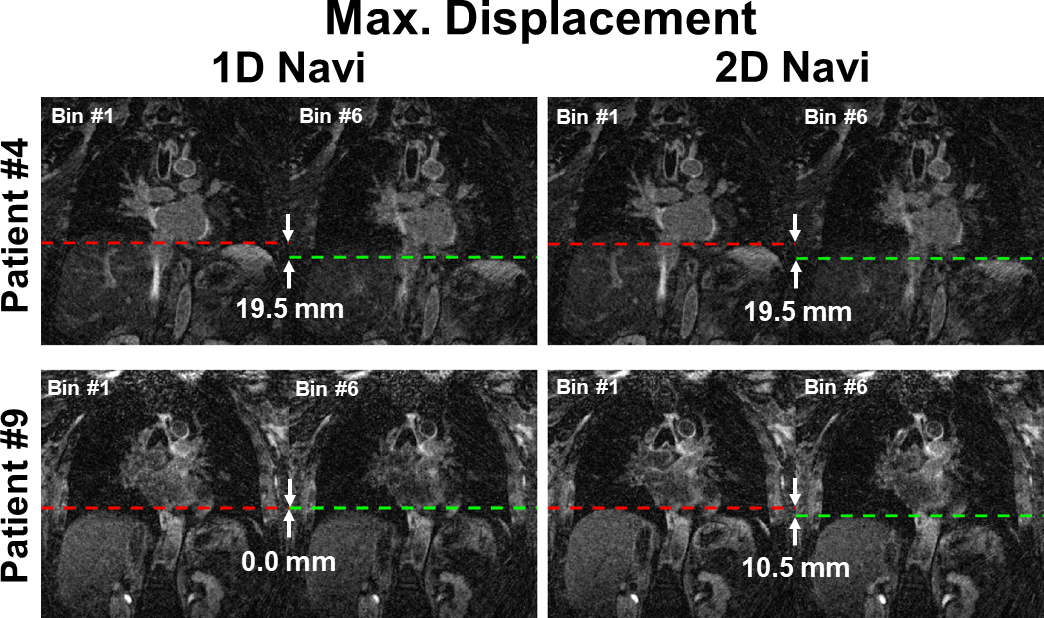
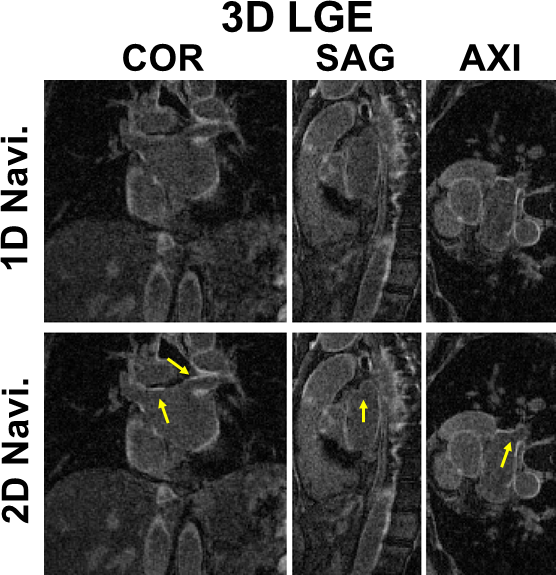
Mean blur metric was not significantly different between 1D-navi (0.1849±0.0110) and 2D-navi (0.1857±0.0117) results. The maximum displacement was significantly (p<0.05) longer for 2D-navi (12.3±5.8 mm) than 1D-navi results (7.5±5.8 mm). The range of maximum displacement was 0.0 to 19.5 mm for 1D-navi and 6.0 to 24.0 mm for 2D-navi, respectively. Mean blur metric and maximum displacement of 1D-navi and 2D-navi were summarized in Table 1. Figure 3 shows maximum displacement between respiratory state 1 and 6 in one patient where both performed equally well, and another patient where 2D-navi outperformed 1D-navi (0.0 mm and 10.5 mm displacement in 1D-navi and 2D-navi, respectively). Figure 4 compares representative LGE images at coronal, sagittal, and axial views between 1D-navi and 2D-navi in patient #5.DISCUSSION
We demonstrated that 2D-navi improves tracking respiratory motions in 3D-isotropic LA LGE using XD-GRASP compared with conventional 1D-navi. This improved motion tracking with consistent PCA signal processing enables automation of XD-GRASP image reconstruction. Future study includes automated inline image reconstruction pipeline using Siemens FIRE (Framework for Image Reconstruction Environments).CONCLUSION
2D image self-navigation produces consistent PCA signal processing and improves tracking of respiratory motions, thereby enabling automation of 3D-isotropic LA LGE reconstruction using XS-GRASP.Acknowledgements
This study was partially funded by National Institutes of Health (R01HL116895, R21AG055954, R01HL151079, R21EB030806A1) and American Heart Association (19IPLOI34760317, 949899).References
1. Kim RJ, Fieno DS, Parrish TB, Harris K, Chen EL, Simonetti O, Bundy J, Finn JP, Klocke FJ, Judd RM. Relationship of MRI delayed contrast enhancement to irreversible injury, infarct age, and contractile function. Circulation 1999;100(19):1992-2002.
2. Oakes RS, Badger TJ, Kholmovski EG, Akoum N, Burgon NS, Fish EN, Blauer JJ, Rao SN, DiBella EV, Segerson NM, Daccarett M, Windfelder J, McGann CJ, Parker D, MacLeod RS, Marrouche NF. Detection and quantification of left atrial structural remodeling with delayed-enhancement magnetic resonance imaging in patients with atrial fibrillation. Circulation 2009;119(13):1758-1767.
3. Feng L, Axel L, Chandarana H, Block KT, Sodickson DK, Otazo R. XD-GRASP: Golden-angle radial MRI with reconstruction of extra motion-state dimensions using compressed sensing. Magn Reson Med 2016;75(2):775-788.
4. Gunasekaran S, Haji-Valizadeh H, Lee DC, Avery RJ, Wilson BD, Ibrahim M, Markl M, Passman RS, Kholmovski EG, Kim D. Accelerated 3D Left Atrial Late Gadolinium Enhancement in Patients with Atrial Fibrillation at 1.5 T: Technical Development. Radiol Cardiothorac Imaging 2020;2(5):e200134.
5. Crété-Roffet F. The Blur Effect: Perception and Estimation with a New No-Reference Perceptual Blur Metric. 2007; Proceedings of SPIE - The International Society for Optical Engineering 12, États-Unis d'Amérique.
Figures