1008
Transcriptomic Signatures of Brain Regions Vulnerable to Anatomical and Metabolic Changes in Temporal Lobe Epilepsy1School of Biomedical Engineering, Shanghai Jiao Tong University, Shanghai, China
Synopsis
Keywords: Epilepsy, Tissue Characterization
Imaging transcriptomics could bridge the gap between connectome and transcriptome. In this study, we selected brain regions that were vulnerable to hypometabolism, and those vulnerable to atrophy, then investigated transcriptional signatures and cell-type composition differences that may contribute to TLE-related brain structural and metabolic changes. We found hippocampus and entorhinal were found to be most vulnerable brain regions in both anatomical and metabolic changes in TLE patients. Enrichment analysis found that differential expression genes most significantly enriched in neuroactive ligand-receptor interaction pathway. Inhibitory neuron, microglia and oligodendrocyte precursor cells showed significant difference between vulnerable regions and relatively healthy regions.Introduction
Mesial temporal lobe epilepsy (mTLE) is the most common type of drug refractory epilepsy1, which could benefit from imaging transcriptomics studies to elucidate underlying cellular and molecular mechanisms. Previous studies have made efforts in exploring transcriptional signatures corresponding to neuroanatomical change2, structural and functional coupling3 and structural network alteration4 in epilepsy, partially enabled by the open-access high resolution whole brain transcriptome datasets Allen human brain atlas (AHBA)5,6. Hypometabolism in mesial temporal brain regions as well as certain extratemporal regions is widely observed in FDG PET studies of mTLE7,8. In this study, we selected brain regions that are vulnerable to hypometabolism, and those vulnerable to atrophy, then investigated transcriptional signatures and cell-type composition differences that may contribute to TLE-related brain structural and metabolic changes.Methods
Data acquisitionIn this IRB approved study, we recruited 73 patients with a clinical diagnosis of unilateral mTLE and 55 healthy controls. Image data were collected on the Siemens PET/MR Synchronous integrated scanner (Biograph mMR), including T1-weighted MPRAGE images (TR/TE/TI = 1900/2.44/900 ms, resolution = 1.0 × 1.0 × 1.0 mm3, FOV = 256 × 256 mm2, 192 slices) and T2-weighted FLAIR (TR/TE/TI = 8460/92/2433 ms, resolution = 0.4 × 0.4 × 3.0 mm3, FOV = 220 × 220 mm2, 45 slices) for all subjects. The [18F] fluorodeoxyglucose-PET (FDG-PET) were obtained at 30~60 minutes post a bolus injection of 18F-FDG (mean dose of 3.7 MBq/kg, matrix size = 344 × 344, voxel size = 2.0 × 2.0 × 2.0 mm3, 127 slices) for all patients and 36 of healthy controls.
Imaging data processing
FreeSurfer v6.0.0 was used to obtain brain segmentations of T1-weighted images based on the Desikan-Killiany atlas (DK atlas)9. Cortical thickness and subcortical volumes were extracted to evaluate brain atrophy. 18F-FDG PET was registered to T1w and standardized uptake value ratio (SUVR) was determined to normalize intensities by using cerebellum gray matter as the reference. The SUVR of each ROI was extracted using DK atlas mask.
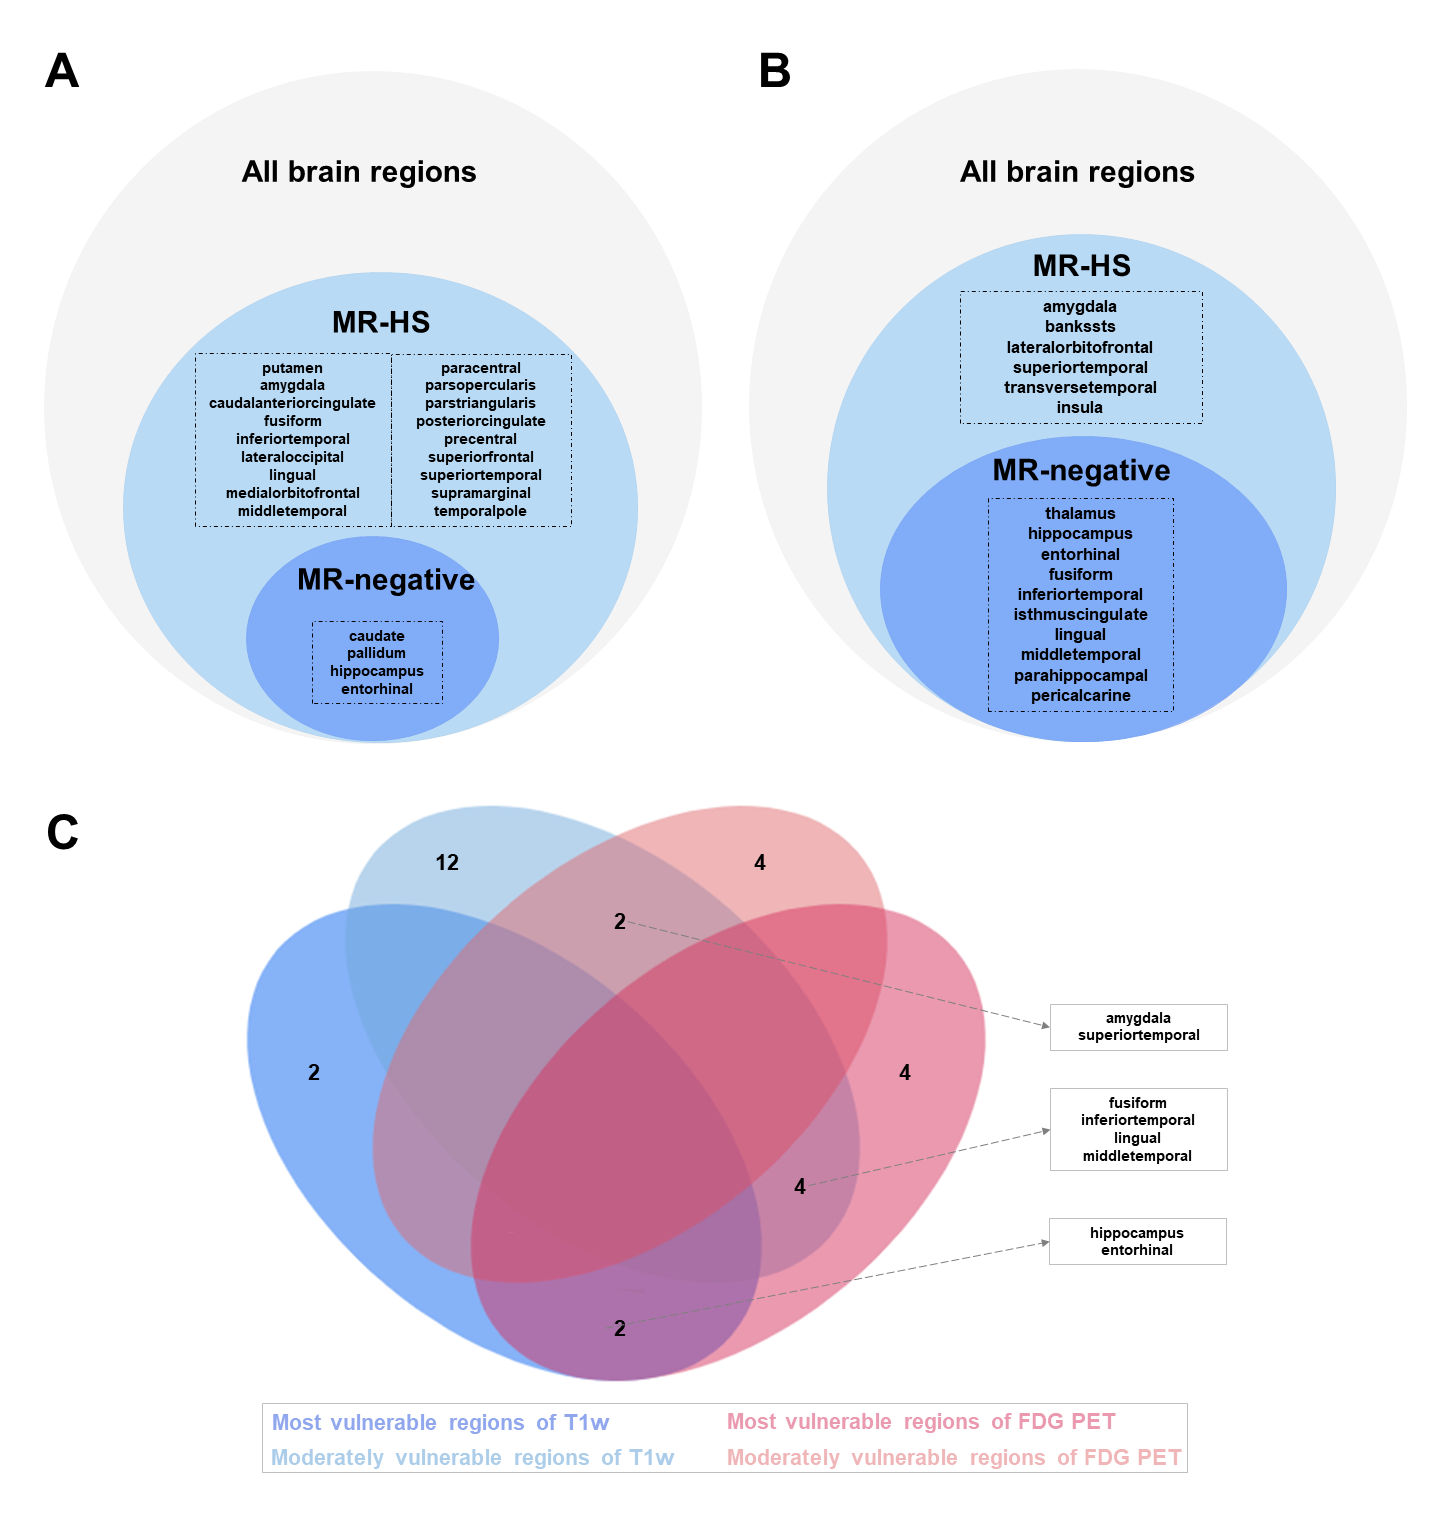
Mann-Whitney U test was used to compare ipsilateral brain regions in MR hippocampal sclerosis (MR-HS) and MR-negative groups to corresponding ROIs in healthy control group to obtain vulnerable regions from SUVR data and atrophy data respectively. Brain regions identified in both MR-HS and MR-negative groups are considered most vulnerable; brain regions identified in MR-HS only are considered moderately vulnerable, while the rest are considered relatively healthy to seizure related damages.
Transcriptome data analysis
AHBA was download from http://www.brain-map.org. We restricted our analysis to the left hemisphere, which are available for all subjects in AHBA.
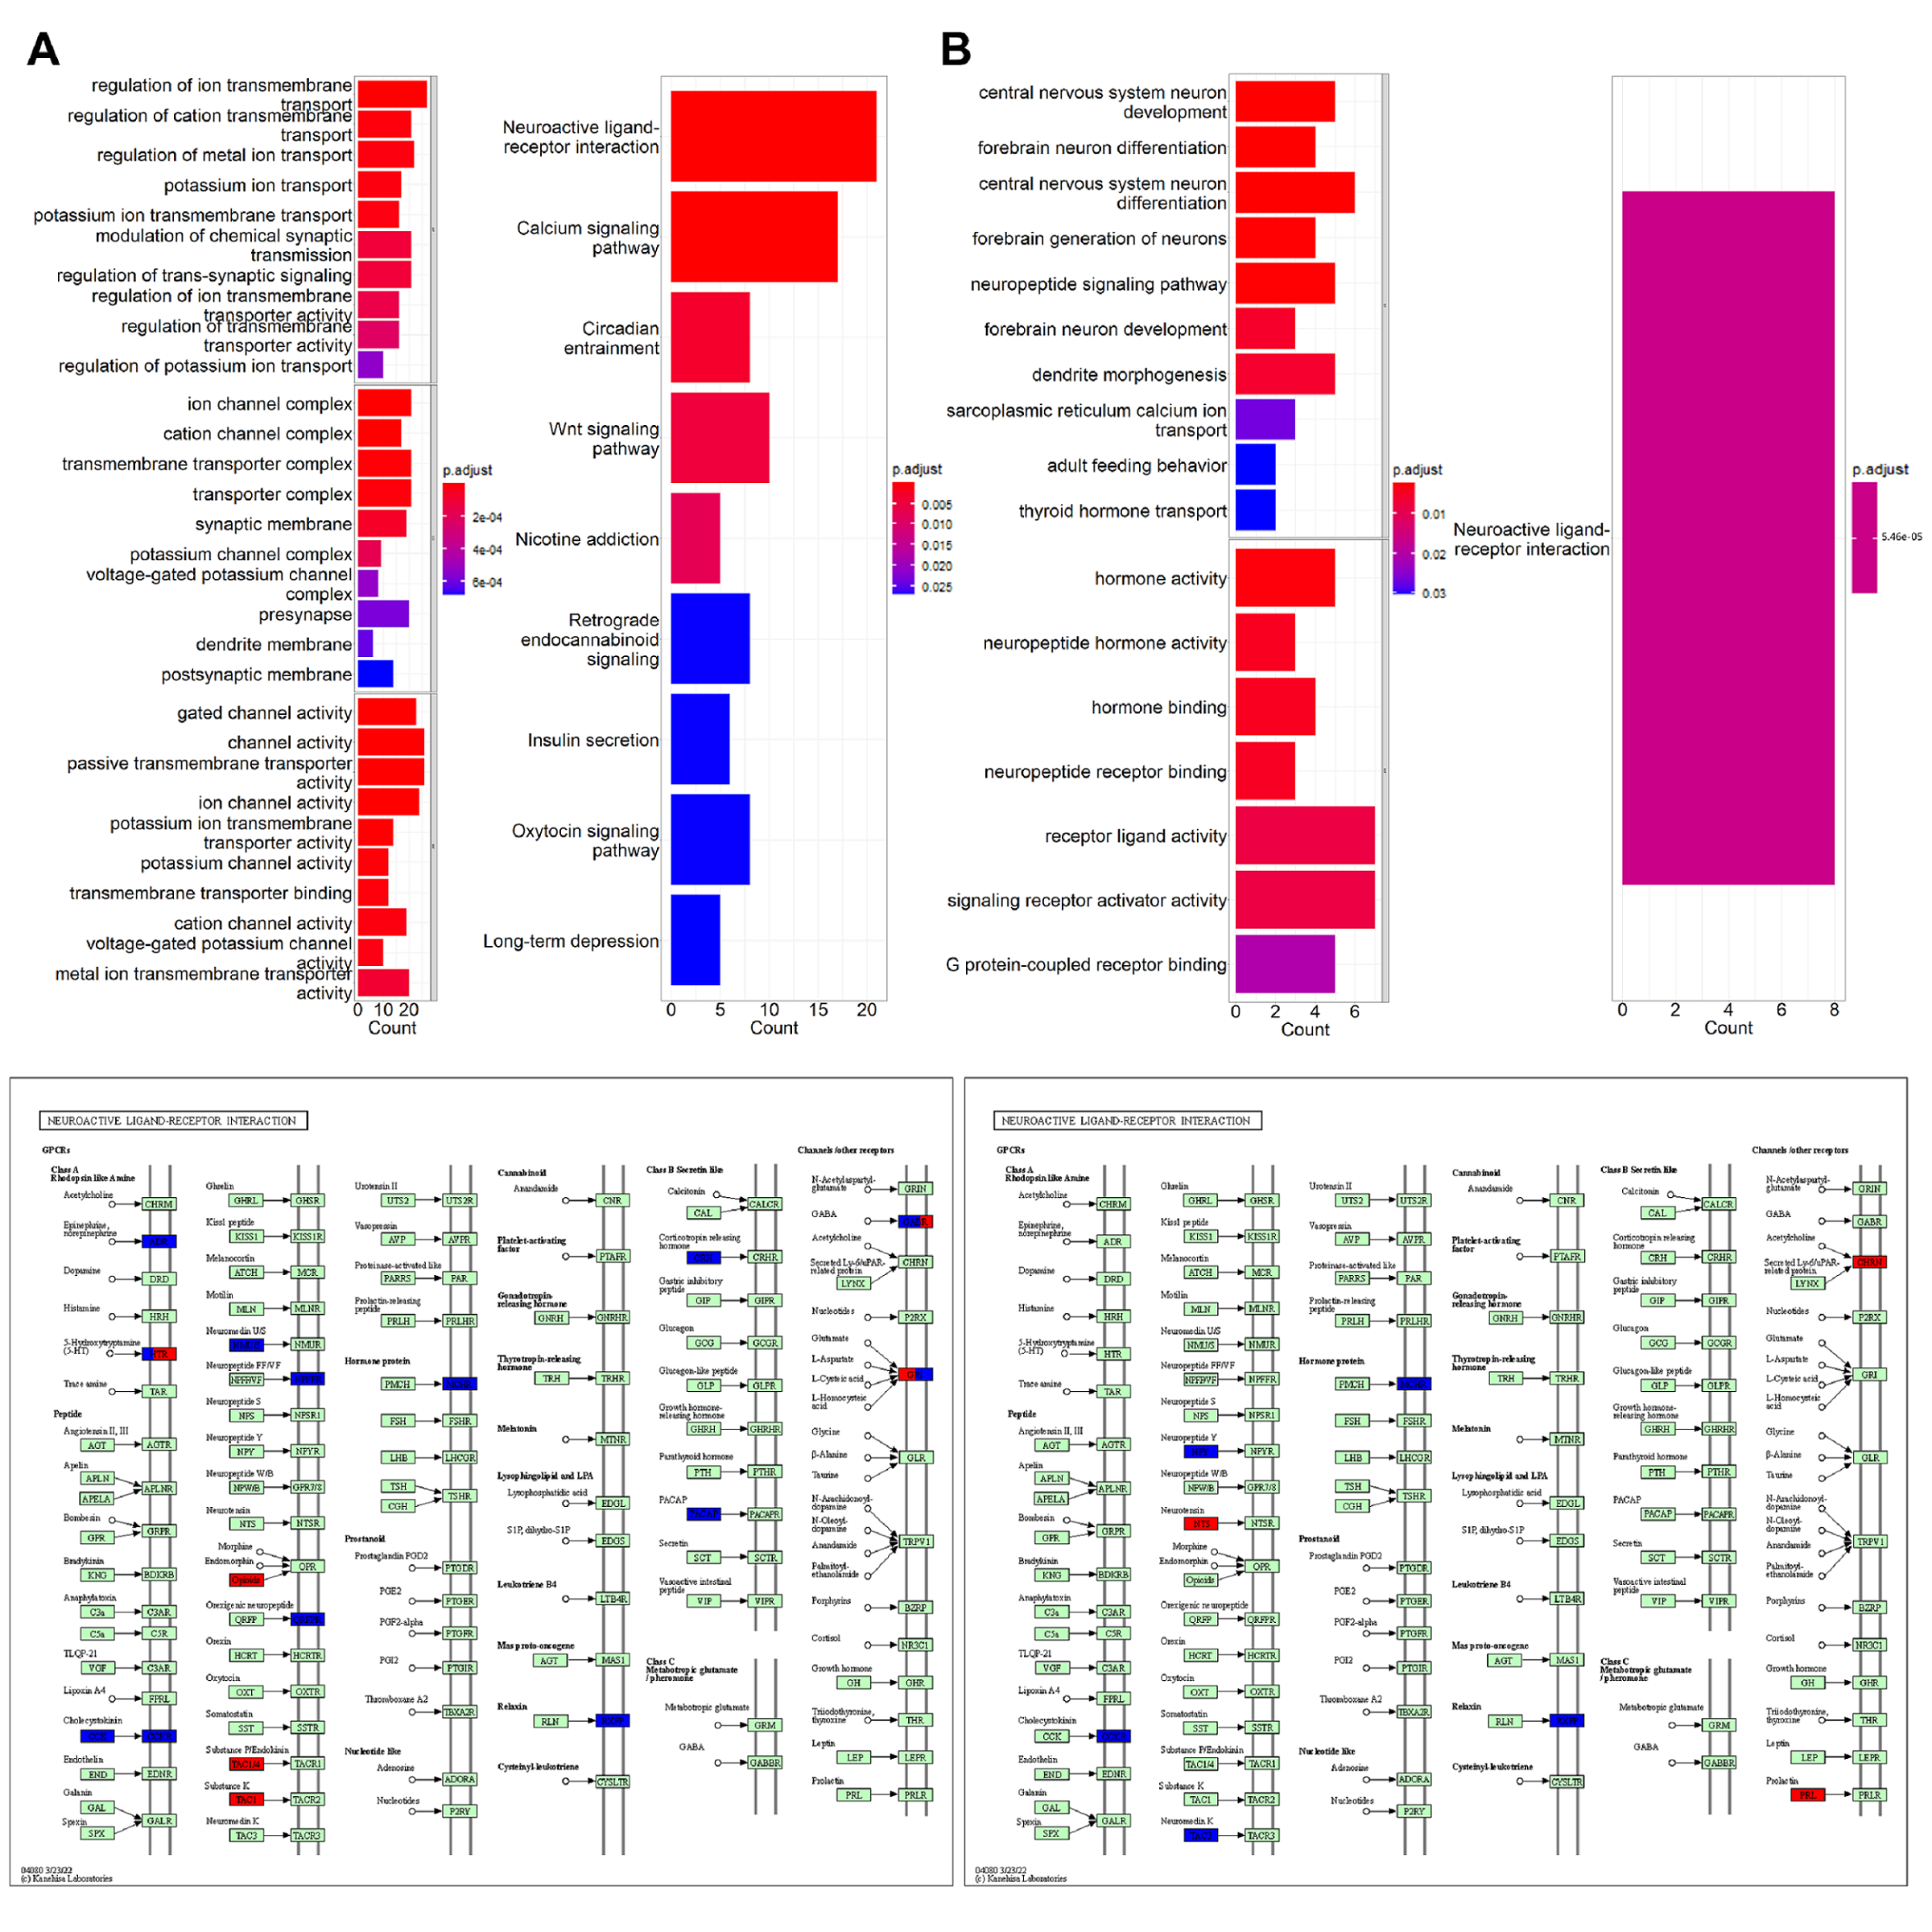
For gene selection, microarray probes were re-annotated using data provided by Arnatkeviciute A et al10. And we calculated the mean of all available probes for a gene. The identification of differential expression genes (DEGs) between the two types vulnerable regions and relatively healthy regions was performed using Limma11 package in R v4.2.1 with a threshold of fold-change ≥ 2 and P≤0.05. Enrichment analysis was implemented in the following gene sets and gene ontologies: Gene and Ontology (GO) and Kyoto Encyclopedia of Genes and Genomes (KEGG) to identify cellular processes or pathways that may be enriched by the differential genes.
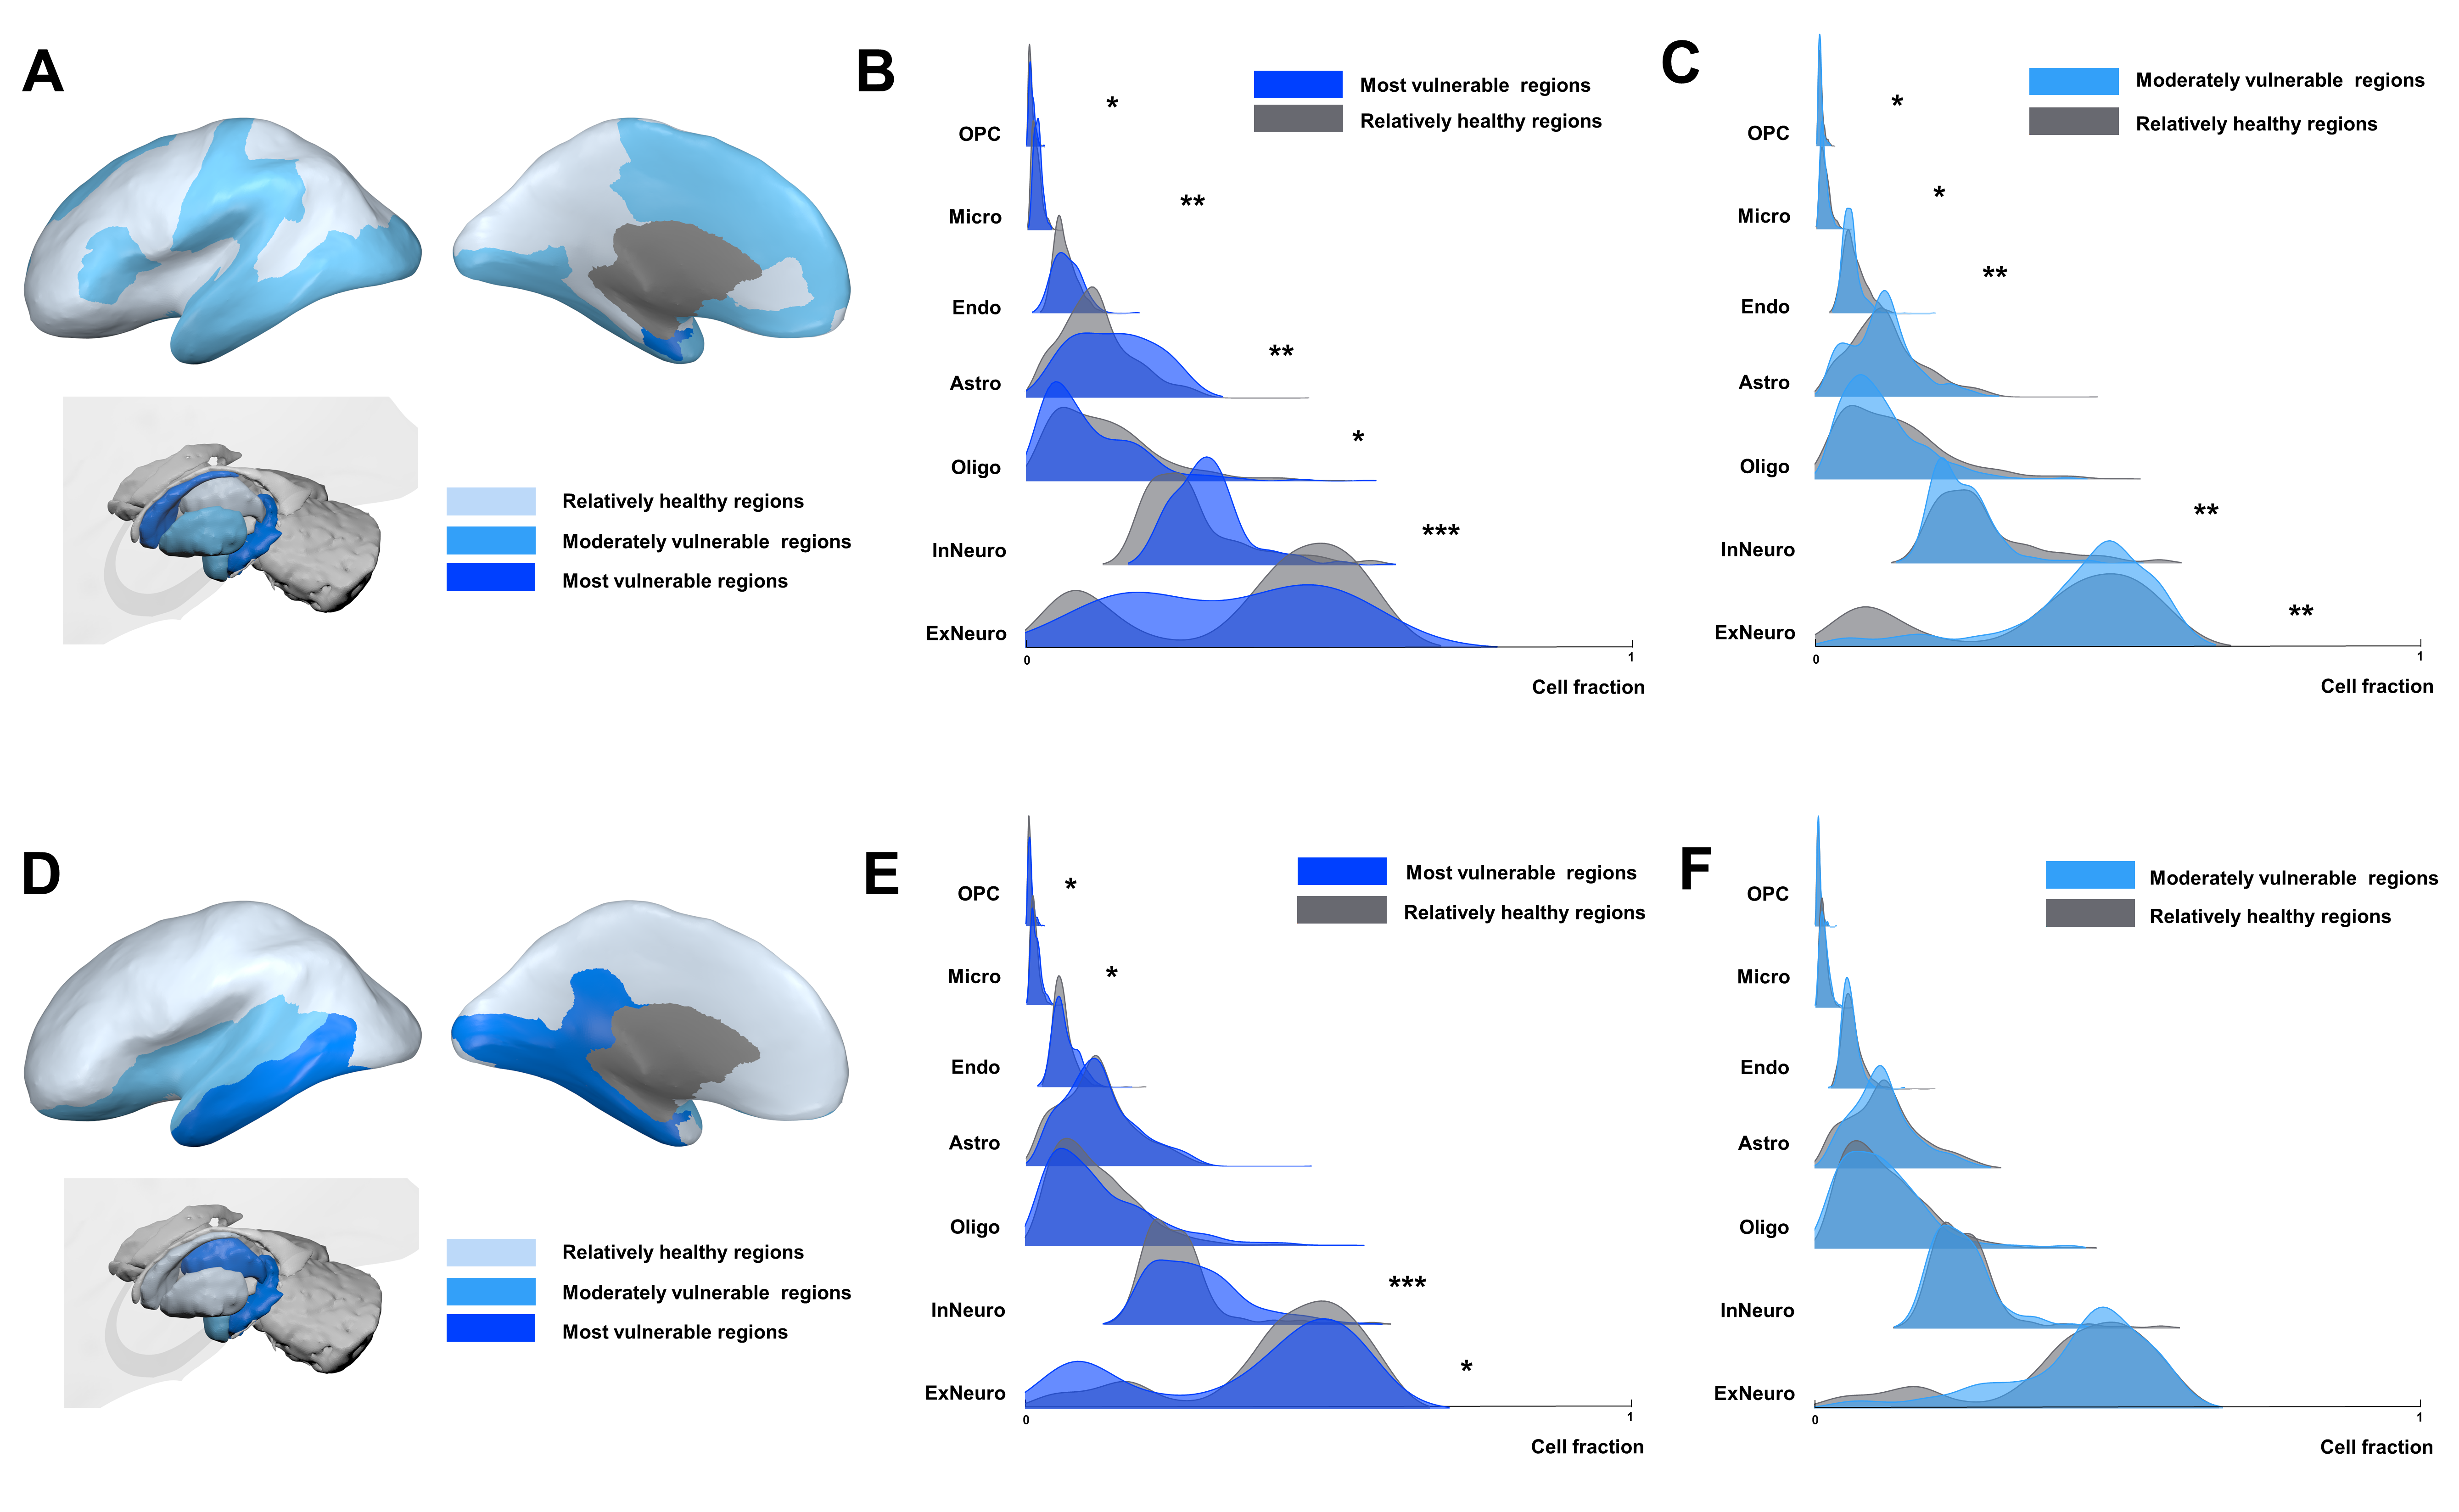
For differential cell-type analysis, we chose cell fractions of 3702 samples provided by Altmann A et al12 (https://github.com/andrealtmann/AHBA_Epilepsy/blob/master/data/celltype_deconvolution.txt). We excluded samples if they were not a designated cortical or subcortical sample or not mapped to our interested ROIs, or the closest ROI was more than 4 mm away. We used Mann-Whitney U test to compare vulnerable regions and relatively healthy regions to identify cell-types that were differently expressed.
Results
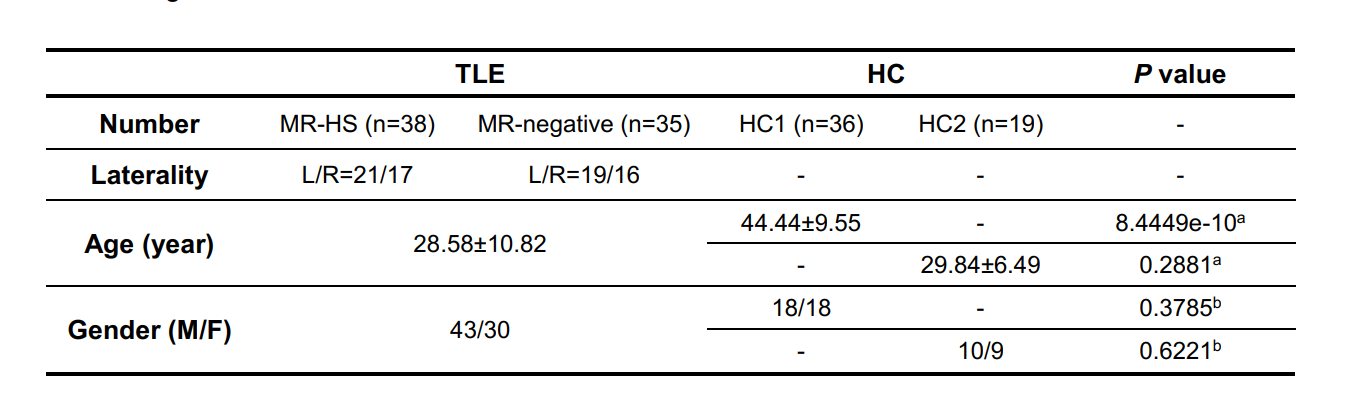
Participants demographics summarized in Table 1. In clinical evaluations, 38 patients were MR-HS and 35 patients were MR-negative. Atrophy was evaluated based on cortical thickness and subcortical volume changes between MR-HS, MR-negative TLE, and age- and gender-matched healthy control groups. Similarly, vulnerability to hypometabolism was evaluated based on FDG uptake. Remarkably, all regions found in MR-negative group were included in MR-HS groups. Hippocampus and entorhinal were identified as most vulnerable regions both in atrophy and in hypometabolism analysis (Figure 1 A, B).After data preprocessing, we generated the expression matrix that contained 20,265 genes from 1,765 samples. The number of DEGs were 311 in most vulnerable regions of atrophy, 16 in moderately vulnerable regions of atrophy, 60 in most vulnerable regions of hypometabolism and only 1 in moderately vulnerable regions of hypometabolism. We only performed enrichment analysis for the DEGs from the most vulnerable regions, significant terms are shown in Figure 2.
The differential cell-type analysis showed a consistent pattern in most vulnerable regions both to atrophy and hypometabolism. The significant difference cell-types, inhibitory neuron, microglia, astrocytes and oligodendrocyte precursor cells (OPC) were elevated while excitatory neuron and oligodendrocytes were decreased (Figure 3).
Conclusions
Hippocampus and entorhinal were found to be most vulnerable brain regions in both anatomical and metabolic changes in TLE patients. Transcriptomic analysis revealed common findings in neuroactive ligand-receptor interaction pathway, which is generally consistent with cellular component changes.Acknowledgements
N/AReferences
1. Engel J, Jr., McDermott MP, Wiebe S, et al. Early surgical therapy for drug-resistant temporal lobe epilepsy: a randomized trial. Jama. Mar 7 2012;307(9):922-30. doi:10.1001/jama.2012.220
2. Li J, Keller SS, Seidlitz J, et al. Cortical morphometric vulnerability to generalised epilepsy reflects chromosome- and cell type-specific transcriptomic signatures. Neuropathol Appl Neurobiol. Oct 24 2022:e12857. doi:10.1111/nan.12857
3. Chen Z, Fan B, Pang L, Wei M, Lv C, Zheng J. Longitudinal alterations of cortical structural-functional coupling in temporal lobe epilepsy. J Neuroimaging. Sep 9 2022;doi:10.1111/jon.13046
4. Larivière S, Royer J, Rodríguez-Cruces R, et al. Structural network alterations in focal and generalized epilepsy assessed in a worldwide ENIGMA study follow axes of epilepsy risk gene expression. Nat Commun. Jul 27 2022;13(1):4320. doi:10.1038/s41467-022-31730-5
5. Hawrylycz MJ, Lein ES, Guillozet-Bongaarts AL, et al. An anatomically comprehensive atlas of the adult human brain transcriptome. Nature. Sep 20 2012;489(7416):391-399. doi:10.1038/nature11405
6. Hawrylycz M, Miller JA, Menon V, et al. Canonical genetic signatures of the adult human brain. Nat Neurosci. Dec 2015;18(12):1832-44. doi:10.1038/nn.4171
7. Lamusuo S, Jutila L, Ylinen A, et al. [18F]FDG-PET reveals temporal hypometabolism in patients with temporal lobe epilepsy even when quantitative MRI and histopathological analysis show only mild hippocampal damage. Arch Neurol. Jun 2001;58(6):933-9. doi:10.1001/archneur.58.6.933
8. Pustina D, Avants B, Sperling M, et al. Predicting the laterality of temporal lobe epilepsy from PET, MRI, and DTI: A multimodal study. Neuroimage Clin. 2015;9:20-31. doi:10.1016/j.nicl.2015.07.010
9. Desikan RS, Ségonne F, Fischl B, et al. An automated labeling system for subdividing the human cerebral cortex on MRI scans into gyral based regions of interest. Neuroimage. Jul 1 2006;31(3):968-80. doi:10.1016/j.neuroimage.2006.01.021
10. Arnatkeviciute A, Fulcher BD, Fornito A. A practical guide to linking brain-wide gene expression and neuroimaging data. Neuroimage. Apr 1 2019;189:353-367. doi:10.1016/j.neuroimage.2019.01.011
11. Ritchie ME, Phipson B, Wu D, et al. limma powers differential expression analyses for RNA-sequencing and microarray studies. Nucleic Acids Res. Apr 20 2015;43(7):e47. doi:10.1093/nar/gkv007
12. Altmann A, Ryten M, Di Nunzio M, et al. A systems-level analysis highlights microglial activation as a modifying factor in common epilepsies. Neuropathol Appl Neurobiol. Feb 2022;48(1):e12758. doi:10.1111/nan.12758
Figures