1007
Quantitative Susceptibility of Subcortical Grey-Matter Regions in Early versus Refractory Focal Epilepsy1Florey Institute of Neuroscience and Mental Health, Melbourne, Australia, 2Department of Neurology, Austin Health, Melbourne, Australia, 3Division of Medicine, Dentistry and Health Sciences, University of Melbourne, Melbourne, Australia, 4Department of Neuropsychology, Austin Health, Melbourne, Australia
Synopsis
Keywords: Epilepsy, Quantitative Susceptibility mapping
Magnetic susceptibility of subcortical grey matter regions was assessed in participants of the Australian Epilepsy Project pilot study. Adults with medication-resistant focal epilepsy were compared to those with newly-diagnosed focal epilepsy, and to people with a single seizure but no epilepsy diagnosis. Basal ganglia, thalamus, hippocampi and amygdala showed susceptibility values consistent with published values, with a positive correlation to age seen at the basal ganglia. There was no significant difference in subcortical susceptibility between the groups. Although other brain network changes may progress with refractory seizures, mineralisation of subcortical regions appears generally stable over the course of focal epilepsy.Introduction
In focal epilepsy, seizures typically originate from diverse cortical regions but propagate to engage common subcortical structures. Subcortical pathological changes are commonly seen, for example with thalamic volume loss1 and excitotoxic neuronal injury2, seen in large-scale imaging studies and preclinical histopathology respectively.Beyond focal haemorrhage and specific iron deposition disorders which are known to cause seizures3, recent work has suggested that abnormal iron metabolism may play a role in epilepsy more generally4. Decreases in iron at subcortical structures5 and altered susceptibility at the hippocampus6 have been reported in established mesial temporal lobe epilepsy compared to controls. In contrast, assessment of focal cortical dysplasia in children showed cortical susceptibility changes but only age-related effects at deep brain nuclei7.
Here we examined quantitative susceptibility at subcortical structures in a diverse cohort of adult focal epilepsy, considering both early and established disease, to ask whether progressive changes in subcortical mineral deposition are a common feature.
Methods
Participants were recruited through the Australian Epilepsy Project pilot study (www.epilepsyproject.org.au), under the following categories, based on a Neurologist clinical diagnosis:(i) A single First Unprovoked Seizure (FUS) but with no diagnosis of epilepsy, (ii) New Diagnosis of Epilepsy (NDE) made in the last 6 months, or (iii) Pharmaco-resistant Focal Epilepsy (PFE), defined as ongoing seizures despite an adequate trial of 2 appropriate antiseizure medications8. Participants were adults aged 18 to 65, had no contraindications to MRI, and could complete surveys/interviews in English. For this analysis we excluded participants with a diagnosis of generalized epilepsy, and those with prior anterior temporal lobectomy surgery.MRI was performed on a Siemens Prisma-fit 3T scanner. Multi-echo 3D Gradient Echo images were acquired with 5 echoes, TE1/TE/TR=5.84/4.79/30ms, 1.2mm3 voxels, FOV 230x187x144mm, flip angle 15, bandwidth 310Hz/px, GRAPPA 3, elliptical scanning and flow compensation on. Acquisition time was 3:39 min. Magnitude and phase images were reconstructed online using adaptive coil combine. Structural imaging included a 3D T1-weighted MPRAGE (TE/TI/TR=2.19/1000/1900ms, 0.9mm3 voxels, flip angle 8, bandwidth 220Hz/px, GRAPPA 2, FOV 230x230x173mm) and 3D T2-weighted SPACE (TE/TR=564/3200ms with variable flip angle, 0.9mm3 voxels, bandwidth 751Hz/px, GRAPPA 2, FOV 230x230x173mm, turbo factor 314).
Quantitative susceptibility maps (QSM) were calculated from the multi-echo GRE data using the MEDI+0 algorithm9. Subcortical regions-of-interest were segmented jointly from the T1- and T2-weighted images using FreeSurfer version 6, with amygdala and hippocampi segmented using the subfields module10. Susceptibility maps were aligned to the T1w-images by rigid registration of the first gradient echo magnitude image, using ANTs software11. Mean susceptibility values were extracted from each ROI, and compared between groups using a linear model (lm in R software), with participant age, gender and acquisition head coil as covariates. Hypothesis testing used the multcomp package.
Results
A total of 131 participants were included: (i) 24 FUS (11 female, median age 31.2y, range 18-62y), (ii) 39 NDE (20 female, median age 40.4y, range 18-61y), (iii) 68 PFE (43 female, median age 32.5y, range 18-62y).Neuroradiologist reporting of structural images identified a potentially epileptogenic lesion in 17% FUS cases, 39% NDE and 54% PFE, with a diversity of pathologies and localisation.
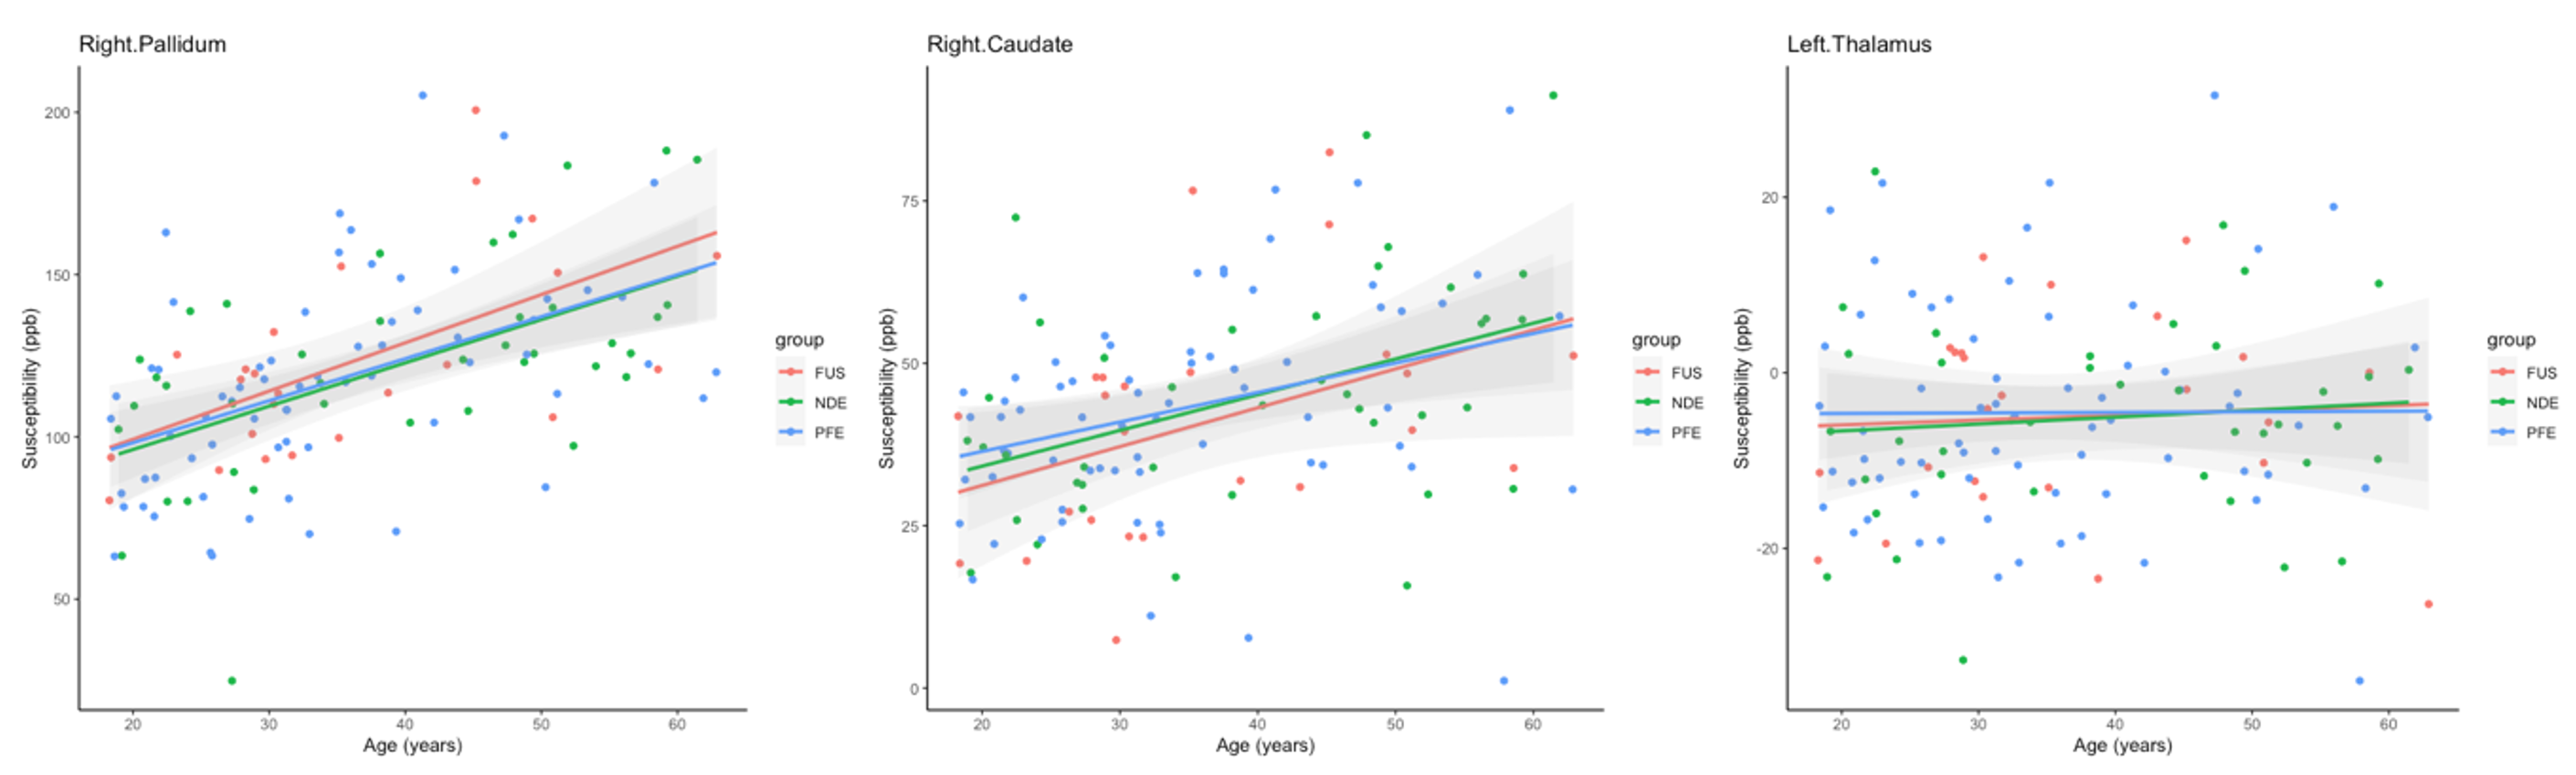
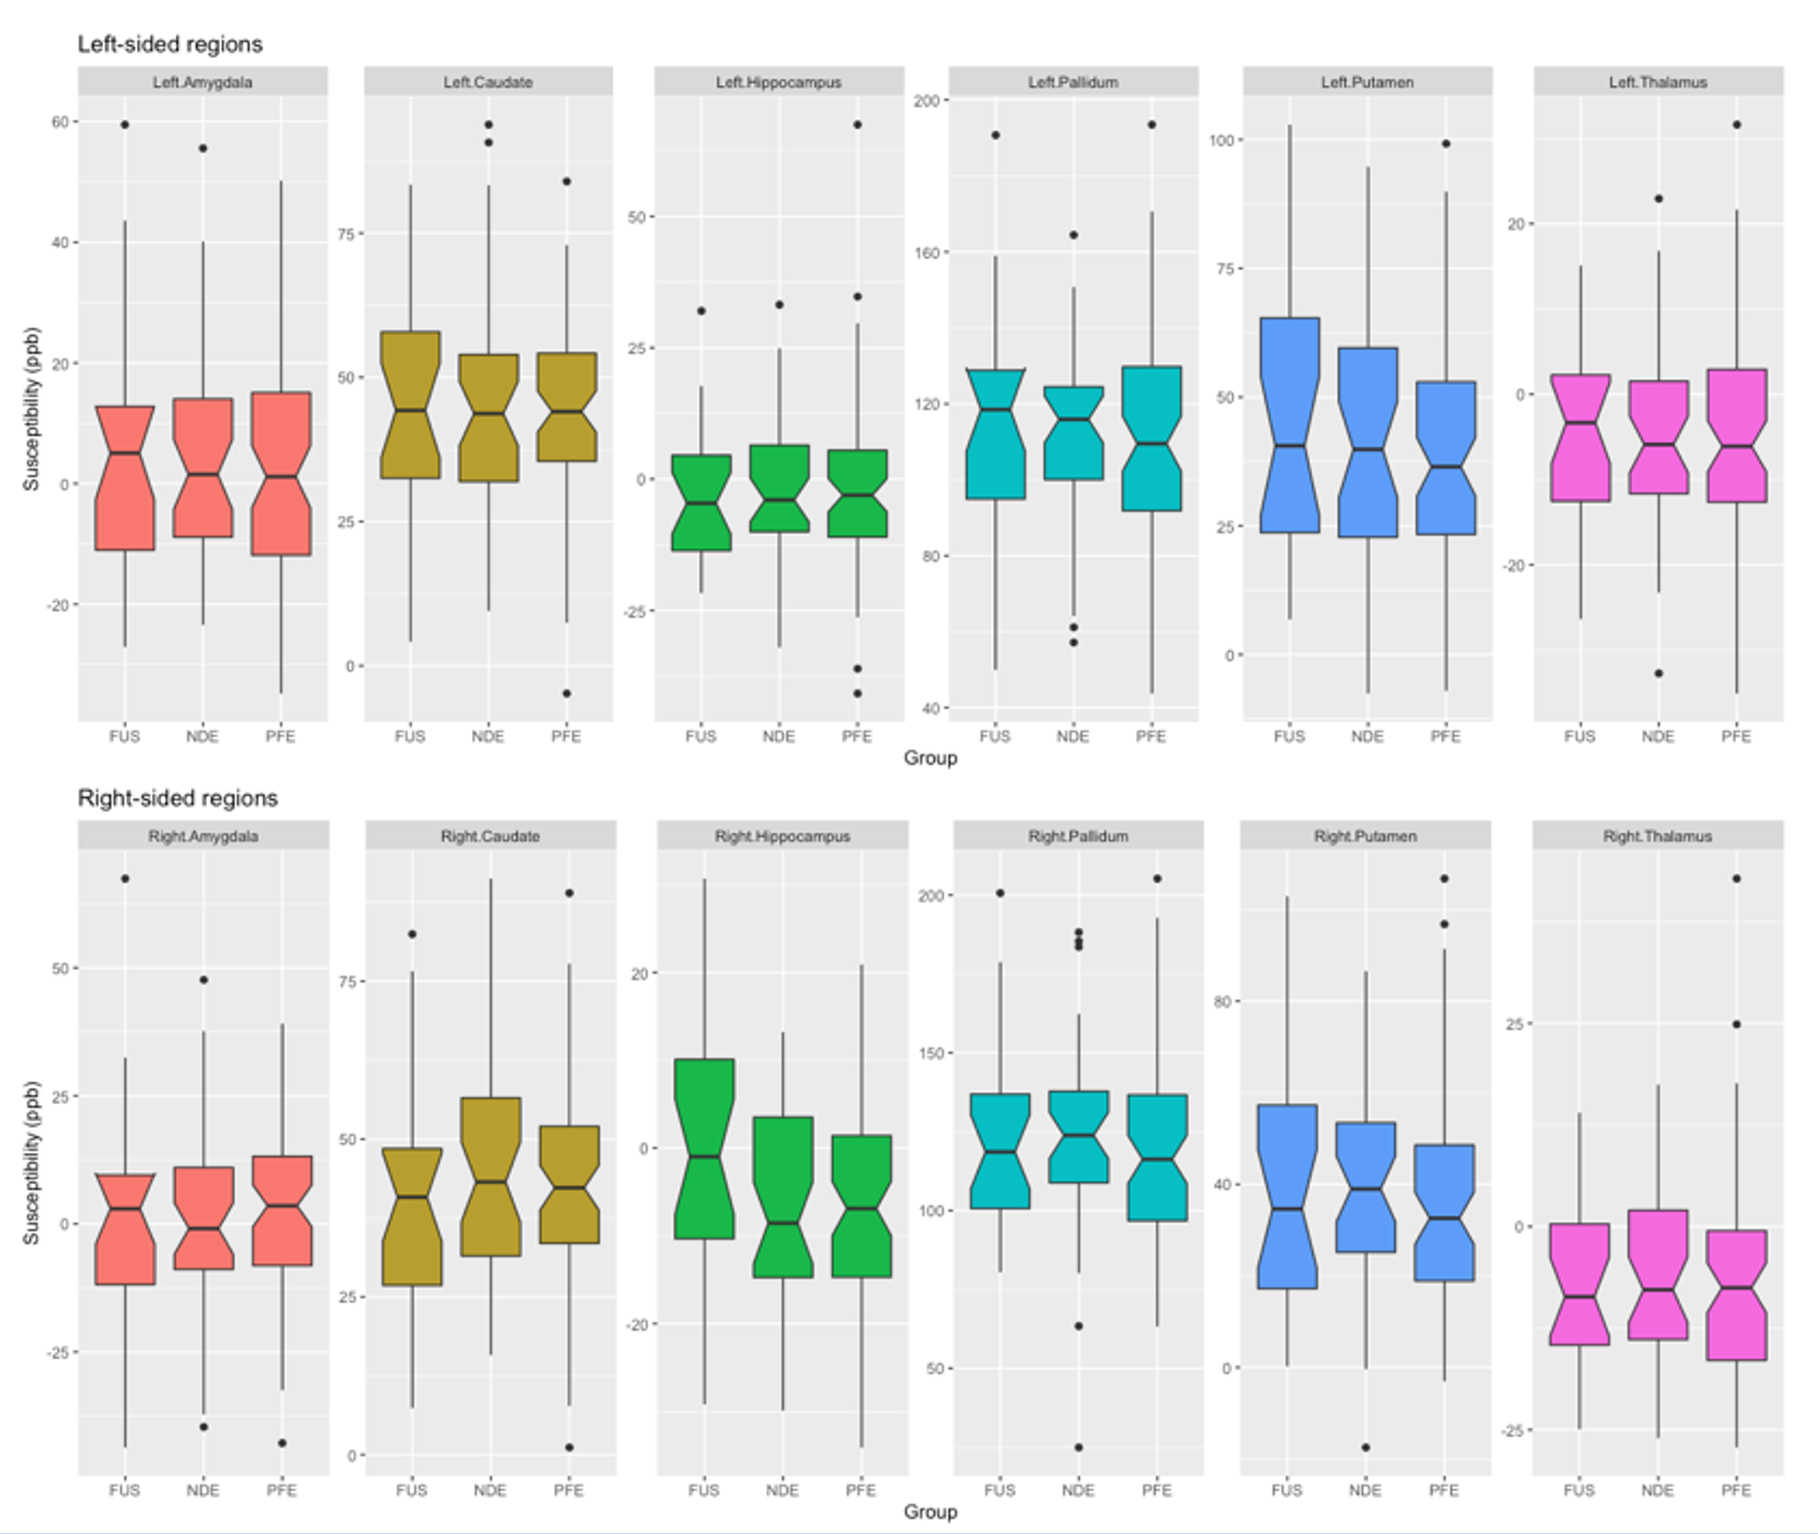
Mean susceptibility values at each subcortical region (Fig1) were similar to published values in healthy controls12. Susceptibility showed the expected positive correlation with age at the caudate, globus pallidus and putamen bilaterally (all p<0.05 corrected, Fig2). There was no significant difference between epilepsy groups in susceptibility value at any region tested (Fig3). Neither did left-right asymmetry of susceptibility values did not differ between groups.
Conclusions
We found no apparent difference in quantitative susceptibility at subcortical grey matter regions between people with a single seizure (and no epilepsy diagnosis) compared to people with a new diagnosis of focal epilepsy and those with long-standing drug-resistant focal epilepsy. Although other brain network changes may progress with refractory seizures, mineralisation of subcortical regions appears generally stable over the course of focal epilepsy in this diverse cohort.Acknowledgements
The Australian Epilepsy Project receives funding from the Australian Government under the Medical Research Future Fund. We acknowledge the facilities and scientific and technical assistance of the National Imaging Facility, a National Collaborative Research Infrastructure Strategy (NCRIS) capability. We also acknowledge funding from the Victorian Government Operational Infrastructure Support Grant, and support from the Victorian Biomedical Imaging Capability (VBIC), and the MASSIVE high-performance computing facility.References
1. Whelan CD, Altmann A, Botía JA, et al. Structural brain abnormalities in the common epilepsies assessed in a worldwide ENIGMA study. Brain. 2018;141:391–408.
2. Collins RC, Olney JW. Focal Cortical Seizures Cause Distant Thalamic Lesions. Science. American Association for the Advancement of Science; 1982;218:177–179.
3. Emamikhah M, Saiyarsarai P, Schneider SA, Fasano A, Mohammadzadeh N, Rohani M. Seizure in Neurodegeneration with Brain Iron Accumulation: A Systematic Review. Can J Neurol Sci. Cambridge University Press; Epub 2022 Jan 24.:1–12.
4. Chen S, Chen Y, Zhang Y, et al. Iron Metabolism and Ferroptosis in Epilepsy. Front Neurosci. 2020;14:601193.
5. Zhang Z, Liao W, Bernhardt B, et al. Brain iron redistribution in mesial temporal lobe epilepsy: a susceptibility-weighted magnetic resonance imaging study. BMC Neurosci. 2014;15:117.
6. Kiersnowski OC, Winston GP, Biondetti E, et al. Quantitative Susceptibility Mapping (QSM) is Sensitive to Hippocampal and Subcortical Gray Matter Changes in Temporal Lobe Epilepsy. :3.
7. Lorio S, Sedlacik J, So P-W, et al. Quantitative MRI susceptibility mapping reveals cortical signatures of changes in iron, calcium and zinc in malformations of cortical development in children with drug-resistant epilepsy. Neuroimage. 2021;238:118102.
8. Téllez-Zenteno JF, Hernández-Ronquillo L, Buckley S, Zahagun R, Rizvi S. A validation of the new definition of drug-resistant epilepsy by the International League Against Epilepsy. Epilepsia. 2014;55:829–834.
9. Liu Z, Spincemaille P, Yao Y, Zhang Y, Wang Y. MEDI+0: Morphology enabled dipole inversion with automatic uniform cerebrospinal fluid zero reference for quantitative susceptibility mapping. Magn Reson Med. 2018;79:2795–2803.
10. Sämann PG, Iglesias JE, Gutman B, et al. FreeSurfer‐based segmentation of hippocampal subfields: A review of methods and applications, with a novel quality control procedure for ENIGMA studies and other collaborative efforts. Hum Brain Mapp. 2020;43:207–233.
11. Avants BB, Tustison NJ, Song G, Cook PA, Klein A, Gee JC. A reproducible evaluation of ANTs similarity metric performance in brain image registration. NeuroImage. 2011;54:2033–2044.
12. Treit S, Naji N, Seres P, et al. R2* and quantitative susceptibility mapping in deep gray matter of 498 healthy controls from 5 to 90 years. Hum Brain Mapp. 2021;42:4597–4610.
Figures
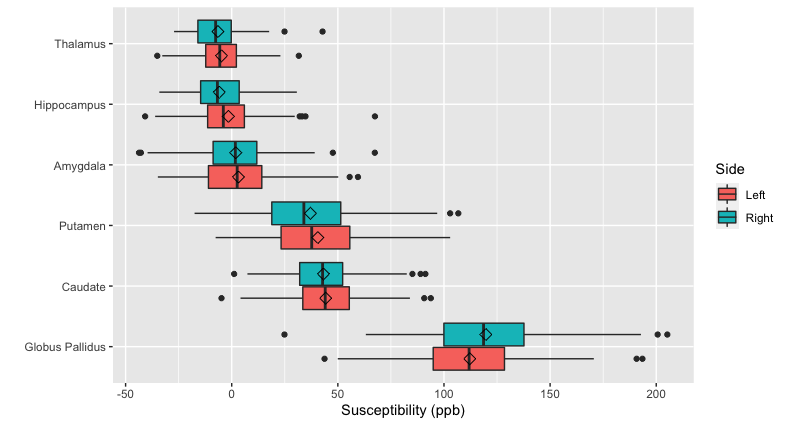
Figure 1: Susceptibility at subcortical regions examined across all participants.
Diamond indicates the mean. Data is adjusted for age, gender and the head coil used for acquisition.