1006
Direct visualization and automatic segmentation of the centromedian nucleus for epilepsy deep brain stimulation1Radiology, UMass Chan Medical School, Worcester, MA, United States, 2Neurology, University of Texas Health Science Center, Houston, TX, United States
Synopsis
Keywords: Epilepsy, Segmentation, Deep brain stimulation targeting
We present a patient-specific segmentation method for targeting the centromedian nucleus for epilepsy deep brain stimulation and compare it to an atlas-based indirect targeting method in 8 patients.Introduction
Deep brain stimulation (DBS) of specific thalamic nuclei such as the centromedian (CM) thalamic nucleus [1] has been shown to be promising in treatment for drug-resistant epilepsies. However the CM nucleus is almost invisible [2] in conventional T1 and T2 imaging necessitating the use of indirect targeting using atlases, making it prone to errors. In this work, we investigated a recently developed multi-atlas based thalamic nuclei segmentation scheme for automatic segmentation of CM nucleus in epilepsy DBS patients.We compared patient-specific direct segmentation results with that of atlas-based indirect targeting.Methods
Thalamus-optimized multi atlas segmentation (THOMAS) [3] has been recently developed for fast automated segmentation of thalamic nuclei from white-matter nulled (WMn) MPRAGE data where the thalamus boundaries as well as intra-thalamic borders are much better delineated than conventional MPRAGE. While THOMAS was originally demonstrated at 7T, in this work, we segmented pre-operative 3T WMn (FGATIR) data using THOMAS to generate 11 nuclei per hemisphere including CM. A total of 8 patients who underwent DBS of the CM nucleus for treatment of epilepsy were analyzed.Pre-operative MRI data and post-operative CT data were analyzed using leaddbs [4]. The standard leaddbs pipeline included registration of pre-op WMn and T1 and thence to MNI space, reconstruction of electrodes from post-op CT data, and the visualization of the electrodes in MNI space. Patient-specific CM segmentations obtained from THOMAS applied to pre-op WMn data were also warped to MNI space using the same transformation applied to T1/WMn images. For qualitative visualization, patient-specific CM segmentation were compared with those generated using the Morel and Thomas atlases (part of the leaddbs distribution). To quantify the accuracy of patient-specific segmentation vs. atlas-based method, the distance between the active contact to the center of mass of the CM nuclei for each case (i.e. THOMAS segmentation, Morel, and Thomas atlas) was computed. A leadgroup analysis was also conducted to visualize all the leads from all patients in MNI space.
Results
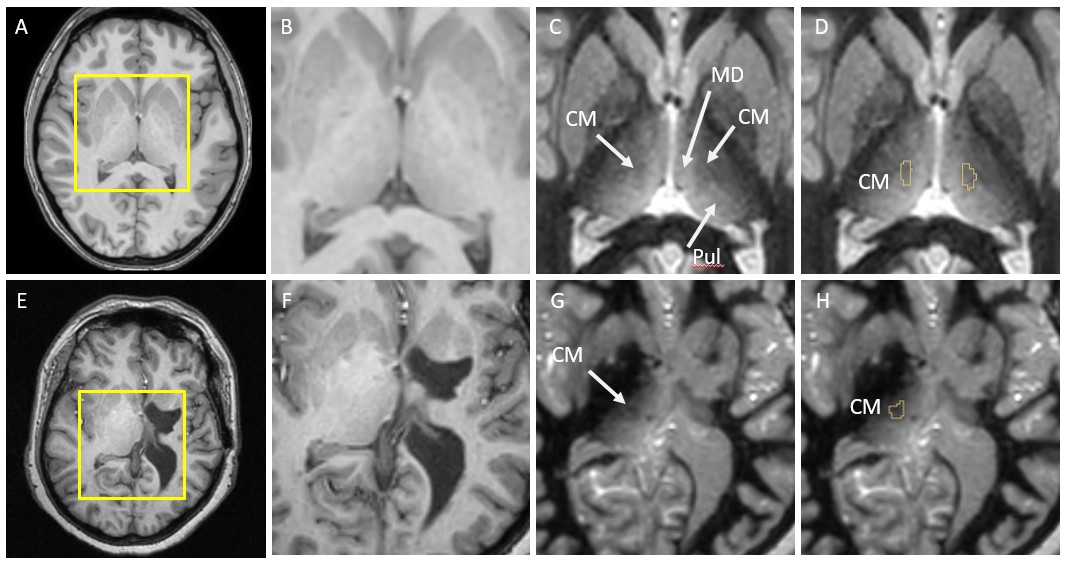
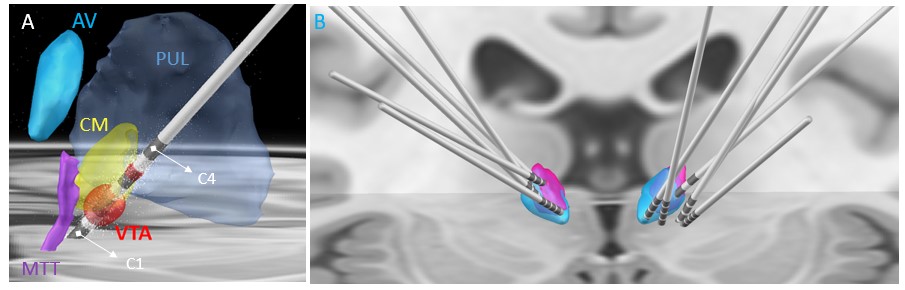
Figure 1 shows the comparison of standard T1 data (B,F) vs. WMn FGATIR data (C,G) on two patients. The second patient (lower panel) shows clear structural brain abnormalities. Note the clear visualization of the CM nucleus as a hypointense triangular notch between the MD and Pul nuclei in WMn compared to T1. THOMAS segmentation of the CM nucleus overlaid on WMn is shown in the rightmost panels (D,H). THOMAS is able to segment the CM nucleus accurately even in cases of significant morphological distortions (lower panel).Figure 2A shows post-surgical CT reconstruction of a typical lead along with relevant thalamic nuclei (defined using the Morel atlas). The trajectory can be seen entering through ventral posterior lateral (VPL) level with contacts 2 and 3 inside the CM nucleus and the most inferior contact outside the CM, likely at the Pf interface. The Anteroventral (AV) and Pulvinar nuclei and the mammillothalamic tract (MTT) are also shown for reference. Figure 2B shows bilateral lead reconstructions for all patients shown relative to CM from the Morel atlas (magenta) and THOMAS atlas (cyan).
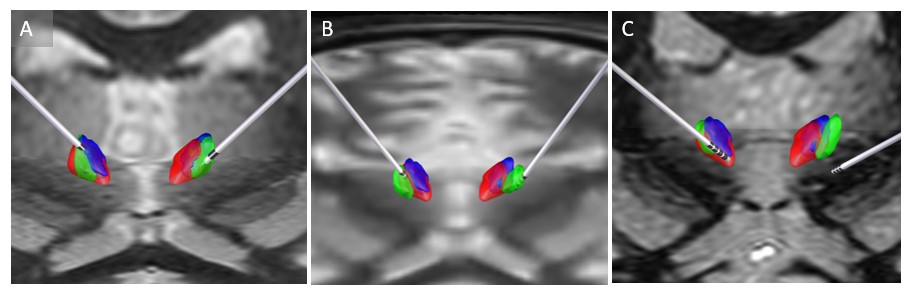
Figure 3 shows bilateral lead reconstruction for three individual cases (2 responders and 1 non-responder) with differing levels of agreement between the two atlases (red, violet) and patient-specific segmentation (green). In the first patient (A), there is good agreement with the three methods and this was also corroborated clinically based on patient response. In the second patient (B), the lead appears to be completely outside atlas-based CMs. The patient-specific segmentation (green) is, however, able to accurately capture the CM location and this was also corroborated clinically based on the response. In the third non-responder patient (C), the lead is outside both the atlas-based CMs and patient-specific CM. The mean distance between the center of mass of CM and active contact was 1 mm, 1.86 mm, and 1.31 mm for the patient-specific targeting, Morel atlas and Thomas atlas targeting respectively for the responders. For the non-responder, this was 8.1mm. 8.1mm and 7.1mm respectively
Conclusion
To our knowledge, this is the first work demonstrating the use of a fully automated method for segmentation of the CM nucleus for epilepsy DBS. Previous work have used Sobel edge-enhancement of MP2RAGE images [2] or used an edge enhanced MPRAGE acquisition [5] for better visualization of CM. However, these acquisitions are also not very common on clinical 3T MRI scanners and require subsequent manual segmentation. We used the WMn FGATIR sequence which is becoming part of most clinical DBS protocols to generate patient-specific automated CM segmentation using THOMAS. This direct patient-specific segmentation was significantly more accurate than the indirect atlas based method making it promising for use prospectively in future DBS targeting studies.Acknowledgements
No acknowledgement found.References
1. Ilyas A, Tandon N, Lhatoo SD. Thalamic neuromodulation for epilepsy: A clinical perspective. Epilepsy Res. 2022 Jul;183:106942.
2. Warren AEL et al.
Targeting the centromedian thalamic nucleus for deep brain stimulation. J
Neurol Neurosurg Psychiatry. 2020 Apr;91(4):339-349
3. Su JH et al.
Thalamus Optimized Multi Atlas Segmentation (THOMAS): Fast, fully
automated segmentation of thalamic nuclei from structural MRI.
Neuroimage. 2019 Jul 1;194:272-282
4. Andreas
Horn, Andrea Kühn. Lead-DBS: A toolbox for deep brain stimulation
electrode localizations and visualizations. NeuroImage, 2014.
5. Middlebrooks EH et al.
Edge-enhancing gradient echo with multi-image co-registration and
averaging (EDGE-MICRA) for targeting thalamic centromedian and
parafascicular nuclei. Neuroradiol J. 2021 Dec;34(6):667-675.
Figures