1004
Can fMRI metrics lateralize epileptogenic hypometabolic FDG-PET regions? A simultaneous PET/MR investigation in focal epilepsy1School for Mental Health and Neuroscience, Maastricht University, Maastricht, Netherlands, 2Department of Radiology & Nuclear Medicine, Maastricht University Medical Centre, Maastricht, Netherlands, 3Department of Neurosurgery, Maastricht University Medical Centre, Maastricht, Netherlands, 4Academic Centre for Epileptology, Kempenhaeghe/Maastricht University Medical Centre, Maastricht, Netherlands, 5Department of Electrical Engineering, Eindhoven University of Technology, Eindhoven, Netherlands
Synopsis
Keywords: Epilepsy, PET/MR
Locally reduced glucose metabolism (i.e. hypometabolism) derived from the 18-FDG positron emission tomography (FDG-PET) is considered to be a valuable biomarker for epileptogenic zone localization. Spontaneous fluctuations in blood-oxygen-level-dependent fMRI (BOLD fMRI) can indirectly measure neuronal activity. Studies have suggested that the fMRI-derived metrics may be indicative of the epileptogenic zone localization, however the potential for fMRI to reflect and lateralize the hypometabolic FDG-PET regions remains underdetermined. Here, both static and dynamic fMRI-derived metrics were calculated and we assessed their potential for lateralizing the hypometabolic FDG-PET regions in patients with unilateral focal epilepsy.Introduction
Focal epilepsy is a chronic neurological disorder that is characterized by recurring seizures which are caused by localized, spontaneous abnormal neuronal activity1. Locally reduced uptake of glucose (i.e. hypometabolism) derived from the 18-FDG positron emission tomography (FDG-PET) is considered to be a valuable biomarker for epileptogenic zone localization2. Blood-oxygen-level-dependent resting-state fMRI (BOLD fMRI) can indirectly measure neuronal activity and both glucose metabolism and the BOLD effect are closely related to the neurovascular coupling phenomenon3. Simultaneous acquisition of both FDG-PET and BOLD fMRI may provide a unique insight into the metabolic alterations in focal epilepsy patients. Previously, abnormal glucose uptake and spontaneous BOLD activity in epilepsy subjects were shown to correlate4, however, the potential value of fMRI as a tool for epileptogenic zone lateralization remains underdetermined. In this study, both static4 and dynamic5 fMRI-derived metrics were determined and compared with the lateralization of the hypometabolic FDG-PET regions in patients with unilateral focal epilepsy.Methods
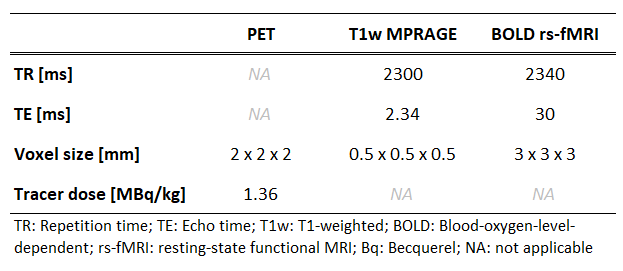
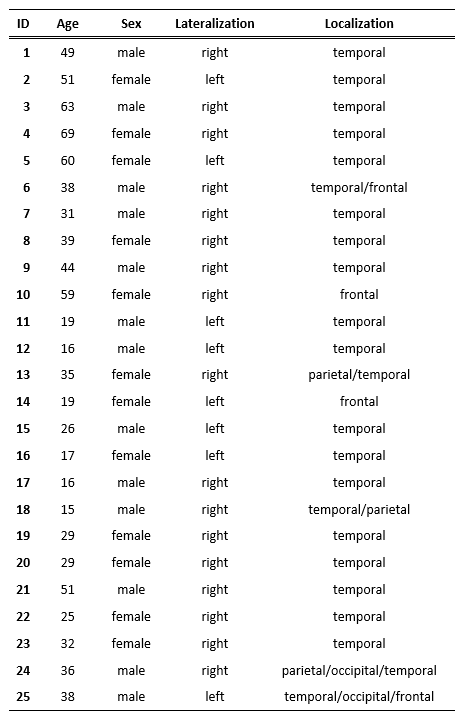
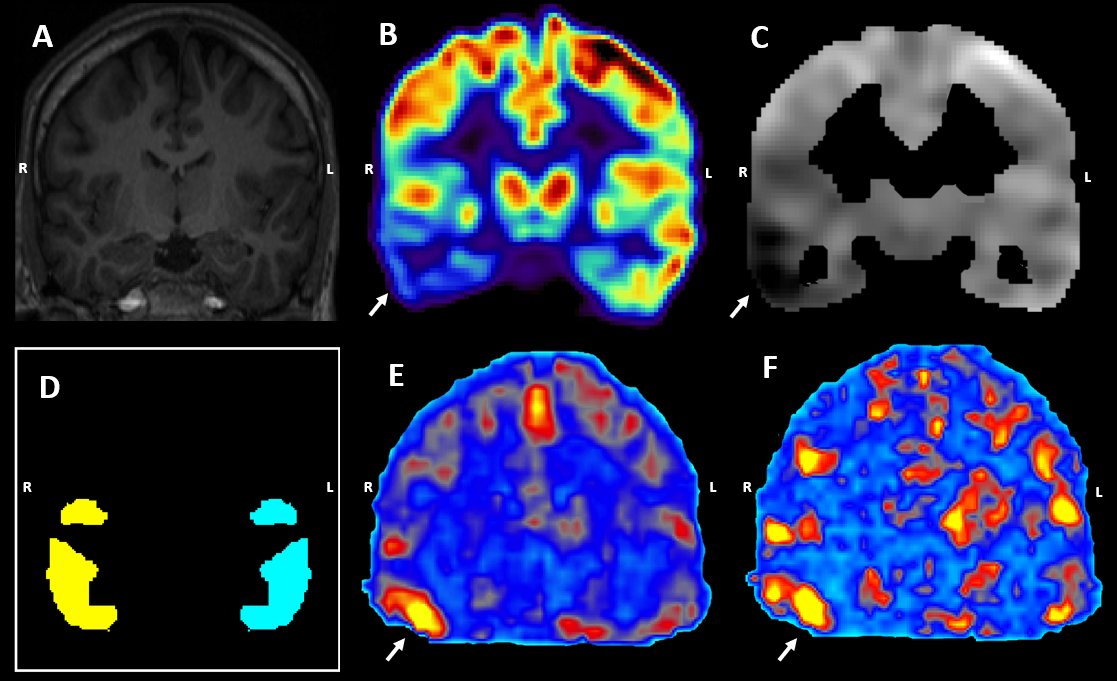
Scanning protocol and study populationTwenty-five patients (36.2±16.1y; 12 females) with unilateral focal epilepsy were scanned on a 3T PET/MR scanner (Siemens Biograph mMR, Siemens Healthcare). The acquired scans were MPRAGE, BOLD rs-fMRI using a single-shot echo planar imaging (EPI) sequence, and FDG-PET (dose 2 MBq/kg of body weight) (Figure 1B). Image acquisition parameters can be found in Table 1. The selected subjects were diagnosed with a predominantly unilateral metabolic abnormality on the FDG-PET images by radiologists specialized in nuclear medicine (Table 2).
Image preprocessing
The rs-fMRI was corrected for the EPI distortion (“topup”), slice-timing, and head motion using the RESTPlus toolbox6. The FDG-PET and fMRI images were linearly coregistered to a symmetrical template (1 x 1 x 1mm) using the MIM Vista7 and FSL’s FLIRT8.
The FDG-PET images were compared to a clinical control database7 (43 subjects; 63.8±9.9y; 19 females) to obtain a z-score map where a strongly negative z-score reflects hypometabolism (Figure 1C). The z-score map of the hypometabolically predominant hemisphere was thresholded at z=-2 to produce the unilateral binary mask of the abnormal regions (Figure 1D). The hypometabolic region size was 39.1±24.4 cm3.
rs-fMRI metrics
Both static and dynamic regional homogeneity (ReHo; dReHo), Amplitude and Fractional Amplitude of Low-Frequency Fluctuations (ALFF; dALFF and fALFF; dfALFF) were calculated from the preprocessed rs-fMRI data using previously established algorithms6. ReHo was calculated within a 27-voxel neighborhood and both ALFF and fALFF were obtained from a 0.01-0.1Hz frequency bandwidth5. The dynamic metrics were calculated in a temporally-sliding window sized 100 dynamics with an overlap of 1 dynamic5. The standard deviation (SD) and coefficient of variance (CoV=SD/mean) were calculated along the time axis to produce the dynamic maps.
Evaluation
From the obtained hypometabolic masks, the mean z-score values were calculated for both the ipsi and contralateral areas. Asymmetry indices (AI) were calculated from the obtained values in the FDG-PET image and each fMRI metric using the following equation:
\[AI=\frac{ipsilateral - contralateral}{ipsilateral + contralateral}\]
The asymmetry indices were statistically compared against zero using a (two-sided) one-sample t-test to evaluate whether the fMRI metrics capture the information about the hypometabolic zones. Furthermore, Pearson correlation coefficients between the metrics’ AI were calculated to further quantify the similarity of the acquired information. Next to the hypometabolic regions, ‘normal-appearing’ metabolic regions were selected where the AI in the FDG-PET images was close to zero (i.e. -0.2<z<0.2). If the fMRI metrics provide similar information, we expect them to be close to zero as well.
Results
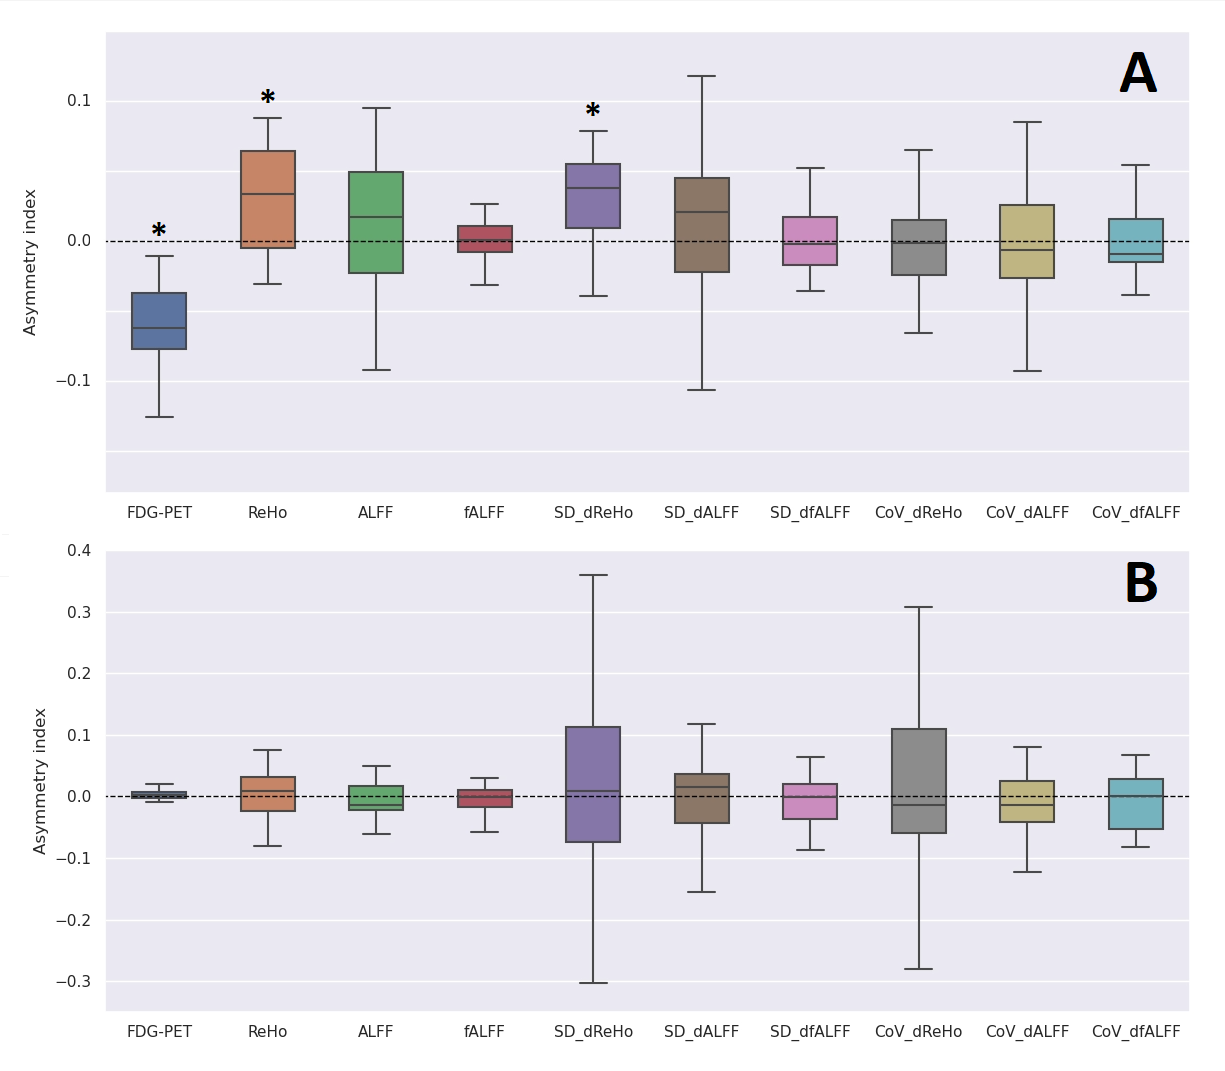
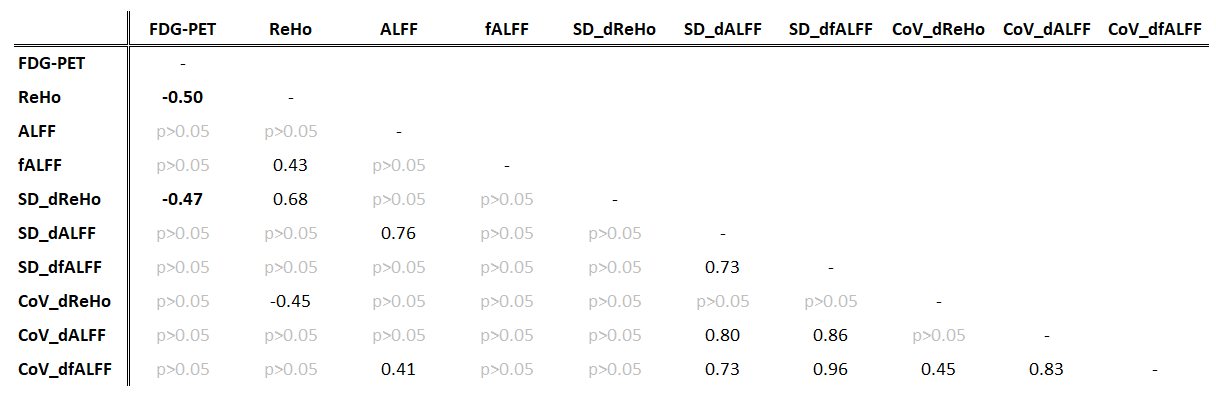
By design, the FDG-PET asymmetry index was significantly smaller than zero (p<0.01, Figure 2A). On average, the fMRI metrics were larger than zero, reaching significance for the static and dynamic ReHo (p<0.01; and p<0.01, respectively) (Figure 2A). The Spearman correlation coefficients between the FDG-PET and the fMRI metrics were found to be significant for the static and dynamic ReHo as well (r=-0.50, p<0.05; r=-0.47, p<0.05) (Table 3). A significant correlation was observed between the static and dynamic ReHo themselves (r=0.68, p<0.05) (Table 3, Figure 1E,1F). The asymmetry indices calculated in the control regions yielded no significant differences for all metrics (Figure 2B).Discussion
In this study, we evaluated static and dynamic rs-fMRI metrics as potential indicators of lateralizing the suspected epileptogenic abnormalities derived from FDG-PET. The fMRI indices showed an overall increase with static and dynamic ReHo reaching significance. These findings are in line with previous studies which report increased fMRI-metric values in potential epileptogenic regions4. A possible neurobiological explanation may be the lack of inhibitory mechanisms in epilepsy which could allow the epileptogenic tissue to get activated in a more locally synchronous manner and thus yield increased ReHo. The statistically significant correlation between the AI from static and dynamic ReHo suggests that the information contained could be similar (Figure 1E, 1F). The significant correlation coefficients between AI from PET and ReHo along with the lack of significant findings in the control regions further indicate that the fMRI metrics may be sensitive to metabolic abnormalities specifically.Conclusion
ReHo is suggested to be related to glucose metabolism and the evaluation showed that the static measures may be sufficient to match the hypometabolic activity. Our results further encourage more research toward establishing fMRI-derived metrics as a tool for epileptogenic zone lateralization and potential localization.Acknowledgements
This project was funded by the Dutch Epilepsy Foundation, grant no. 20-09References
1. Sarikaya I. 2015. "PET studies in epilepsy." Am J Nucl Med Mol Imaging. 5(5):416-30. PMID: 26550535; PMCID: PMC4620171.
2. Aiello M. et al. 2015 "Relationship between simultaneously acquired resting-state regional cerebral glucose metabolism and functional MRI: a PET/MR hybrid scanner study." Neuroimage 113: 111-121. doi: https://doi.org/10.1016/j.neuroimage.2015.03.017
3. Wang J. et al. 2020 "Altered coupling between resting‐state glucose metabolism and functional activity in epilepsy." Annals of Clinical and Translational Neurology 7.10: 1831-1842. doi: https://doi.org/10.1002/acn3.51168
4. Chen Z. et al. 2017. "The value of resting-state functional magnetic resonance imaging for detecting epileptogenic zones in patients with focal epilepsy." PLoS One 12.2: e0172094.doi: https://doi.org/10.1371/journal.pone.0172094
5. Song C. et al. 2022. "More than just statics: Static and temporal dynamic changes in intrinsic brain activity in unilateral temporal lobe epilepsy." Frontiers in Human Neuroscience 16. doi: doi.org/10.3389/fnhum.2022.971062
6. X.-Z. Jia, et al. 2019. "RESTplus: an improved toolkit for resting-state functional magnetic resonance imaging data processing." Science Bulletin. 64, 953–954 (2019). doi: 10.1016/j.scib.2019.05.008
7. MIM Vista, MIM Software inc., 2000, https://www.mimsoftware.com/about/MIM
8. Jenkinson M. et al. 2002. "Improved optimization for the robust and accurate linear registration and motion correction of brain images." Neuroimage 17.2: 825-841. doi: 10.1006/nimg.2002.1132
Figures