1003
Combined 18F-FDG PET/DTI reveals concurrent more extensive brain damage in mesial temporal lobe epilepsy1Radiology, Stony Brook Medicine, Stony Brook, NY, United States, 2Biomedical Engineering, Stony Brook University, Stony Brook, NY, United States, 3School of Biomedical Engineering, Shanghai Jiao Tong University, Shanghai, China, 4Department of Nuclear Medicine, Ruijin Hospital, Shanghai, China
Synopsis
Keywords: Epilepsy, Epilepsy
Mesial temporal lobe epilepsy is the most common type of drug-resistant epilepsy, with hippocampus sclerosis (HS) being its most common pathology. Anterior temporal lobectomy is the most common surgical strategy for these patients, many still suffer from seizures post-surgery, which may relate to their extensive brain network damage. 18F-FDG-PET is sensitive to metabolic changes in the epileptogenic zone. DTI can assess the integrity of white-matter tracts. In this study, we investigated the changes in glucose uptake, white-matter tracts, and their differences in brain networks of MR-HS versus MR-negative patients using simultaneous PET/MR, and studied if these changes coincide topographically.Introduction
Mesial temporal lobe epilepsy (MTLE) is the most common type of drug-resistant epilepsy, with hippocampus sclerosis (HS) being its most common pathology[1]. Although anterior temporal lobectomy is the most common surgical strategy for these patients, many still suffer from seizures post-surgery [2], which may relate to their extensive brain network damage. 18F-FDG-PET is very sensitive to metabolic changes in the epileptogenic zone (EZ) [3], which typically captures hypometabolism larger than the presumed EZ and sometimes extends to remote extratemporal regions[4]. DTI has been widely used to assess the integrity of WM tracts [5]. DTI findings in MTLE include decreased fractional anisotropy (FA) and increased mean diffusivity (MD) in the temporal lobe and extratemporal network of WM structures[6]. It is unclear whether the WM diffusivity changes topographically coincide with cortical hypometabolism observed in 18F-FDG-PET in MR-HS and MR-negative patients [7]. In this study, we investigated the changes in glucose uptake, white matter tracts, and their differences in brain networks of MR-HS versus MR-negative patients using simultaneous PET/MR.Method
Data acquisitionIn this IRB-approved study, we recruited 55 drug-refractory unilateral MTLE patients (age³18; we excluded 4 bilateral MR-HS patients and 6 patients with other lesions such as tumors), one of these subjects were further excluded due to low image quality. All subjects were scanned on a hybrid PET/MR scanner (Biograph mMR VE11P; Siemens Healthcare, Erlangen, Germany). The PET images were obtained around 45 minutes post a bolus injection of 18F-FDG (mean dose of 3.7 MBq/kg, matrix size = 344 × 344, voxel size = 2.0 × 2.0 × 2.0 mm3, 127 slices, acquisition time = 15min, scanner-provided reconstruction algorithm, OSEM, 3 iterations, 21 subsets). During the PET acquisition, MR data were simultaneously acquired with a protocol including T1-weighted MPRAGE (1.0 × 1.0 × 1.0 mm3, FOV = 256 × 256 mm2, 192 slices, TR/TE/TI = 1900/2.44/900 ms), FLAIR (0.4×0.4×3.0 mm3, TR/TE/TI 8460/92/2433 ms, FOV 220×220 mm2, 45 slices), and diffusion MRI (2.0 × 2.0 mm2, FOV 128 mm, 74 slices, thickness 2.0 mm, TR/TE = 10200/90 ms, 30 diffusion encoding directions with b = 1000 s/mm2, and 6 with b = 0 s/mm2). Other clinical records such as semiology, long-term video-EEG monitoring, radiological diagnosis of MR-HS and MR-negative cases were also collected.
Data processing
The individual masks were extracted from the T1-MPRAGE using FreeSurfer image analysis v7.0 package. Standardized uptake value ratios (SUVR), quantifying the glucose metabolism, were obtained using intensity normalization by cerebellar graymatter scaling of 18F-FDG PET images. Diffusion-weighted images were preprocessed using eddy for motion and eddy current correction. QSDR reconstruction was performed using DSI-studio after visual inspection of the image quality.
The 18F-FDG SUVRs of the 62 (left+right) cortical ROIs from the DKT atlas and 12 subcortical regions from the Aseg atlas (thalamus, caudate, putamen, pallidum, amygdala, hippocampus, left+right) were exacted by linear registration of the MPRAGE images to the PET images along with the MPRAGE based brain parcellation.
Data Analysis
Correlational tractography analysis was conducted to identify tracts significantly different between MR-HS and MR-negative patients with DSI-studio (built 20221103). Effects of sex, age, disease laterality, and encoding direction were removed using a multiple regression model. A T-score threshold of 2.5 was used and tracts were tracked using a deterministic fiber tracking algorithm using whole-brain seeding [8]. The final tracks were selected using an FDR threshold of 0.05.
For the 18F-FDG SUVRs of the 84 ROIs, the lateral SUVR differences between ipsilateral and contralateral sides were first obtained for each ROI (SUVR_ipsi – SUVR_contra). Then 2-sample t-test was performed to study if the lateral SUVR difference is different between MR-HS and MR-negative groups.
Furthermore, metabolic connectivity matrices of the regional 18F-FDG SUVRs were generated by calculating pair-wise Pearson correlation between two ROIs across subjects.
Results and Discussion
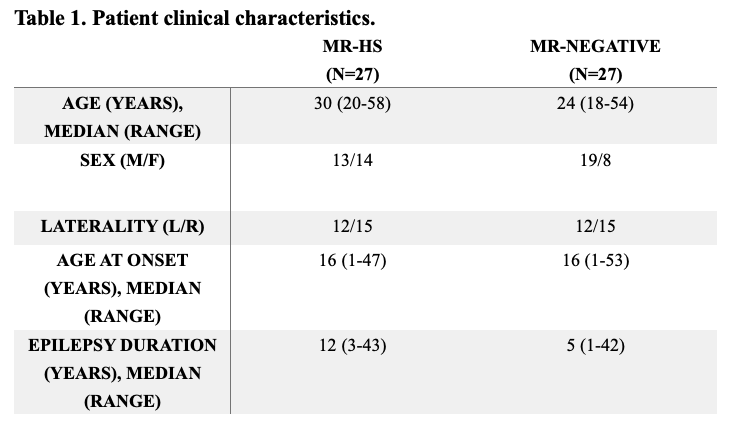
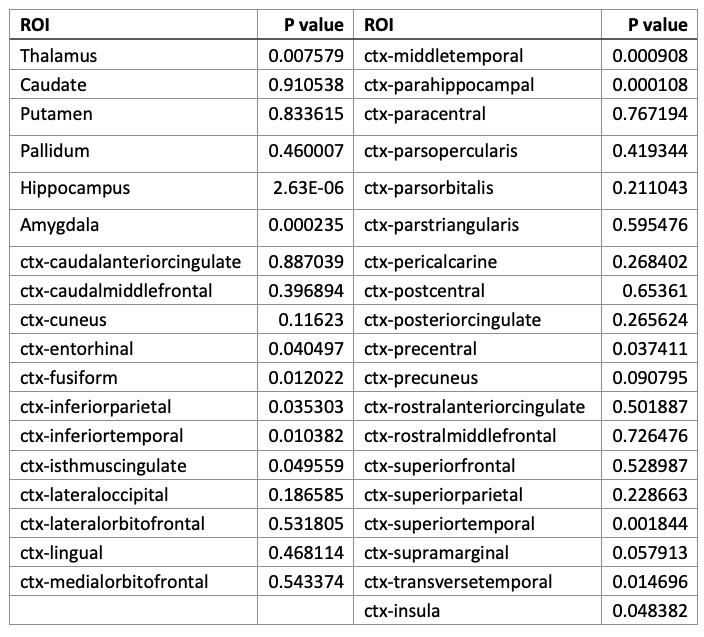
Patient demographics are summarized in Table 1.Using multiple linear regression analysis, we found mesial temporal structures such as hippocampus, amygdala, parahippocampus and middle temporal cortex to have significantly larger lateral FDG SUVR difference in HS group compared to MR-negative group (P <0.001, all survive Bonferroni multiple comparison correction). Notably, thalamus, a key region often involved seizure propagation, is also affected (P = 0.007579, survives multiple comparison correction).
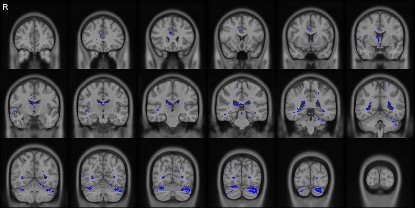
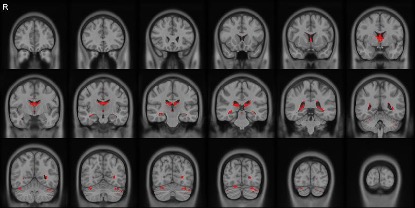
Figures 1 and 2 show the correlational tractography results demonstrating the tracts with significantly higher MD and lower FA in the MR-HS group as compared to MR-negative group, after controlling the confounders. The fornix of the brain, radiating from the hippocampus showed increased MD and decreased FA, which might reflect subtle microstructural damages as a result of recurrent seizures.
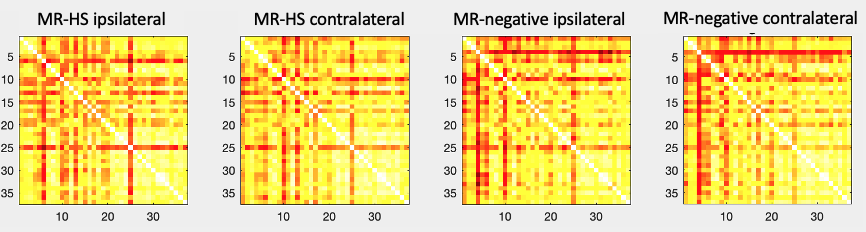
Figure 3 shows the inter-subject metabolic connectivity matrices. The loss of structure in the connectivity matrices of the HS group can be observed. Further, to quantify how different the two HS matrices are from the MR-negative matrices, the root-mean-square-error (RMSE) of the entry-wise difference was extracted and shown in Table 2. As can be seen, the ipsilateral brain of the HS group is more affected than the contralateral brain (larger RMSE).
Conclusion
In this study, we identified extensive network damage in MR-HS group.. Further investigation is warranted to study if other more personalized treatment approaches is needed beyond anterior temporal lobotomy alone.Acknowledgements
Jie Luo, Miao Zhang, Siyu Yuan, Hui Huang would like to acknowledge support from the National Natural Science Foundation of China (No. 62101321, No. 30900375), Shanghai Science and Technology Commission project (No.17411964800), Shanghai Municipal Key Clinical Specialty (No. shslczdzk03403), and 3-year planning of the Shanghai Shen-Kang Promoting Hospital’s Clinical Skills and Innovative Ability Project (No. 16CR3110B).
Chuan Huang and Tianyun Zhao declare no financial conflict of interest.
References
1. Blumcke I. Neuropathology of focalepilepsies: a critical review. Epilepsy Behav. 2009;15(1):34-9.
2. Wiebe S. Outcome patterns in epilepsy surgery—the long-term view. Nat Rev Neurol. 2012;8(3):123-4.
3. Kim YK, Lee DS, Lee SK, et al. Differential features of metabolic abnormalities between medial and lateral temporal lobe epilepsy: quantitative analysis of 18F-FDG PET using SPM. J Nucl Med. 2003;44(7):1006-12.
4. Laurent A, Artiges E, Mellerio C, et al. Metabolic correlates of cognitive impairment in mesial temporal lobe epilepsy. Epilepsy Behav. 2020 Apr 1;105:106948.
5. Basser PJ, Pierpaoli C. Microstructural and physiological features of tissues elucidated by quantitative-diffusion-tensor MRI. J Magn Reson. 2011;213(2):560-70.
6. Otte WM, van Eijsden P, Sander JW, et al. A meta‐analysis of white matter changes in temporal lobe epilepsy as studied with diffusion tensor imaging. Epilepsia. 2012;53(4):659-67.
7. Aparicio J, Carreño M, Bargalló N, et al. Combined 18F-FDG-PET and diffusion tensor imaging in mesial temporal lobe epilepsy with hippocampal sclerosis. NeuroImage Clin. 2016;12:976-89.
8. Yeh FC, Verstynen TD, Wang Y, et al. Deterministic diffusion fiber tracking improved by quantitative anisotropy. PloS one. 2013;8(11):e80713.
Figures