1001
A 15-minute 860um whole-brain MR-Fingerprinting and DTI epilepsy protocol demonstrated on 51 medial temporal lobe epilepsy patients.1Department of Neurology, the First Affiliated Hospital, School of Medicine, Zhejiang University, Hangzhou, China, 2Department of Radiology, Stanford University, Stanford, CA, United States, 3Department of Electrical Engineering, Stanford University, Stanford, CA, United States, 4Center for Brain Imaging Science and Technology, College of Biomedical Engineering & Instrument Science, Zhejiang University, Hangzhou, China, 5Signal and Image Processing Institute, University of Southern California, Los Angeles, CA, United States, 6Department of Imaging Sciences, University of Rochester, Rochester, NY, United States
Synopsis
Keywords: Epilepsy, Epilepsy
In this work, we combined a 5-minute whole-brain 0.86mm-iso 3D-MR fingerprinting (MRF) with a 10-minute whole-brain 0.86mm-iso diffusion MRI protocol, to achieve high-fidelity whole-brain T1/T2/PD and diffusivity maps at sub-millimeter isotropic resolution. This protocol was applied to medial temporal lobe epilepsy (MTLE) patients to enable accurate detection of the hippocampal sclerosis. A multi-parametric analysis was implemented with whole-brain subcortical segmentation. A multi-component 2D-relaxometry spectra was estimated with non-negative joint sparsity for robust suspicious lesion detection.Introduction
Hippocampal sclerosis (HS) is a common pathology underlying mesial temporal lobe epilepsy (MTLE)(1). Previous studies have demonstrated that MR fingerprinting (MRF) could identify the significant variation in relaxation time between MTLE patients and healthy controls and improve the diagnosis accuracy(2–4). However, there are still several limitations to the current quantitative analysis of MTLE patients:(i) The resolution of MRF for epilepsy is not sufficient to reflect subtle changes in the hippocampus.
(ii) The T1 and T2 values were estimated using voxel-by-voxel template matching, where subvoxel microstructural tissue compartments would be hidden by partial volume effects.
(iii) In addition to quantitative T1 and T2 values, other metrics such as diffusion could probably further aid to improve the diagnosis of MTLE.
In this work, to solve the above issues, we implemented corresponding approaches to further improve the sensitivity and accuracy of lesion detection in MTLE patients via:
(i) We proposed to use optimized 3D MRF(8) to obtain whole-brain submillimeter quantitative T1/T2 maps for MTLE patients, which also enables brain subcortical segmentation for quantitative analysis of substructures in the brain.
(ii) A multi-component fitting approach was applied to estimate the joint distribution of T1-T2 relaxation parameters within each voxel to reveal the subvoxel compartment.
(iii) By incorporating diffusion metrics into the subcortical analysis, we achieved a better estimation of the volume and cortical thickness of the substructures, which improved the accuracy of lesion detection.
Methods
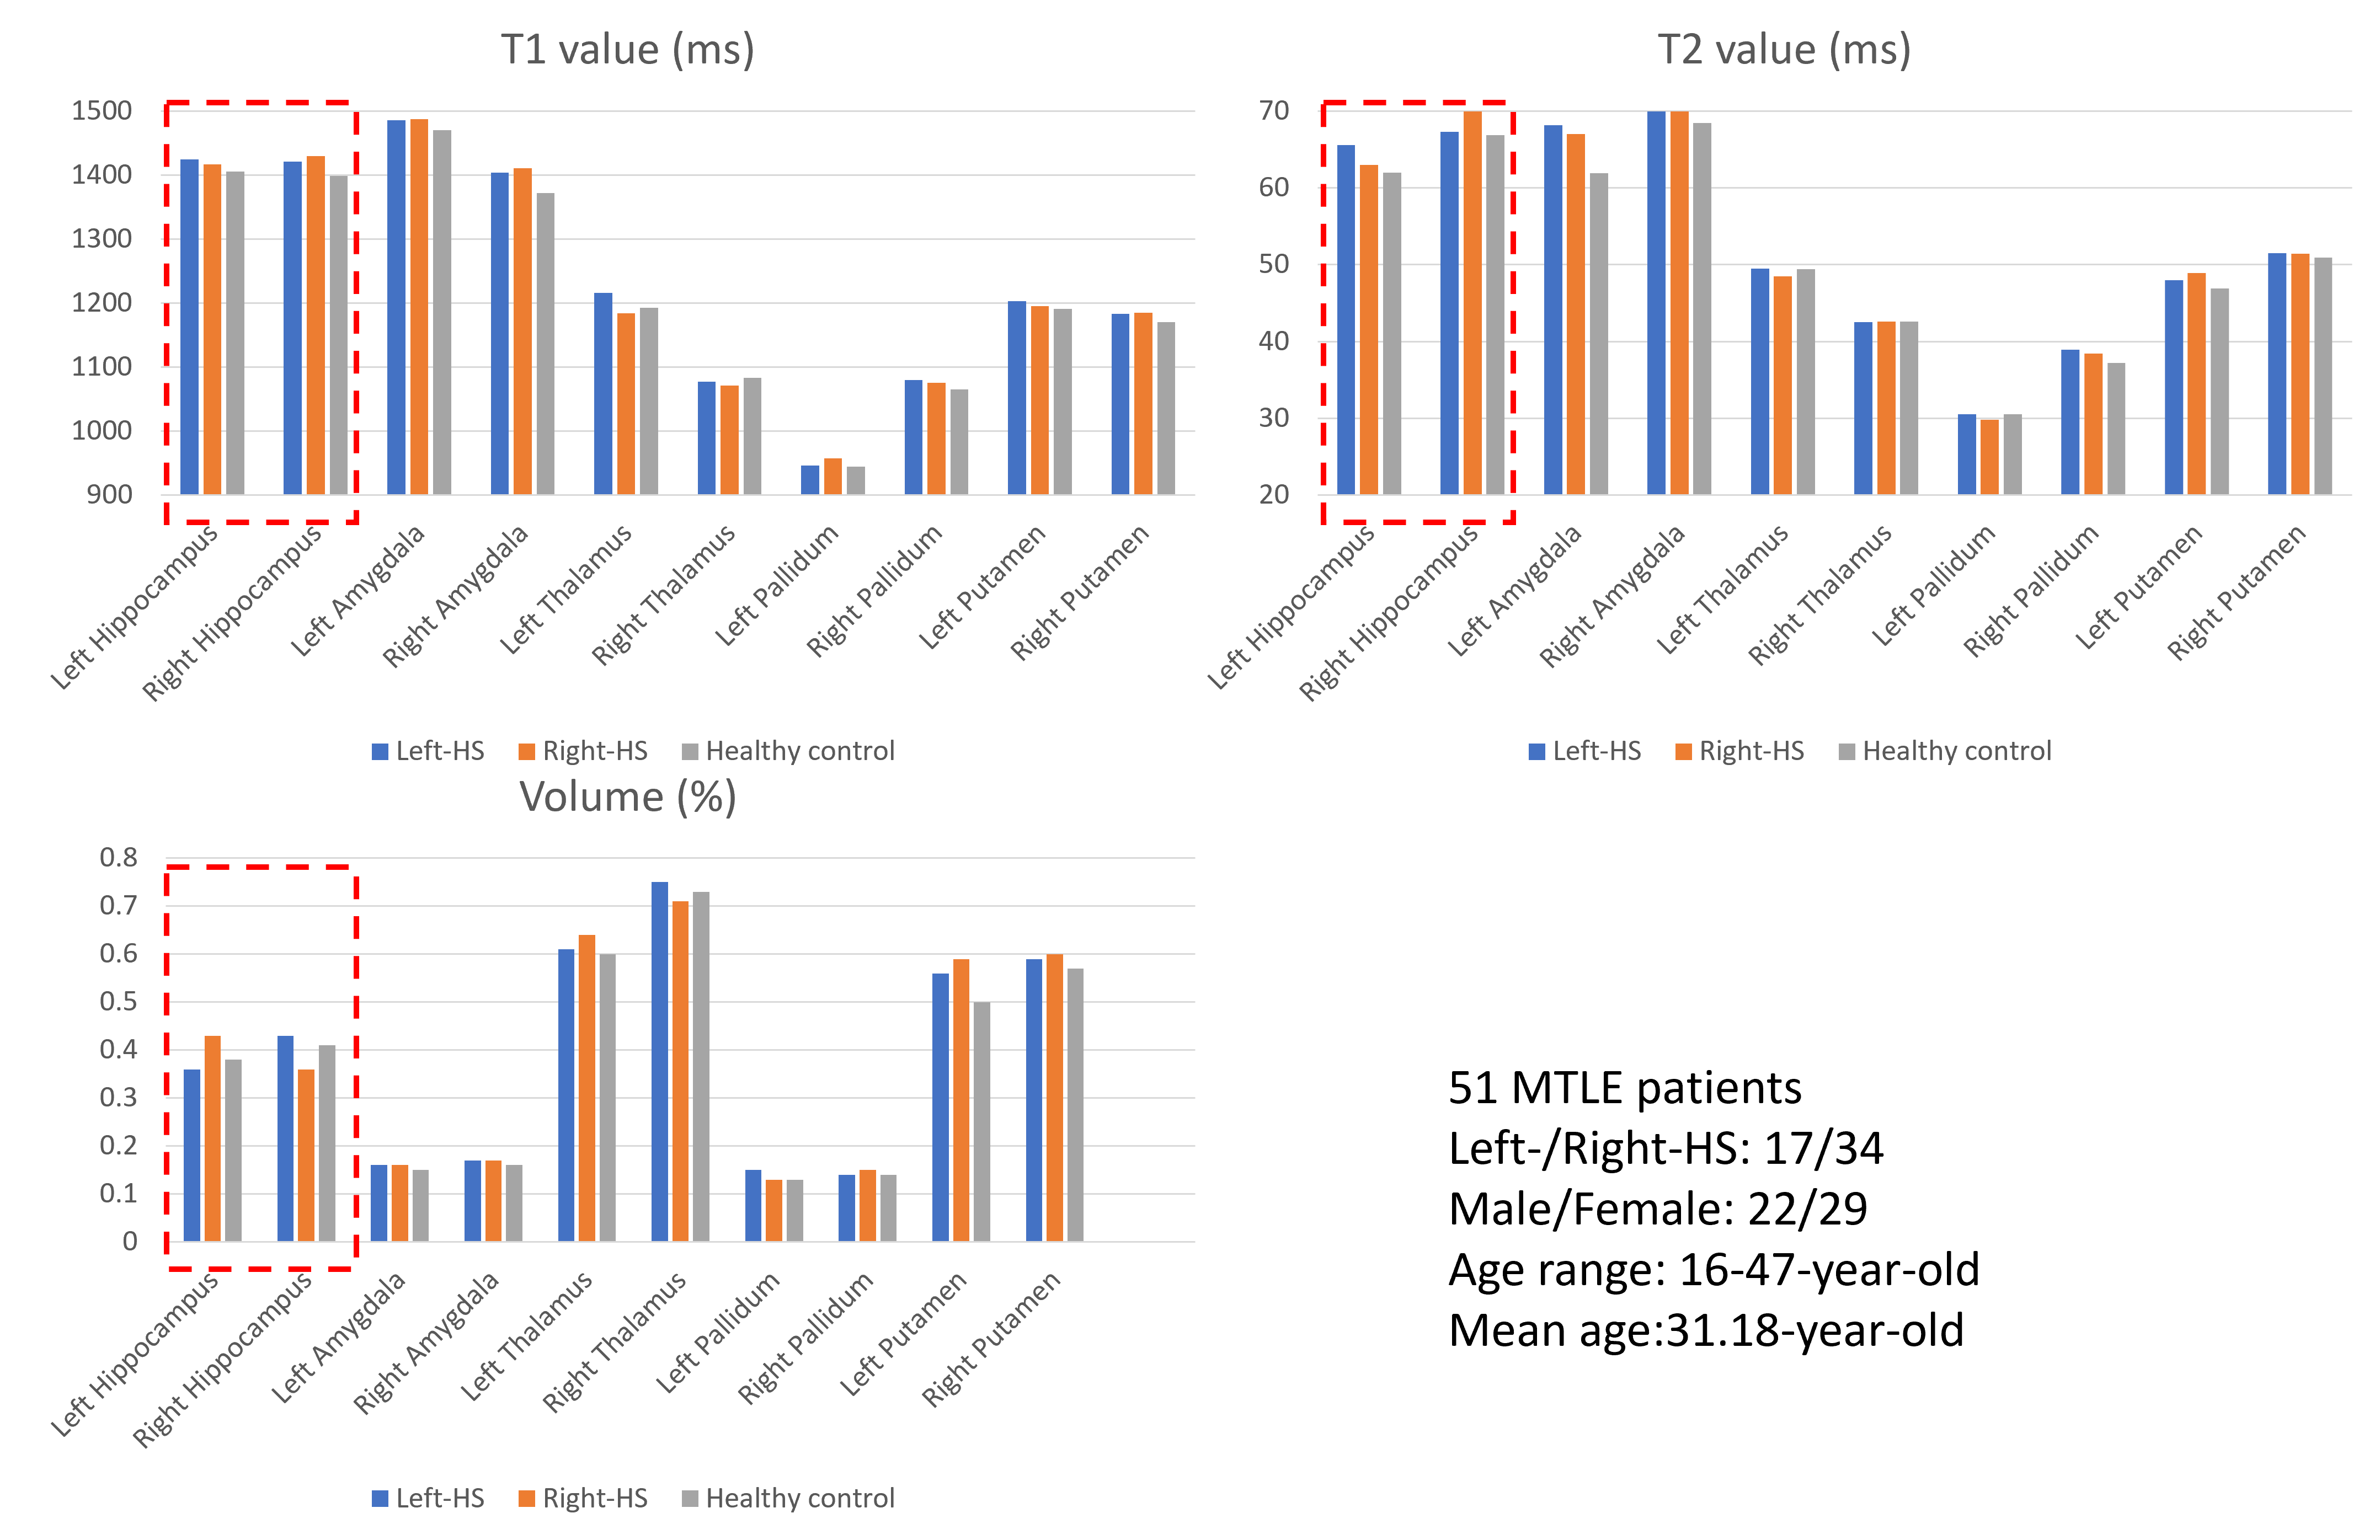
A total of 51 MTLE patients, who have been diagnosed with HS based on clinical presentation and scalp-EEG, participated in this study. All patients were recruited from the epilepsy clinic of the First Affiliated Hospital, Zhejiang University between 03/21/2018 and 08/31/2022. This study was approved by the institutional review board. Written informed consent was obtained from each participant or from a legal representative. All the data were acquired from a 3T Siemens Prisma scanner.Protocol: Optimized 3D-MRF(5,6) and generalized slice dithered enhanced resolution (gSlider) diffusion sequences(7) were used. In the 3D-MRF acquisition, 3D-tiny-golden-angle-shuffling spiral-projection sampling trajectory(8) was performed to achieve 0.86mm-isotropic resolution for FOV220×220×220mm3 within 5-minute acquisition. For the diffusion protocol, the gSlider technique was used that combined self-navigated RF-encodings with simultaneous multi-slab acquisition to enable whole-brain diffusion imaging at 0.86mm-isotropic-resolution, FOV=220×220×146mm3, TR/TE=3500/72ms, 170slices, inplane-acceleration×multiband-factor×gSlider-encodings=3×2×5. Thirty diffusion-directions with b=1000s/mm2 were acquired in 10 minutes.
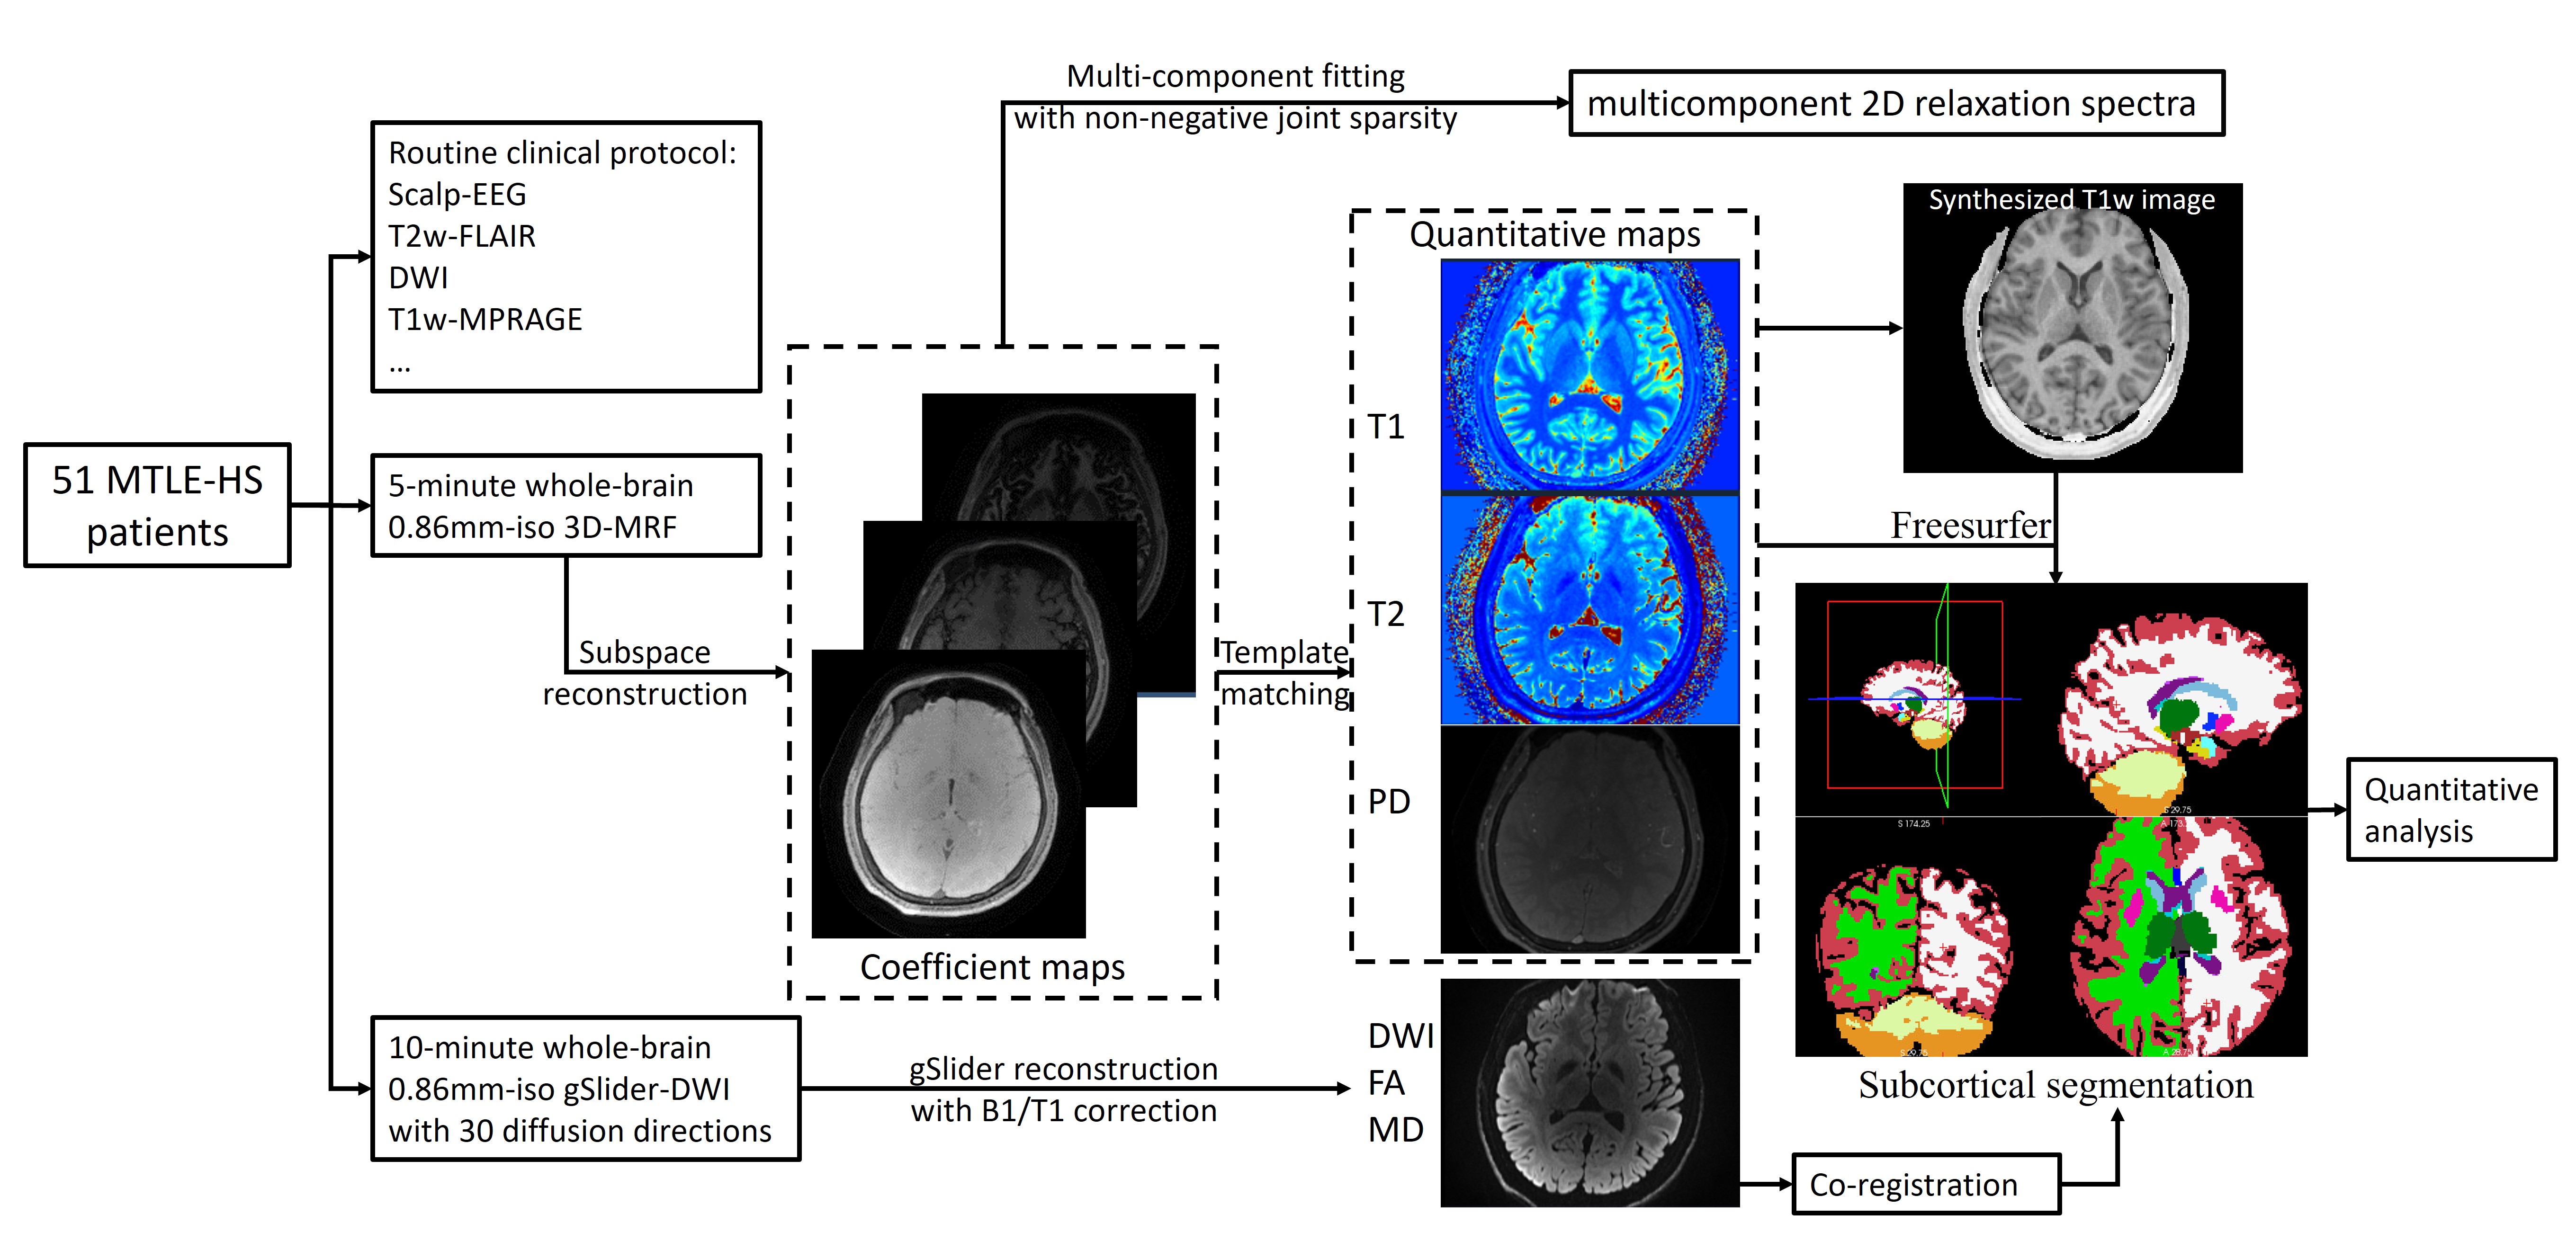
Post-processing: Figure1 shows the flowchart of post-processing. The MRF data were reconstructed using subspace modeling. The dictionary of MRF was generated using Bloch-simulation, and the first 5 principal components were selected as the temporal bases. With the subspace reconstruction, the reconstructed coefficient maps are then used to fit the T1-T2 correlation spectroscopic imaging and estimate T1/T2/PD maps. For the gSlider data, the processed RF slab-encoded volumes were combined to create a high slice-resolution volume. The reconstructed diffusion data were then used to generate mean diffusivity and FA maps using FSL(9).
The substructure segmentation was generated by: (i) T1-weighted images were synthesized by Bloch-equation using the obtained quantitative maps. (ii) The synthesized T1-weighted images were imported into Freesurfer(10) to obtain the substructure segmentation map. (iii) The diffusivity maps were co-registered to the T1-weighted images using boundary-based registration(11). (iv) With the segmentation masks, statistical analysis of each subcortical structure was performed across T1, T2, and mean-diffusivity maps.
To estimate a 2D-relaxometry spectra $$$ X∈R^{M1×M2}$$$ (with M1 corresponding to the number of T1-index and M2 corresponding to the number of T2-index in the dictionary) on each voxel, we solved a nonnegativity-constrained least-squares optimization problem with joint sparsity:
$$min ||X||_{2,1} s.t.{AX=Y,X≥0}$$
where A is the temporal bases and Y is the reconstructed coefficient maps. $$$min||X||_{2,1} =\sum_{i=1}^n||X_{gi}||_{2}$$$ is the L1,2-norm of X, denotes the grouping of X, representing the fraction of all voxels in the i-th group.
Results
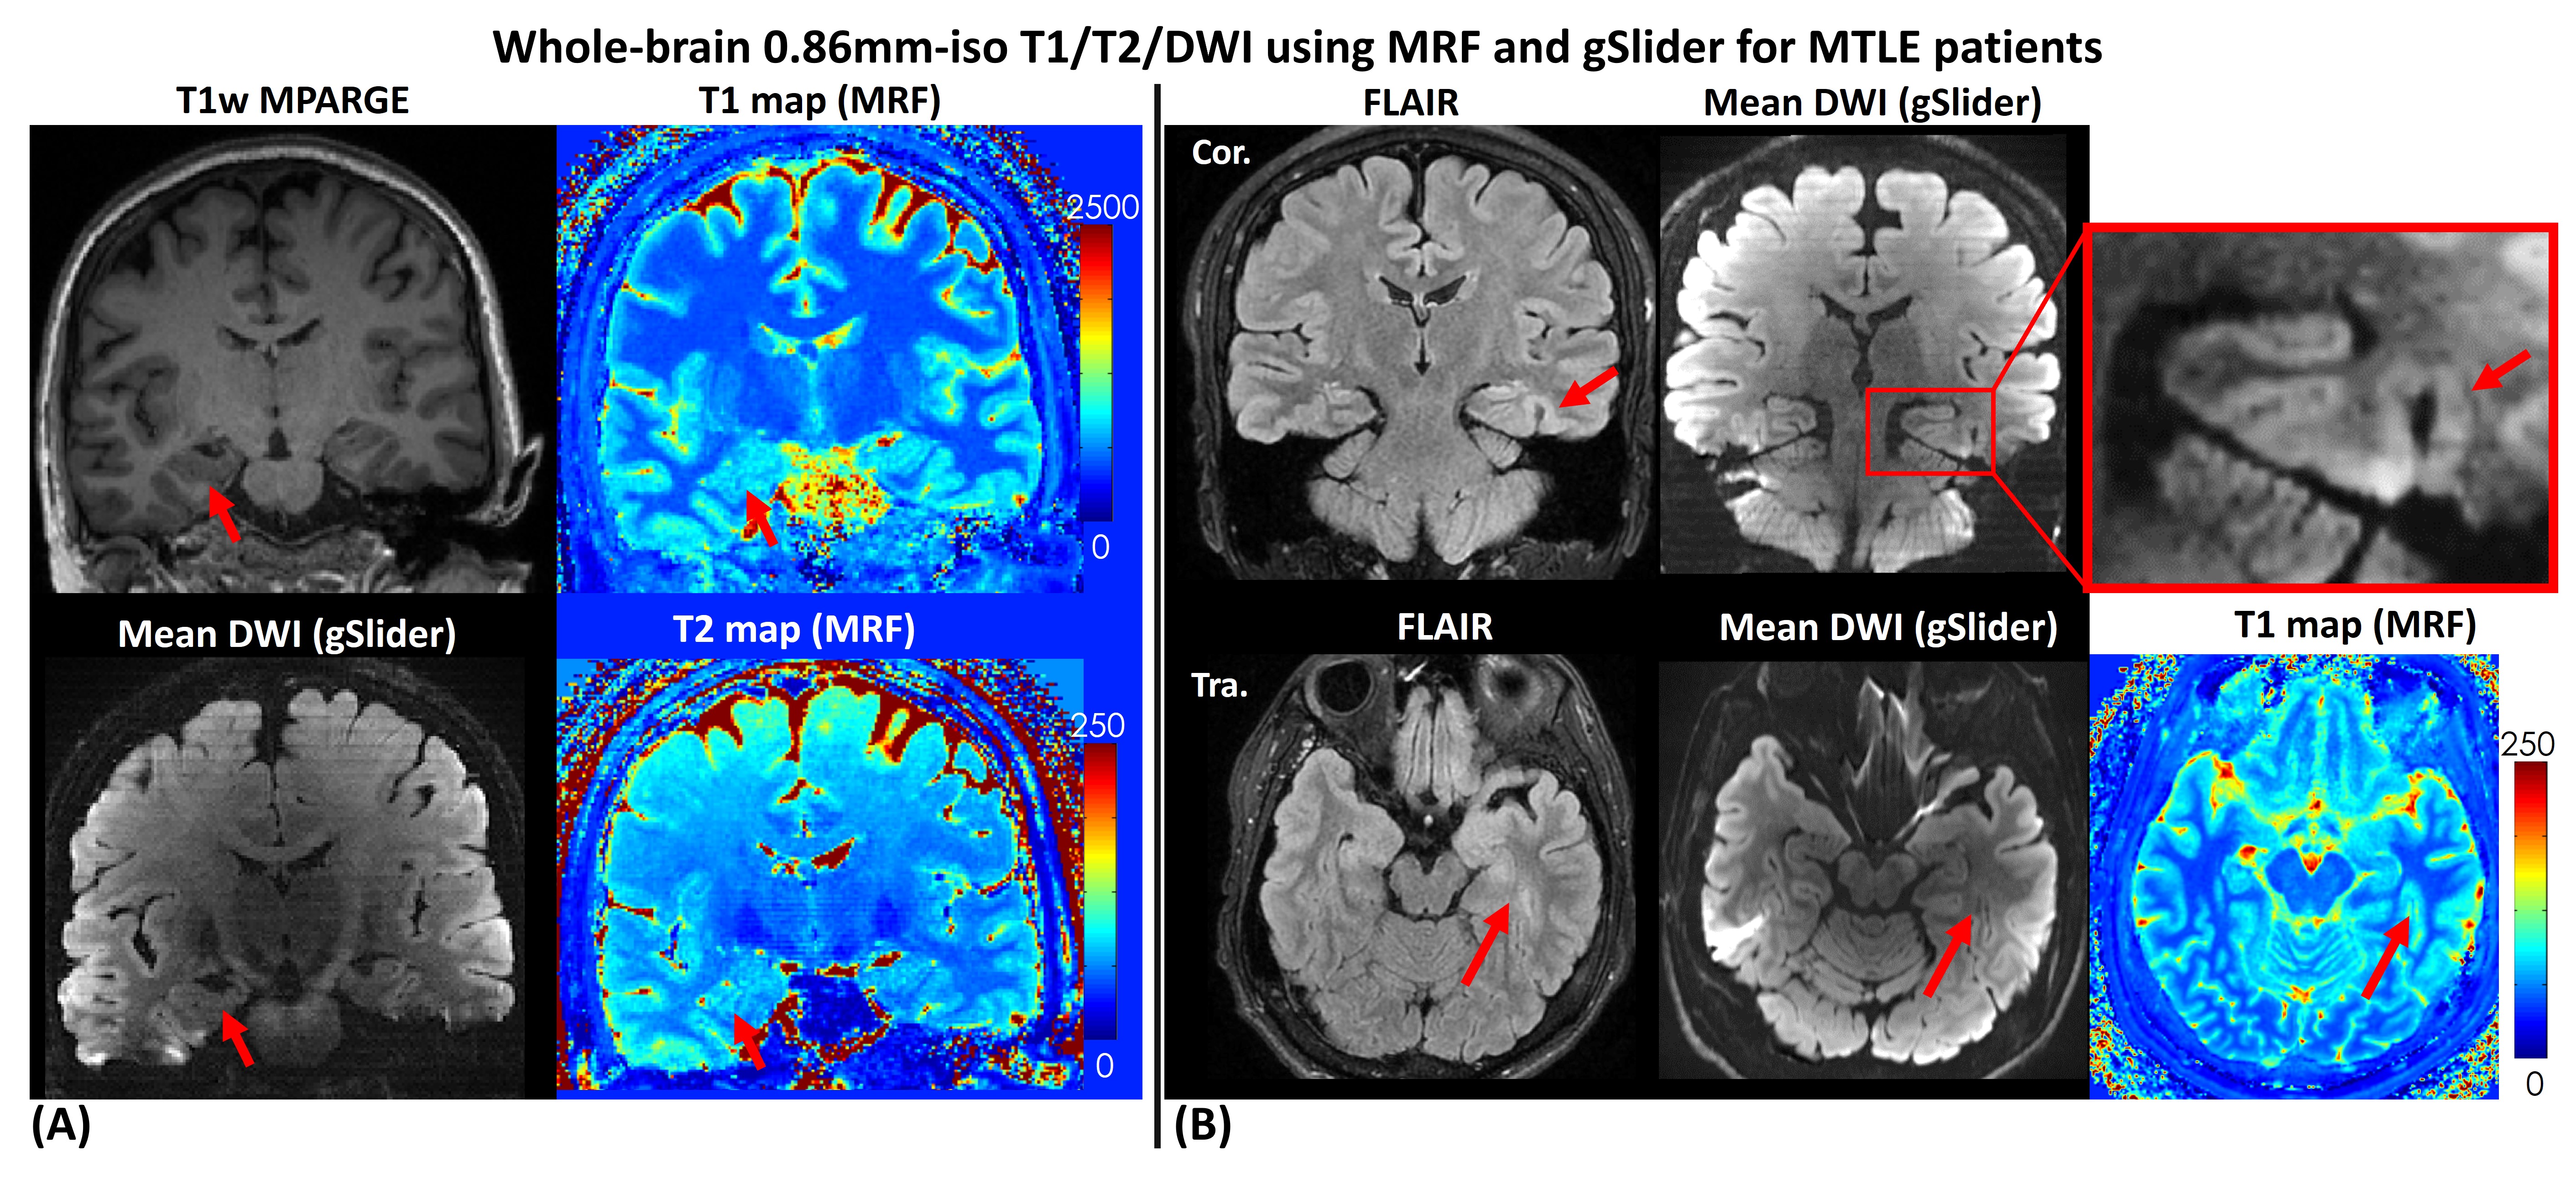
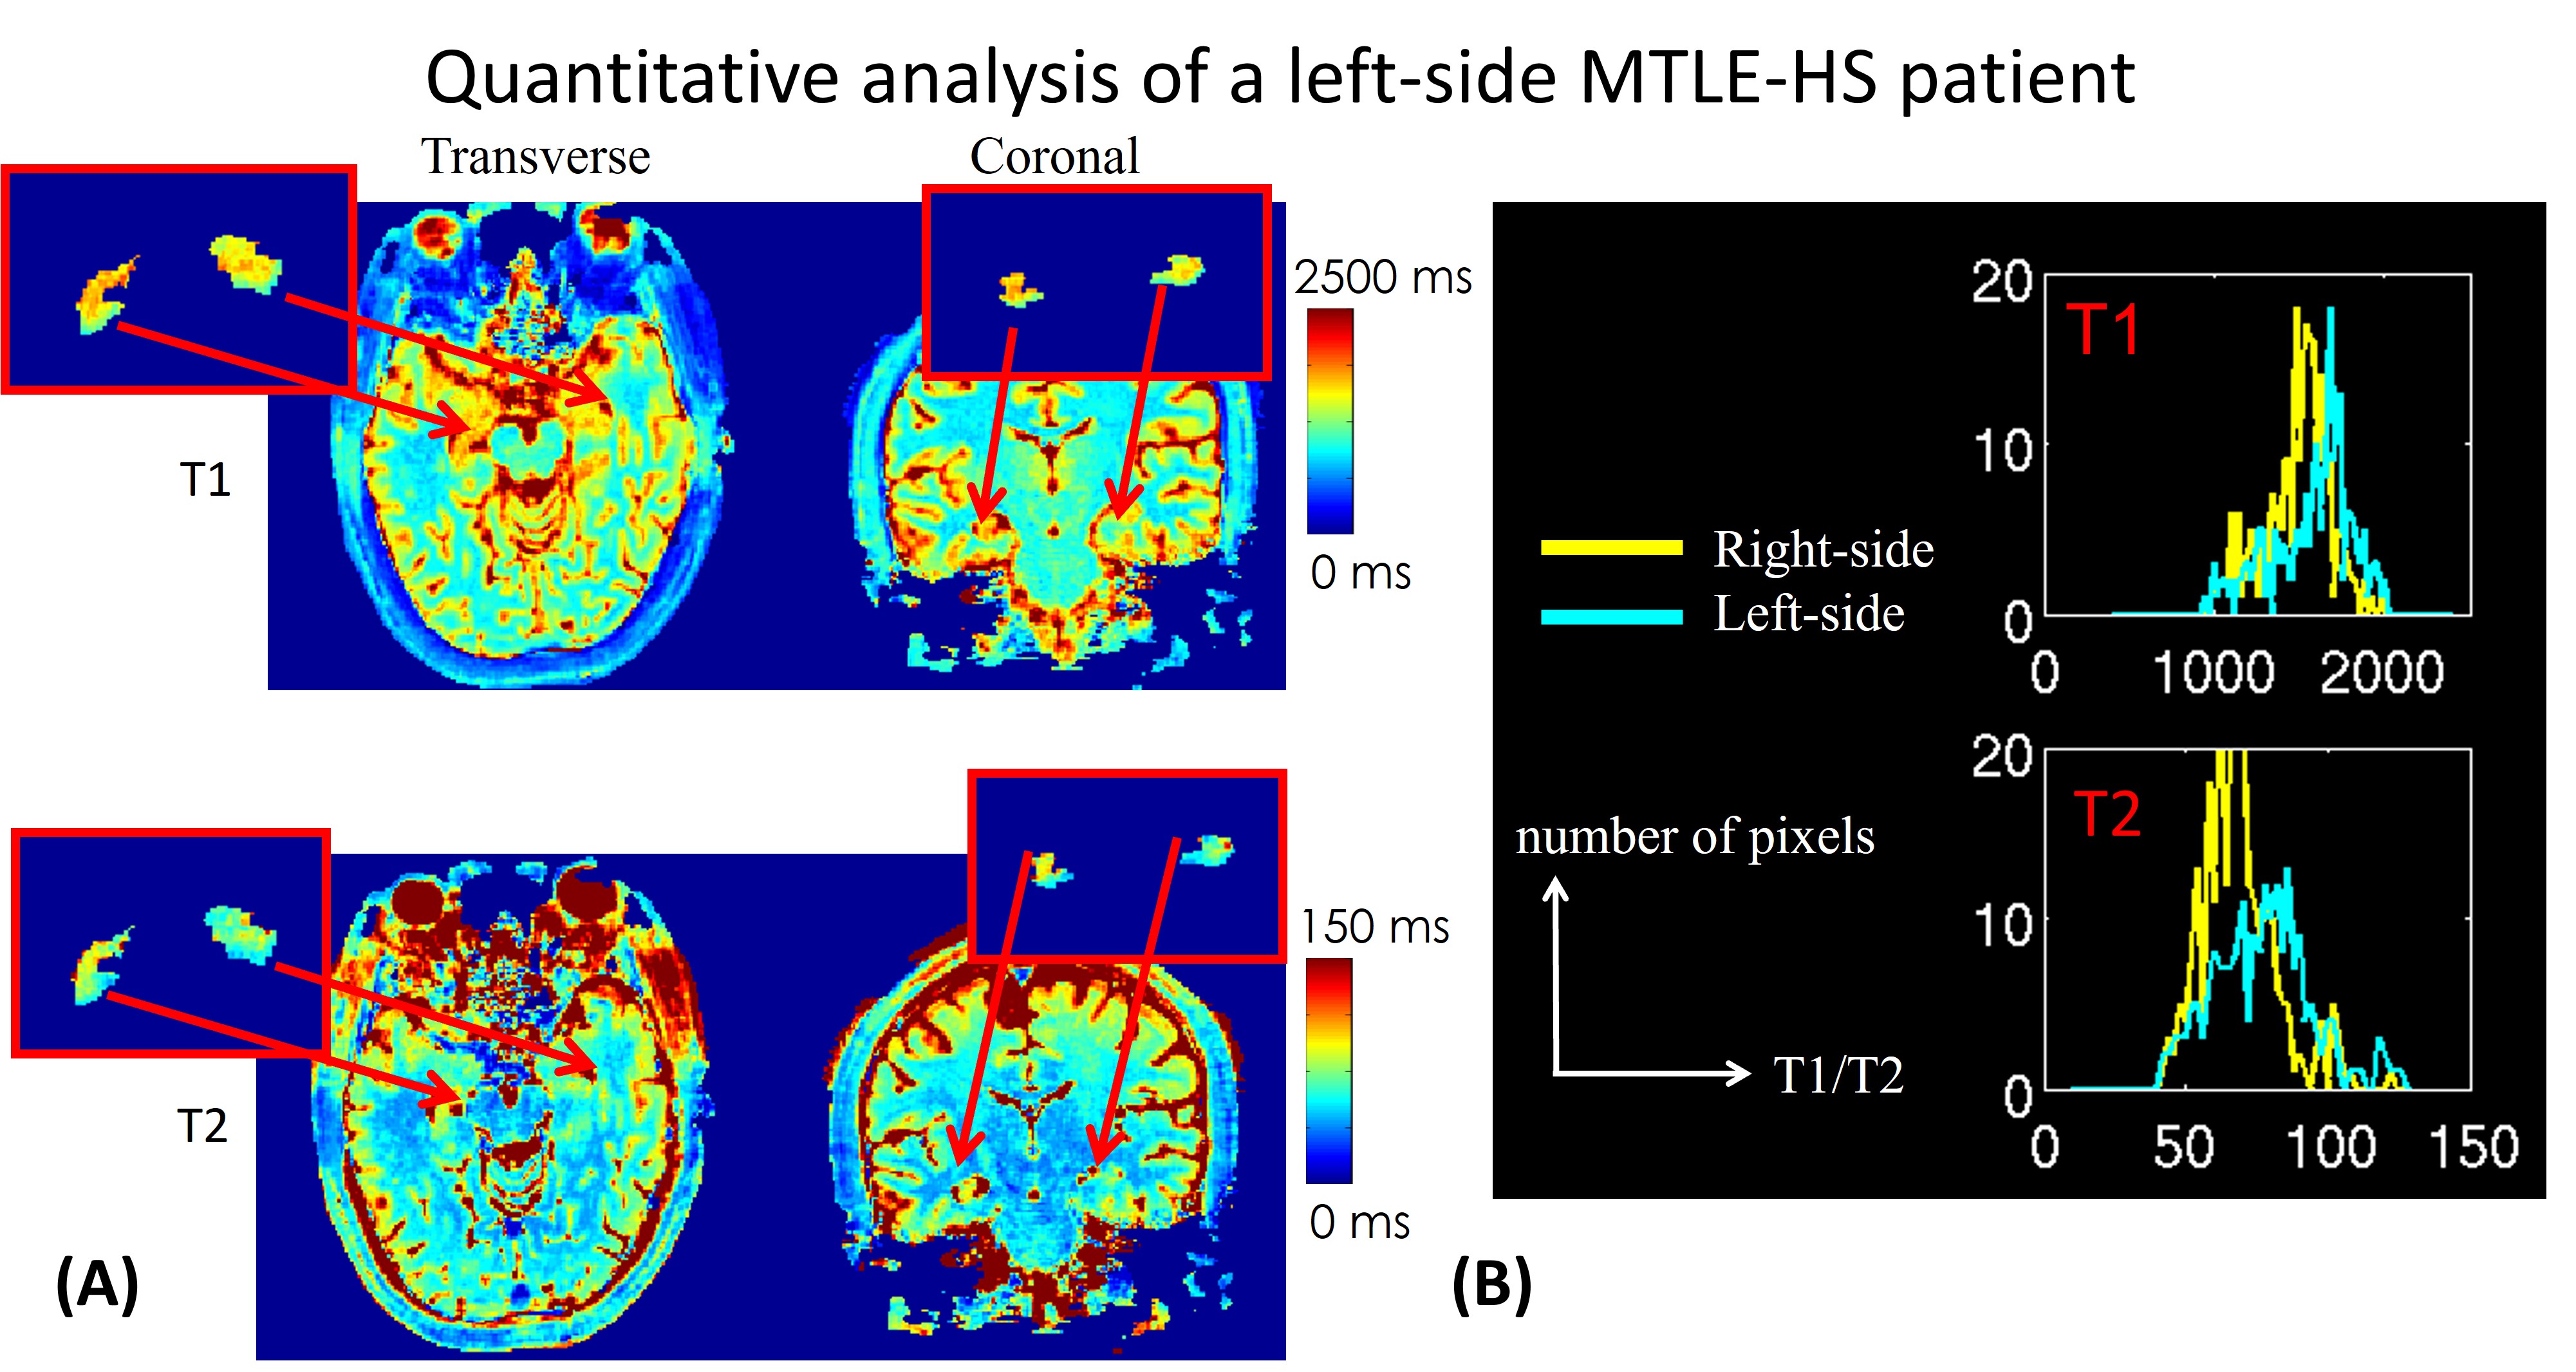
Figure2 shows whole-brain 0.86mm-iso T1/T2 and mean-diffusion using MRF and gSlider for (A) a right-sided HS patient and (B) an MTLE patient with the lesion in the parahippocampal gyrus. The zoom-in figure in Figure2(B) demonstrates the high-resolution mean-DWI could aid in better visualizing the thickening of the parahippocampal gyrus.Figure3(A) shows the T1 and T2 maps of a left-sided MTLE-HS patient in transverse and coronal view, respectively. The red boxes are zoomed views of the segmented left and right hippocampus. The distribution of T1 and T2 values of the left and right hippocampus were shown in Figure3(B). Both T1 and T2 values of the left hippocampus were higher than the right counterparts. This observation is consistent with our previous study.
Figure4 shows the average T1 and T2 values and volume proportion of right/left-sided HS patients and healthy controls in different substructures and tissues. Compared to healthy controls, the T1/T2 values increase while the volume proportions decrease.
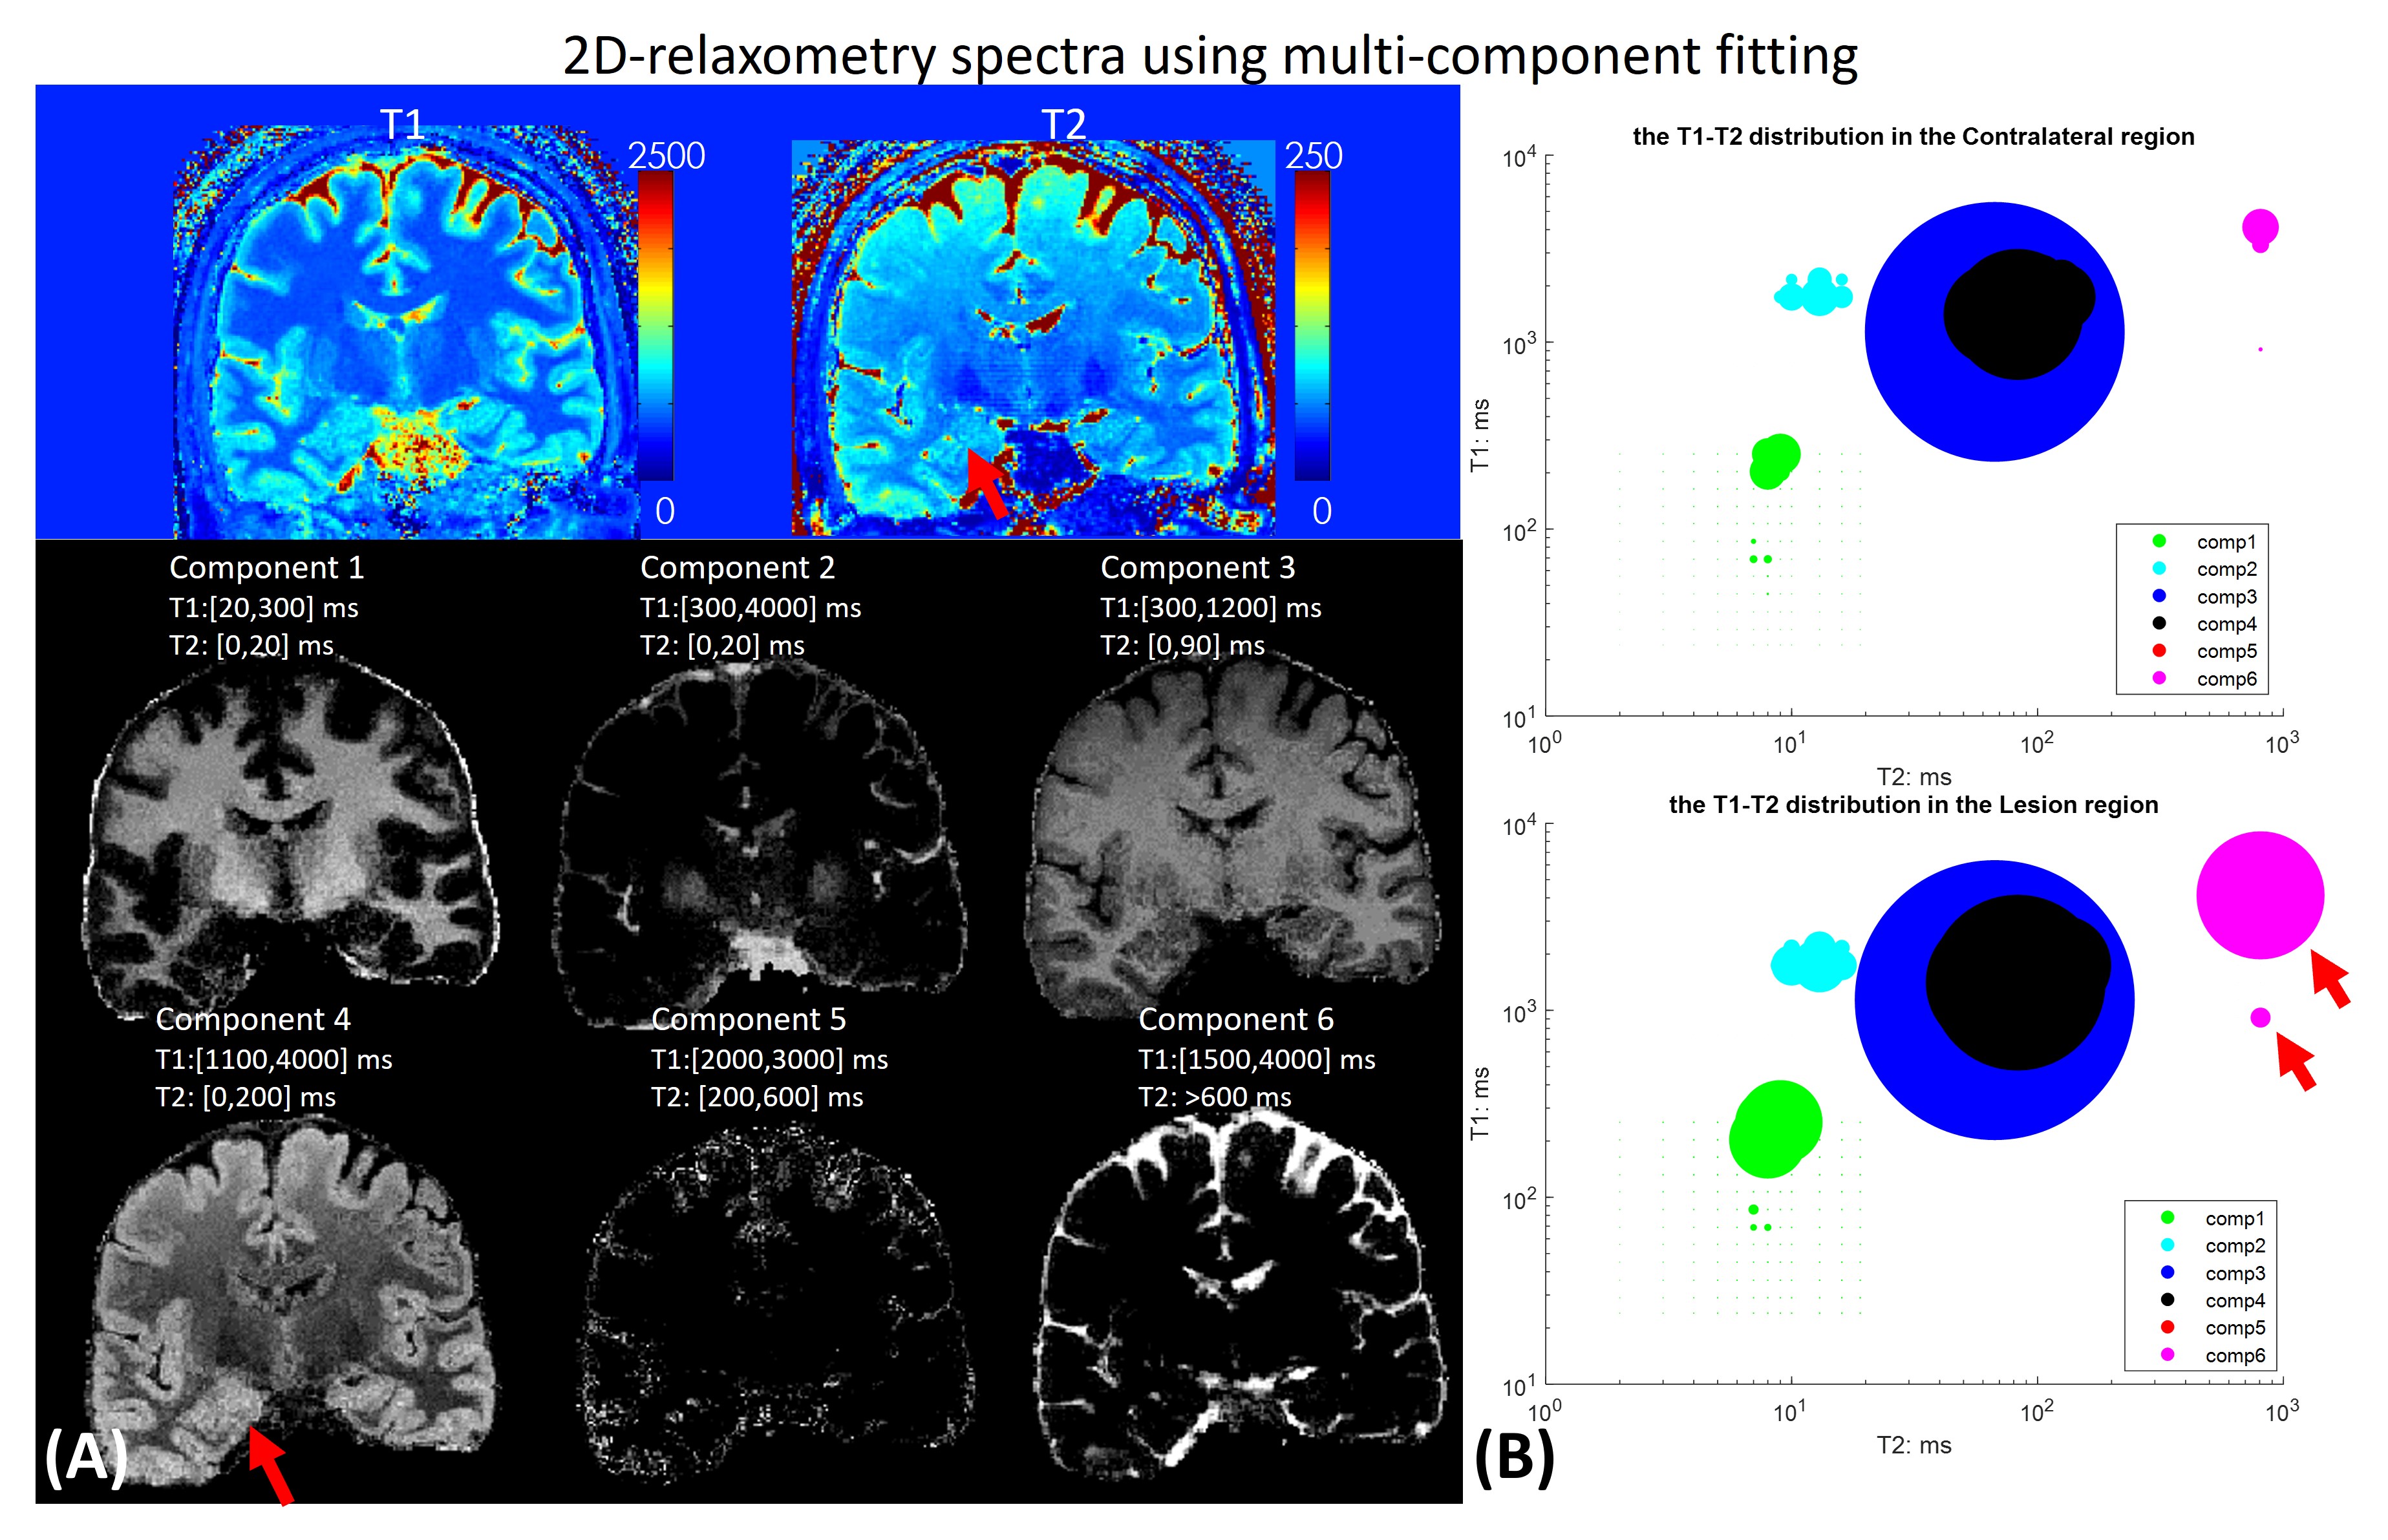
Figure5 shows the tissue fractional maps with 6 components and the 2D-relaxometry-spectra of HS lesion and contralateral tissue. As red arrows indicated in Fig5(B), the spectra of the lesion have a bigger area of component 6, which implies increased T1/T2 values compared to the contralateral region.
Discussion and conclusion
In this work, we applied a fast whole-brain submillimeter relaxometry and diffusion MRI protocol to quantitative investigate HS lesions in MTLE-patients. The results demonstrate the proposed MRF and gSlider-DTI could aid in the detection of HS lesions and diagnosis of MTLE.Acknowledgements
No acknowledgement found.References
1. Jackson GD, Berkovic SF, Tress BM, Kalnins RM, Fabinyi GC, Bladin PF. Hippocampal sclerosis can be reliably detected by magnetic resonance imaging. Neurology 1990;40:1869–1875 doi: 10.1212/WNL.40.12.1869.
2. Liao C, Wang K, Cao X, et al. Detection of Lesions in Mesial Temporal Lobe Epilepsy by Using MR Fingerprinting. Radiology 2018;288:804–812 doi: 10.1148/radiol.2018172131.
3. Tang Y, Su TY, Choi JY, et al. Characterizing thalamic and basal ganglia nuclei in medically intractable focal epilepsy by MR fingerprinting. Epilepsia 2022;63:1998–2010 doi: 10.1111/epi.17318.
4. Choi JY, Hu S, Su T-Y, et al. Normative quantitative relaxation atlases for characterization of cortical regions using magnetic resonance fingerprinting. Cereb. Cortex 2022 doi: 10.1093/cercor/bhac292.
5. Liao C, Bilgic B, Manhard MK, et al. 3D MR fingerprinting with accelerated stack-of-spirals and hybrid sliding-window and GRAPPA reconstruction.; 2017. doi: 10.1016/j.neuroimage.2017.08.030.
6. Cao X, Ye H, Liao C, Li Q, He H, Zhong J. Fast 3D brain MR fingerprinting based on multi‐axis spiral projection trajectory. Magn. Reson. Med. 2019;82:289–301 doi: 10.1002/mrm.27726.
7. Liao C, Stockmann J, Tian Q, et al. High-fidelity, high-isotropic-resolution diffusion imaging through gSlider acquisition with B1+ and T1 corrections and integrated ΔB0/Rx shim array. Magn. Reson. Med. 2020;83:56–67 doi: 10.1002/mrm.27899.
8. Cao X, Liao C, Srinivasan Iyer S, et al. Optimized multi-axis spiral projection MR fingerprinting with subspace reconstruction for rapid whole-brain high-isotropic-resolution quantitative imaging.
9. Jenkinson M, Beckmann CF, Behrens TEJ, Woolrich MW, Smith SM. Fsl. Neuroimage 2012;62:782–790 doi: 10.1016/j.neuroimage.2011.09.015.
10. Fischl B. FreeSurfer. Neuroimage 2012;62:774–781 doi: 10.1016/j.neuroimage.2012.01.021.
11. Greve DN, Fischl B. Accurate and robust brain image alignment using boundary-based registration. Neuroimage 2009;48:63–72 doi: 10.1016/j.neuroimage.2009.06.060.
Figures