0999
Structural changes within the temporal lobe in mesial temporal lobe epilepsy at 7 Tesla1Icahn School of Medicine at Mount Sinai, New York, NY, United States, 2Biomedical Engineering and Imaging Institute, Icahn School of Medicine at Mount Sinai, New York, NY, United States, 3Department of Neurology, Mount Sinai Hospital, New York, NY, United States, 4Diagnostic, Molecular and Interventional Radiology, Icahn School of Medicine at Mount Sinai, New York, NY, United States, 5Nash Family Department of Neuroscience, Icahn School of Medicine at Mount Sinai, New York, NY, United States, 6Computer Science, Math, Physics, and Statistics, University of British Columbia, Kelowna, BC, Canada
Synopsis
Keywords: Epilepsy, Neuroinflammation, High-Field MRI, perivascular spaces
Here we outline a preliminary analysis using a novel method leveraging ultra-high field neuroimaging to measure detectable differences in vasculature within the temporal lobe that may not be detectable at lower field strengths. We provide a tool for detection and quantification of vessels, perivascular spaces, and volumetric changes within the temporal lobe which may be relevant to uncover possible underlying neuroinflammatory processes in mesial temporal lobe epilepsy (MTLE) patients. In our analysis, we found a significant association between volumetric measures of the temporal lobe and vascular and perivascular markers, in patients with lateralized MTLE which may underlie epileptogenic processes.Introduction
Epilepsy is a neurological disorder characterized by persistent seizures which may be correlated with macrostructural, or vascular changes in the brain. More specifically, in patients with mesial temporal lobe epilepsy (MTLE), structural differences may be localized within the temporal lobe related to the side of seizure onset zone (SOZ). To better understand lateralized changes within the temporal lobe in MTLE we have performed a preliminary investigation to visualize possible vascular abnormalities and volumetric differences within and between the temporal lobes. We sought to identify changes in the quantity of vessels and perivascular spaces (PVS) (1). The presence of PVS, small fluid filled spaces in the brain which are thought to be associated with glymphatic drainage and neuroinflammation (2,3), may also be a byproduct of seizure activity or indication of dysfunction in vasculature, blood brain barrier permeability, or drainage. Segmentation and quantification of vessels, PVS, and correlations with temporal lobe structural changes through volume may provide insight into the lateralized differences in MTLE as it relates to SOZ. We performed an exploratory analysis using assessing lateralized differences in temporal lobe volume, and quantified vessels, and PVS, in efforts to explore the relationship between temporal lobe volume and vascular differences in patients with MTLE.Methods
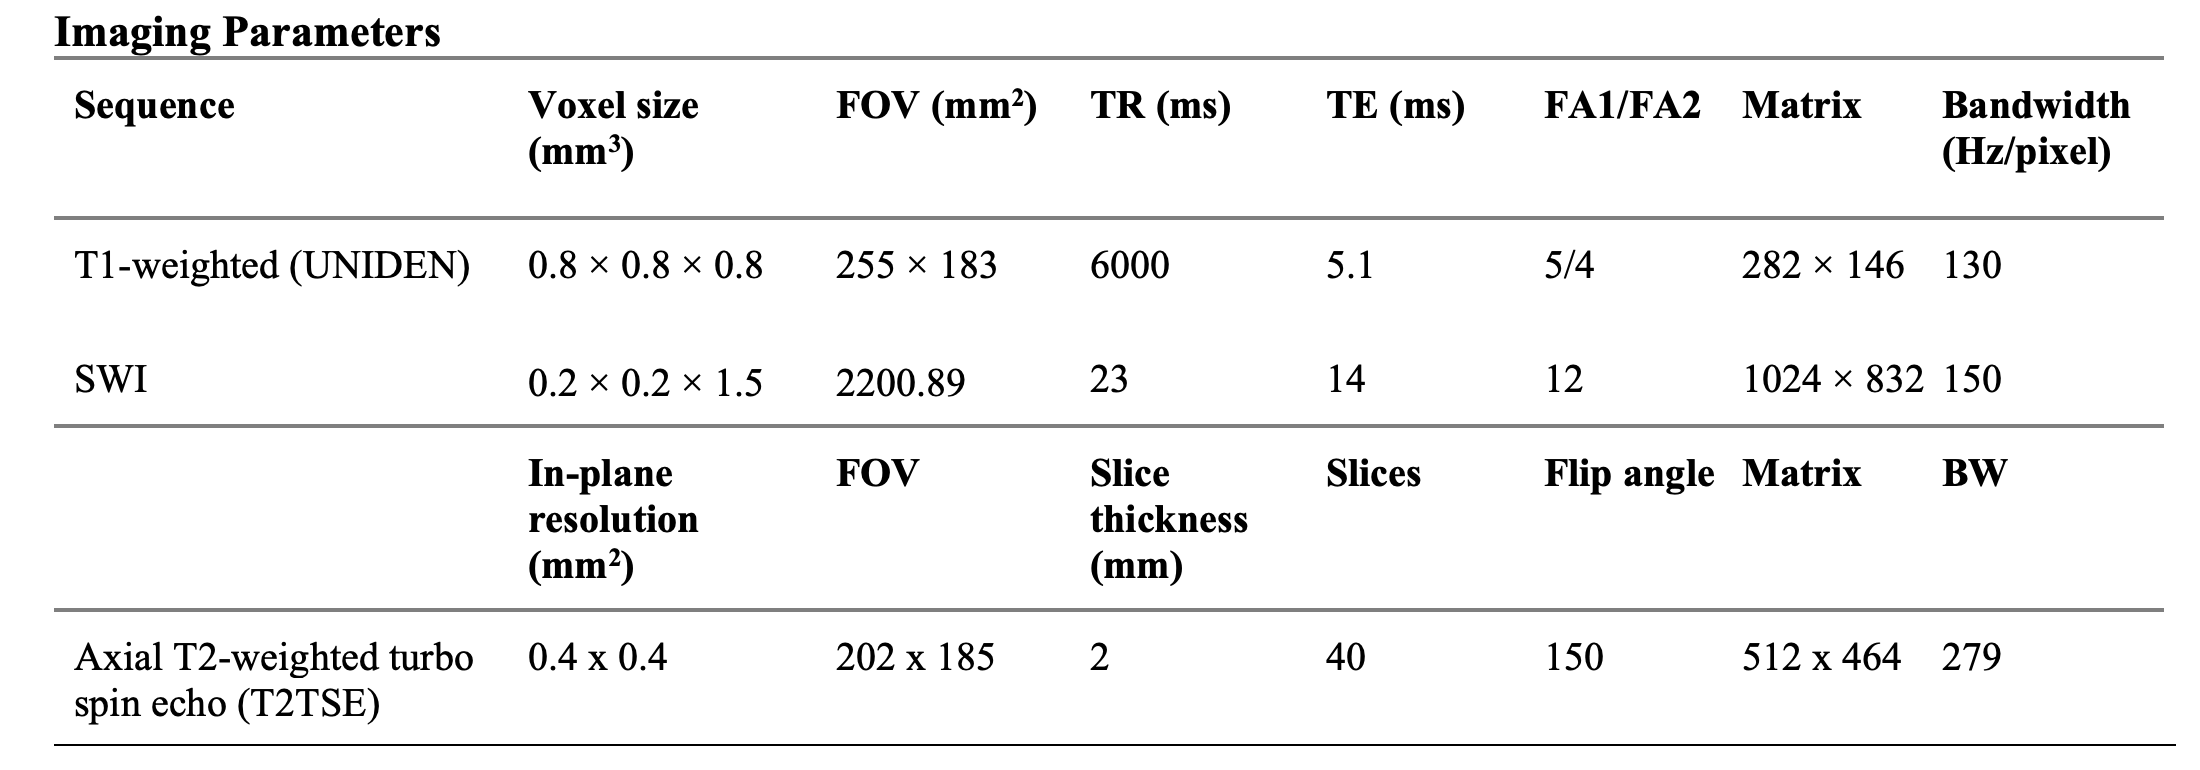
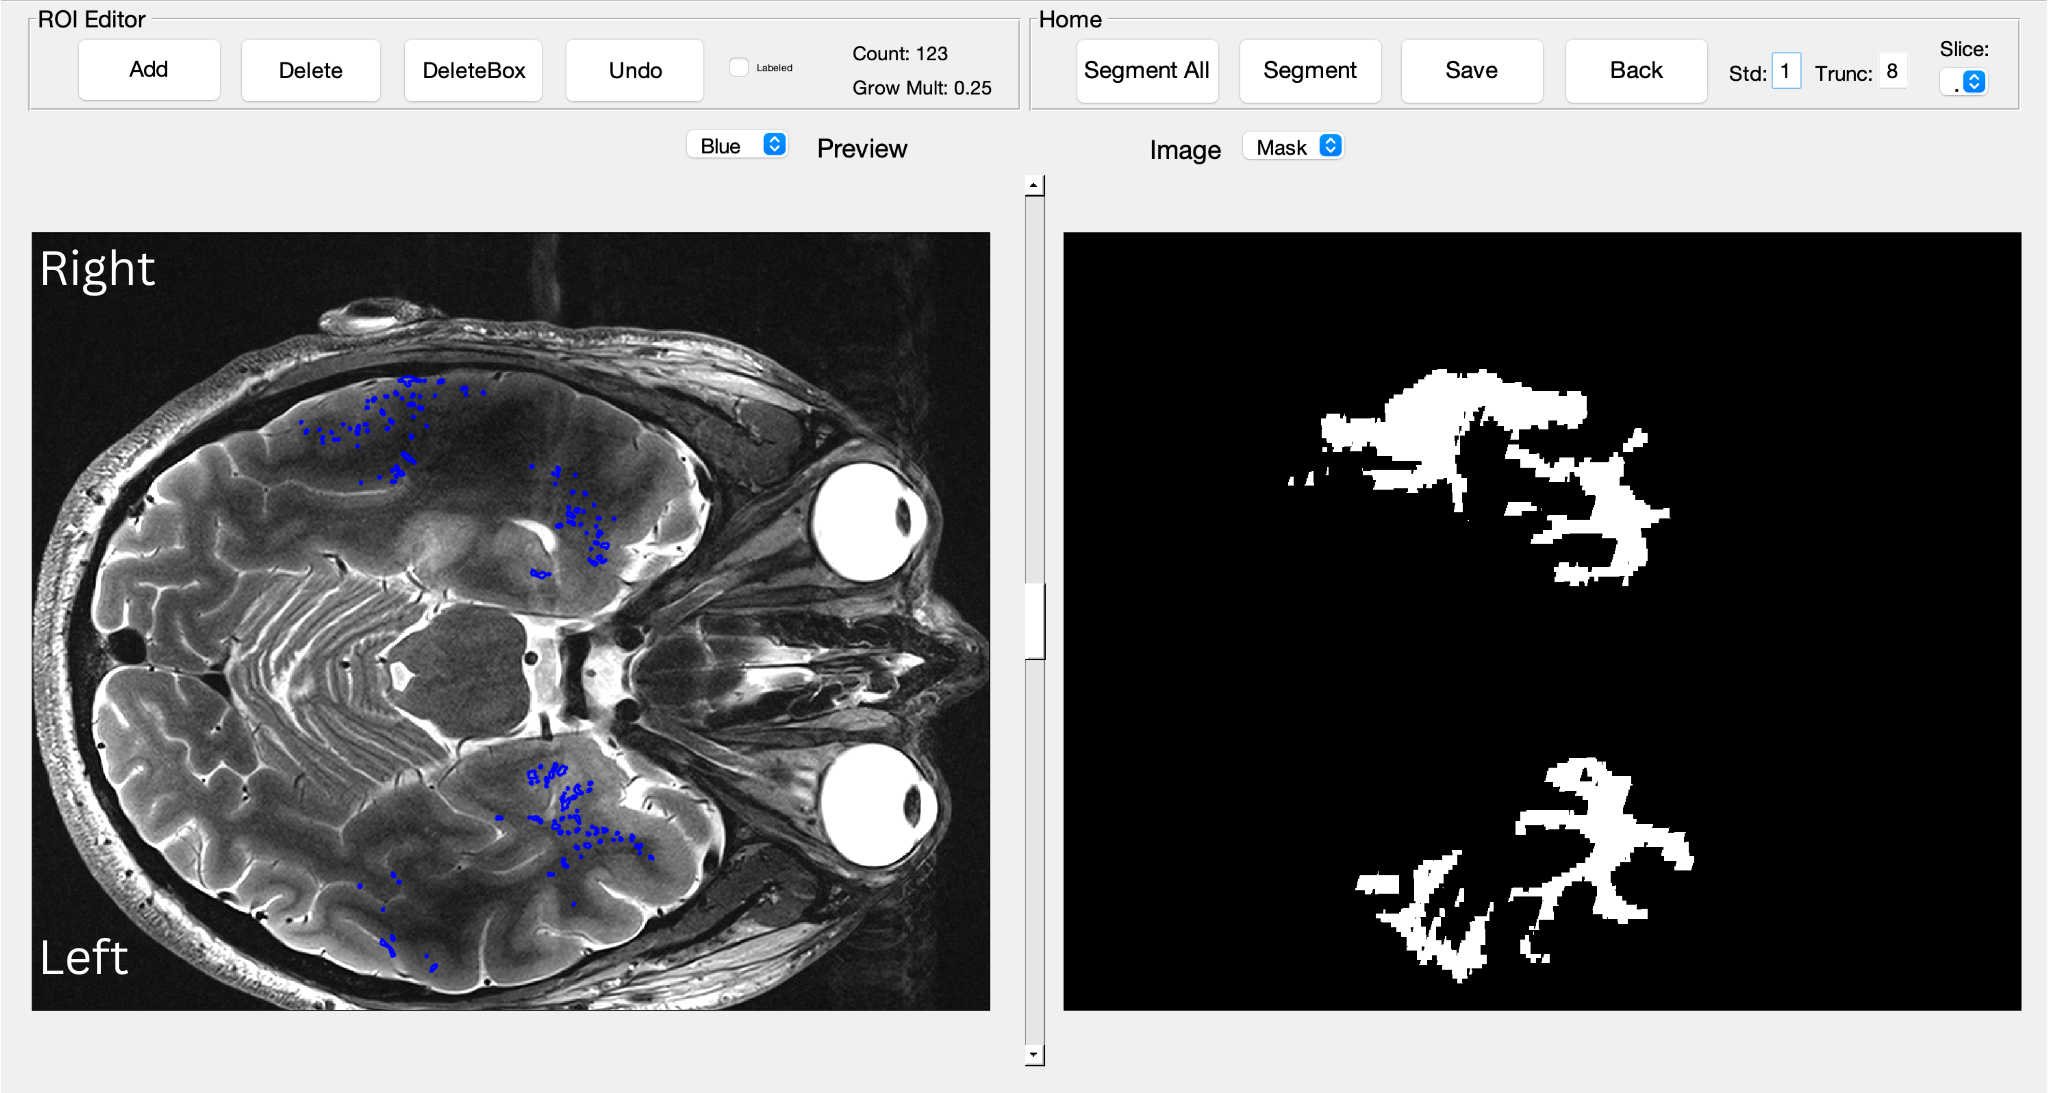
An exploratory analysis was performed in ten epilepsy patients with a primary diagnosis of left-side MTLE. Each subject underwent a 7T MRI (Magnetom, Siemens, Erlangen) (Table 1). All T1 images were preprocessed using FreeSurfer 7.2 (4), temporal masks were generated for left and right TL, from FreeSurfer white matter mask and coregistered to the T2TSE image and SWI mIP. The masks used to detect PVS using a frangi-based detection tool called PVSSAS (5) (Figure 1) and detect vessel segmentation using an automated vessel segmentation. Volume for TL, PVS, and vessel masks were calculated using FSL (6). Statistical analysis was performed using R and Python3. All data were tested for normality using Shapiro Wilks testing, Student’s t-test was used to assess the difference between total brain volume, temporal lobe volume, PVS count, PVS volume, vessel count, and vessel volume between left and right TL. The relationship between vascular metrics and temporal lobe volume was assessed using Pearson’s R and significant relationships between metrics were calculated using linear regression.Results
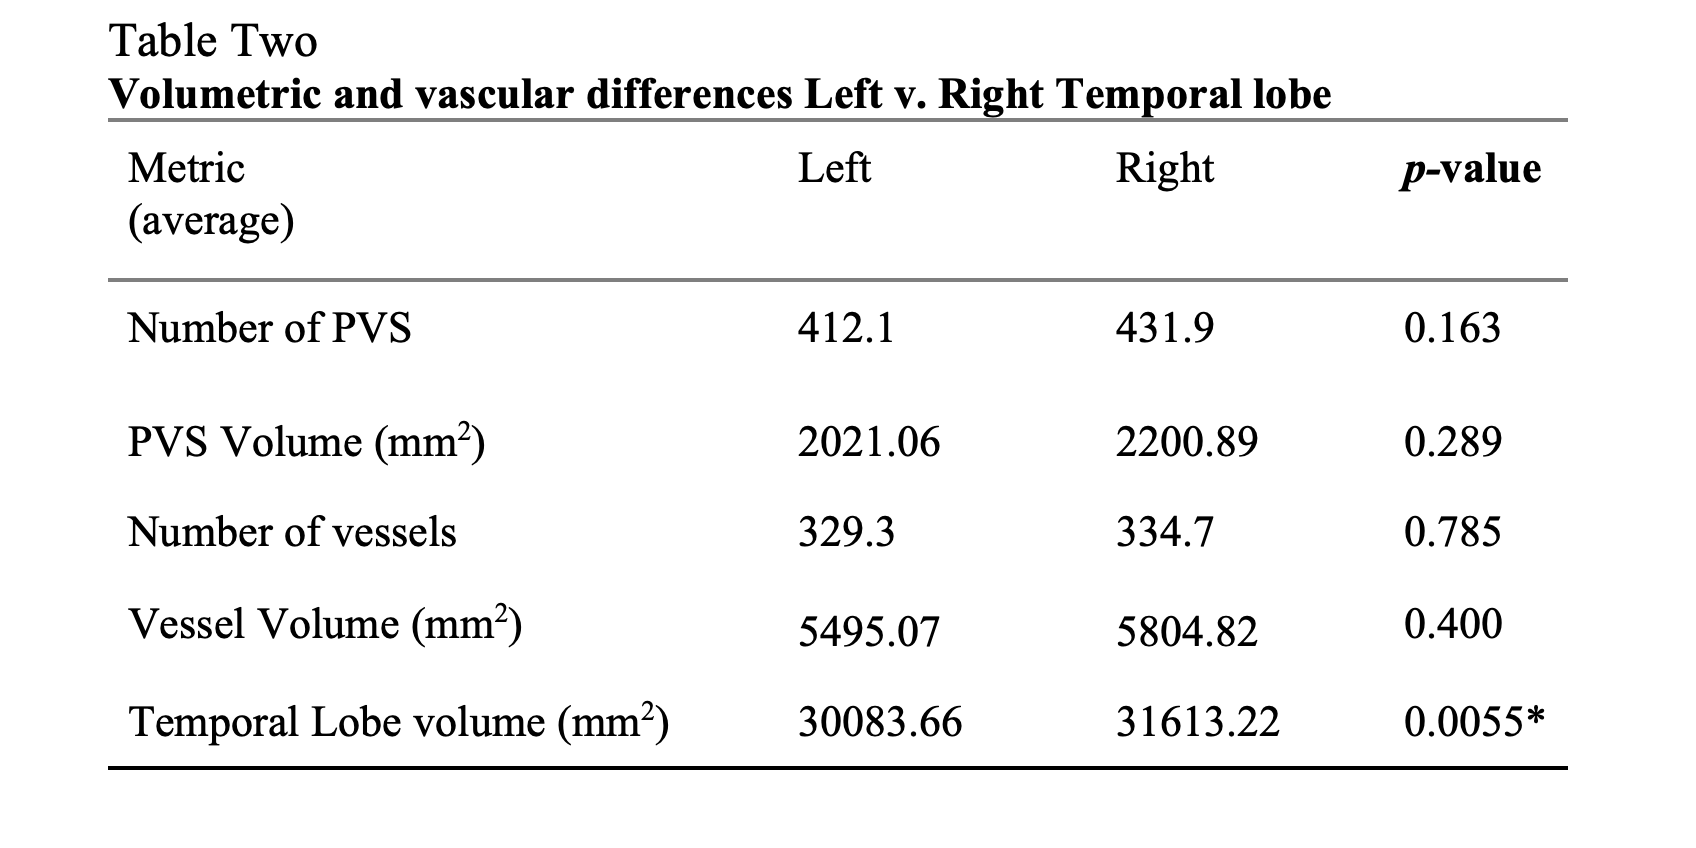
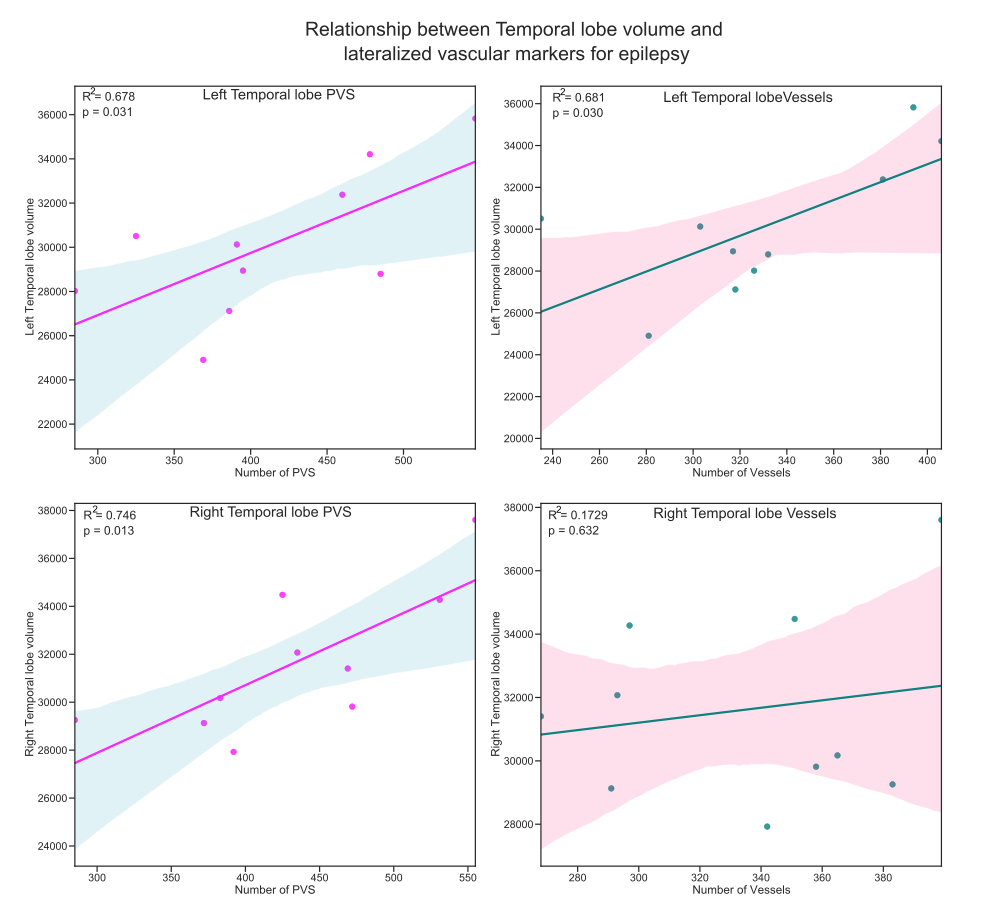
When assessing differences in volume between left and right temporal lobe, there was a significant reduction in left temporal lobe volume compared to right (p = 0.0055). There were no significant differences between sides in PVS or vessel count or volume. There were significant associations between number of left temporal lobe PVS (R=0.678, p=0.031), left temporal lobe vessels (R=0.681, p=0.030) and left temporal lobe volume as well as number of right temporal lobe PVS (R=0.746, p=0.013) and right temporal lobe volume (Table 2, Figure 2). There was no relationship between right temporal vessels and right temporal lobe volume or volume of either metric and lobe volume.Discussion
In this preliminary exploratory analysis, we assessed the difference between volume of the temporal lobe on side of the SOZ compared to unaffected side and associated volumetric findings with known imaging biomarkers that may be important in the pathophysiology of epilepsy. We found a significant reduction in left temporal lobe volume and positive associations with number of PVS and vessels. The reduction in volume may be indicative of side-specific changes resulting from localized seizure activity. While there was no significant difference in number or volume of PVS and vessels between sides, the positive correlations between number of PVS and both lobes and number of vessels and left lobe volume indicated that these markers may be independent of volume. Changes in vasculature or perivascular space accumulation within the side of affect may be independent of volume and disease specific effects may vary on the individual patient level. The number of PVS and vessels in association with volumetric changes may underlie epileptogenic processes and establish a relationship between known markers for vascular dysfunction and neuroinflammatory processes and consequences of seizure activity localized to a specific region of the brain, such as the SOZ. Additionally, it could indicate that PVS number could be an epilepsy imaging biomarker that is independent of white matter volumetric changes on the affected side. A larger sample size and comparison between healthy controls and right-MTLE patients is needed to further parse out these observations and disentangle the effects of the SOZ as well as these vascular and perivascular markers.Conclusion
We provide a metric which leverages ultra-high field neuroimaging to measure the association between vascular and perivascular imaging biomarkers and changes in volume on the side of seizure onset. This association and subtle changes in vascular markers may underlie epileptogenic processes and be independent of volume changes within the left or right temporal lobe related to SOZ in patients with MTLE.Acknowledgements
Natural Sciences and Engineering Research Council of Canada (NSERC), Department of Defense (W81XWH1910616*), and NIH R00NS070821References
1. Feldman, R. E., Marcuse, L. V., Verma, G., Brown, S. S. G., Rus, A., Rutland, J. W., Delman, B. N., Balchandani, P., & Fields, M. C. (2020). Seven‐tesla susceptibility‐weighted analysis of hippocampal venous structures: Application to magnetic‐resonance–normal focal epilepsy. Epilepsia, 61(2), 287-296. https://doi.org/10.1111/epi.16433
2. Ineichen, B. V., Okar, S. V., Proulx, S. T., Engelhardt, B., Lassmann, H., & Reich, D. S. (2022). Perivascular spaces and their role in neuroinflammation. Neuron, 110(21), 3566-3581. https://doi.org/10.1016/j.neuron.2022.10.024
3. Mestre, H., Kostrikov, S., Mehta, R. I., & Nedergaard, M. (2017). Perivascular spaces, glymphatic dysfunction, and small vessel disease. Clin Sci (Lond), 131(17), 2257-2274. https://doi.org/10.1042/CS20160381
4. Fischl, B., Liu, A., & Dale, A. M. (2001). Automated manifold surgery: constructing geometrically accurate and topologically correct models of the human cerebral cortex. IEEE transactions on medical imaging, 20(1), 70-80.
5. Langan, M. T., Smith, D. A., Verma, G., Khegai, O., Saju, S., Rashid, S., Ranti, D., Markowitz, M., Belani, P., Jette, N., Mathew, B., Goldstein, J., Kirsch, C. F. E., Morris, L. S., Becker, J. H., Delman, B. N., & Balchandani, P. (2022). Semi-automated Segmentation and Quantification of Perivascular Spaces at 7 Tesla in COVID-19 [Original Research]. Frontiers in Neurology, 13. https://doi.org/10.3389/fneur.2022.846957
6. M.W. Woolrich, S. Jbabdi, B. Patenaude, M. Chappell, S. Makni, T. Behrens, C. Beckmann, M. Jenkinson, S.M. Smith. Bayesian analysis of neuroimaging data in FSL. NeuroImage, 45:S173-86, 2009
Figures