0998
Multi-channel 7 Tesla sodium MRI of the brain in children with epileptogenic SCN1A sodium channel mutations – a pilot study1Department of Radiology, Imperial College Healthcare NHS Trust, London, United Kingdom, 2MR Research Unit, Queen Square MS Centre, Faculty of Brain Sciences, UCL Queen Square Institute of Neurology, London, United Kingdom, 3Department of Medical Physics and Biomedical Engineering, University College London, London, United Kingdom, 4Children's Neurosciences, Evelina London Children's Hospital at Guy's and St Thomas' NHS Foundation Trust, London, United Kingdom, 5Biomedical Engineering Department, School of Biomedical Engineering and Imaging Sciences, King's College London, London, United Kingdom, 6London Collaborative Ultra High Field System (LoCUS), London, United Kingdom, 7Melbourne Brain Centre Imaging Unit, The University of Melbourne, Parkville, Melbourne, Australia, 8Melbourne Neuropsychiatry Centre, The University of Melbourne, Parkville, Melbourne, Australia, 9Quantitative Imaging Group, Department of Medical Physics and Biomedical Engineering, University College London, London, United Kingdom, 10Department of Brain & Behavioural Sciences, University of Pavia, Pavia, Italy, 11Brain Connectivity Centre Research Department, IRCCS Mondino Foundation, Pavia, Italy
Synopsis
Keywords: Epilepsy, Non-Proton, brain, sodium MRI, high-field MRI, SCN1A
SCN1A gene mutations disrupt sodium channel (NaV1.1) function, causing childhood epilepsy which can be severe. Predicting functional consequences in these children is challenging and new prognostic imaging biomarkers are needed. Sodium MRI directly assesses brain sodium and is a potential in vivo imaging biomarker. Using a multiecho sodium sequence, at 7T, we found children with SCN1A mutations had increased relative sodium concentrations across a large number of brain regions compared to controls. The cause of this change is likely complex, and may reflect an interplay between neuronal/axonal/glial dysfunction – with disruptions in microstructure and physiology – and possible medication effects.Introduction
Epilepsy is the most common neurological disorder in children, affecting 1-2% of the population[1]. Mutations in genes encoding sodium channels are the most frequently identified associated genetic abnormality.Voltage-gated sodium channels initiate neuronal action potentials. Mutations in SCN1A, the gene encoding the sodium channel NaV1.1, cause a spectrum of epilepsy disorders that range from epilepsy with febrile seizures to severe disorders such as Dravet syndrome, which is associated with poor outcomes, including a high risk of sudden death[2]. There is a need for prognostic, non-invasive in vivo biomarkers to guide precision treatments.
Sodium MRI offers imaging of brain sodium concentration[3], which has given insights into conditions such as stroke[4], multiple sclerosis[5,6,7] and focal adult epilepsy[8,9]. To our knowledge, it has yet to be employed in a paediatric epilepsy population, with the body of work on paediatric sodium MRI generally limited[10]. Quantitative sodium relaxometry may offer insights into the sodium signal associated with different local environments. Using a multi-echo sodium sequence[11], with a multi-channel coil on a clinical 7T system, we performed an exploratory study to assess relative total sodium concentration (rTSC) and sodium T2* in healthy children and those with SCN1A mutations. This provides initial data to determine the effect size needed for larger study cohorts. Unlike structural causes of epilepsy, such as focal cortical dysplasias[8] we hypothesised that there may be more global alterations on both rTSC and T2* parameters in the brain.
Methods
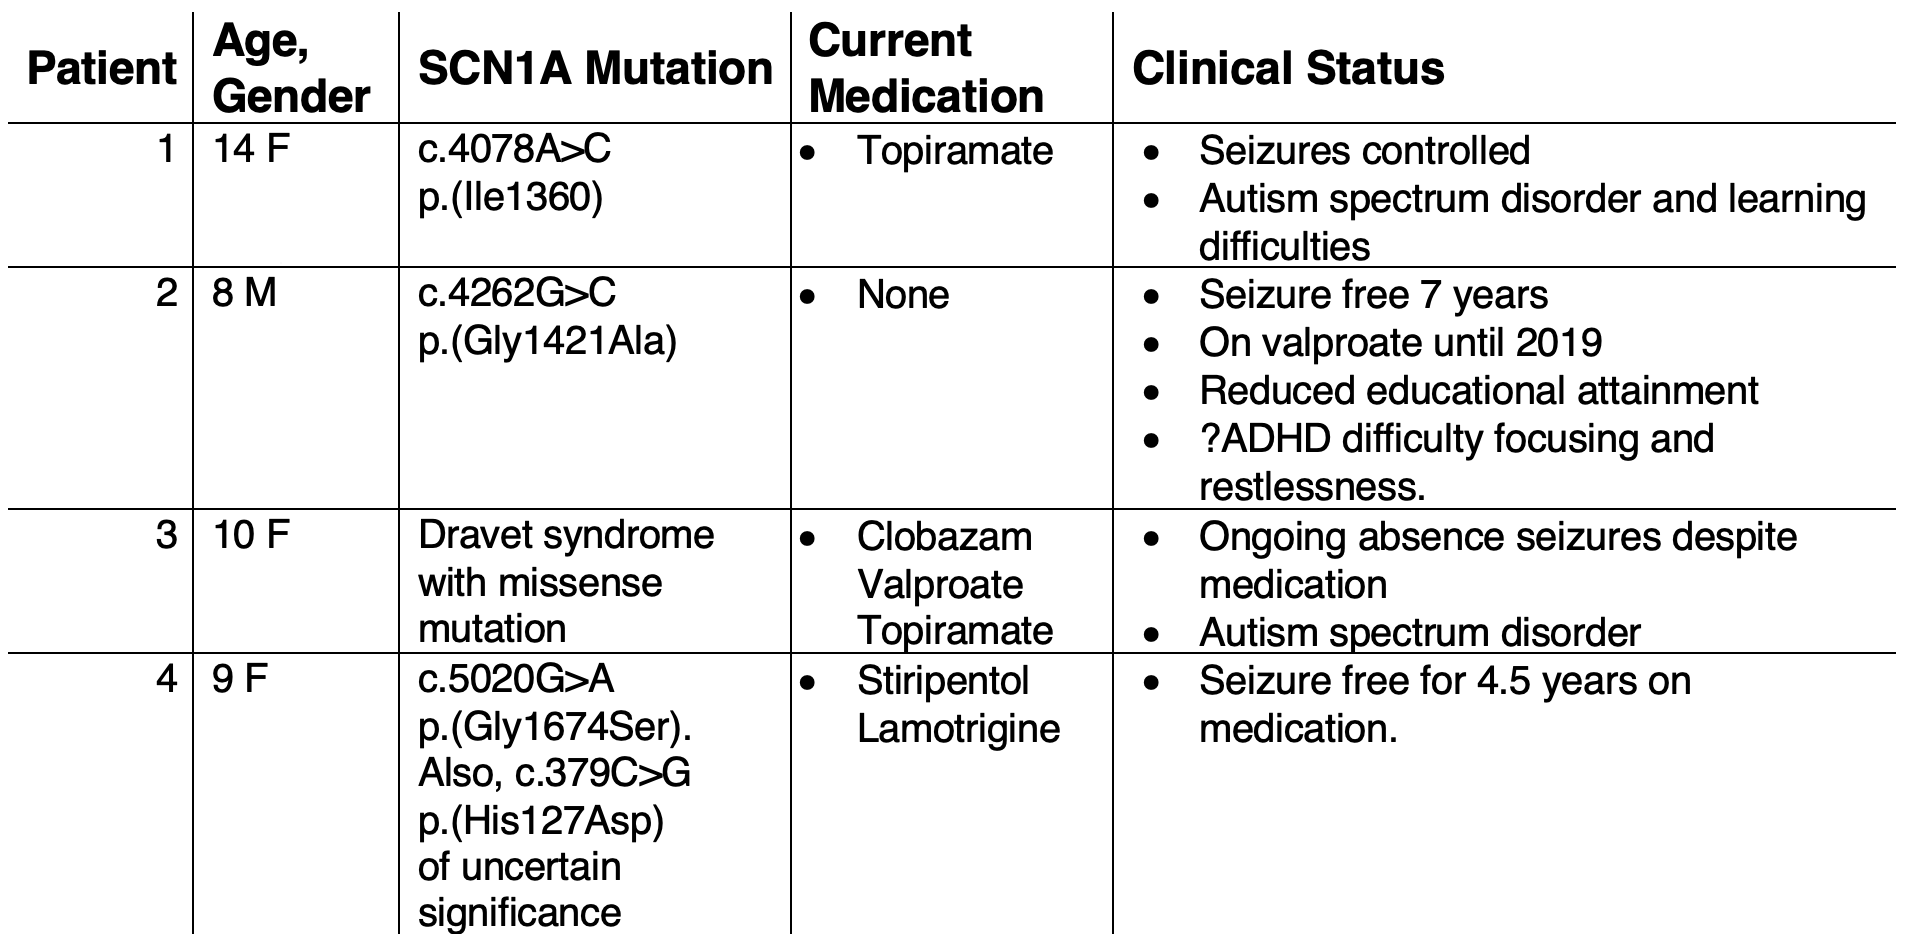
Imaging was conducted with local ethics committee approval. 4 patients with sodium channel mutations (aged 8-14 years, with a range of clinical severity, Table 1) and 8 children with no history of epilepsy or other significant medical conditions (aged 9-17 years, 7 males) were imaged.Image acquisition: MRI was conducted on a 7T MAGNETOM Terra system, in single transmit mode (Siemens Healthcare, Erlangen, Germany), using 32-channel receive/volume transmit 1H head coil for proton (Nova, Wilmington MA, USA) and a 32-channel/volume transmit 23Na head coil (Rapid Biomedical GmbH, Rimpar, Germany) for sodium imaging respectively. MP2RAGE T1-weighted images were acquired (0.65mm isotropic, TE/TR/FA1/FA2/TI1/TI2/Tacq=3.15ms/4sec/4deg/5deg/650ms/2.28sec/~7min)[12]. A multiecho radial sequence, MERINA[11], was used for sodium acquisition (3.1mm isotropic resolution, TE/TR/FA/Projections/Readout/Echoes/TAcq=0.35ms/151ms/90deg/2000/2ms/38/~5min). Three 5-minute acquisitions were acquired and averaged in image space (rTSC maps) or k-space (T2* maps).
Post-processing: Sodium multi-channel datasets were reconstructed with a SENSE-based reconstruction, using volume coil data as a reference[13]. Denoised ‘UNI’ T1-weighted datasets[14] were segmented into 33 brain regions using a deep learning segmentation (SynthSeg[15]). The resulting posterior segmentations were binarised using a threshold of >0.8. T1 datasets were affine registered to sodium data using niftyReg[16] and the resulting transforms applied to the segmentations. Voxel-by-voxel T2* maps were generated using a biexponential model[11,13] constrained to a 60/40% ratio of fast/slow T2* components. The initial 2 control subjects were not included owing to data quality issues. T2* maps were created for the subsequent 6 control subjects. For first echo sodium images, peak signal from the vitreous humour of both eyes was automatically segmented, to scale images, providing a relative sodium concentration map (rTSC). Repeated measures ANOVA (Prism 9.4.1, GraphPad Software) was performed on the rTSC and T2* maps to assess significant factors explaining data variance. To further assess patients on a more individual basis, Z-scores of regional T2* values in patients were calculated based on the control sample mean and standard deviation.
Results
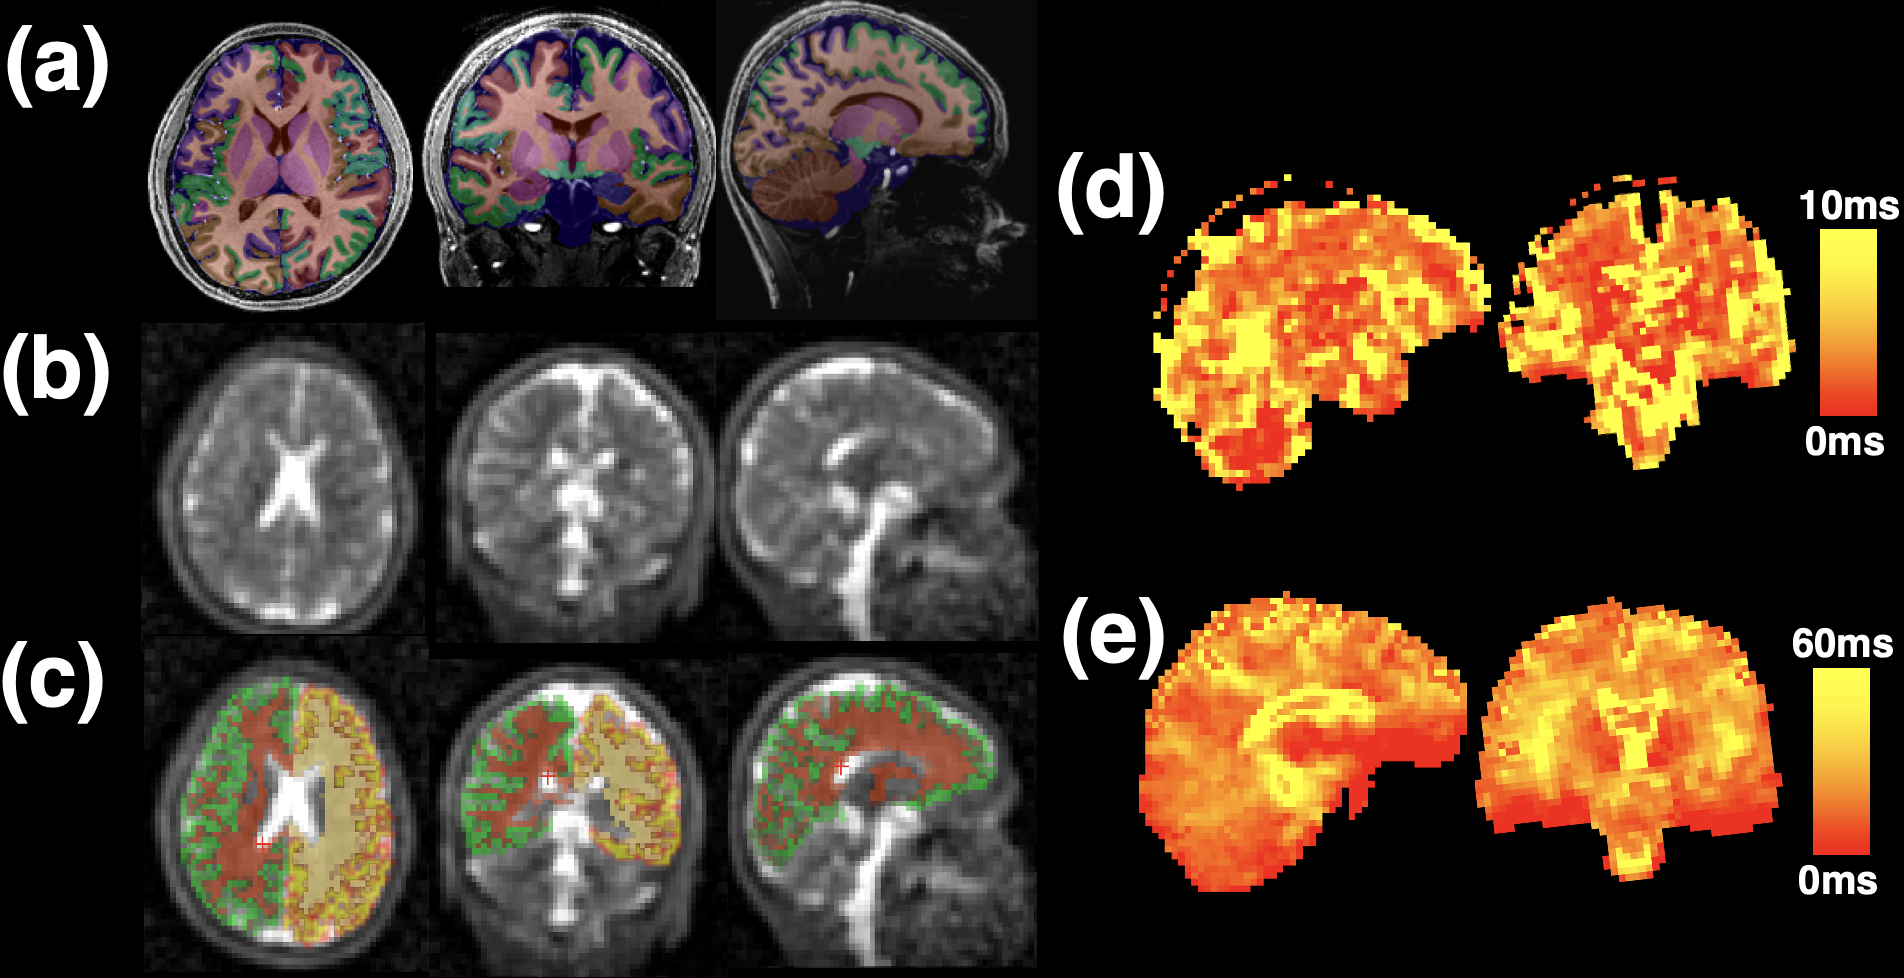
Characteristics of the 4 patients imaged and their clinical status are shown in Table 1.A typical first echo sodium image and sodium T2* maps are shown in Figure 1, as is a representative T1W MP2RAGE image with overlaid segmentations, with good alignment of segmentations achieved after affine registration to sodium space.
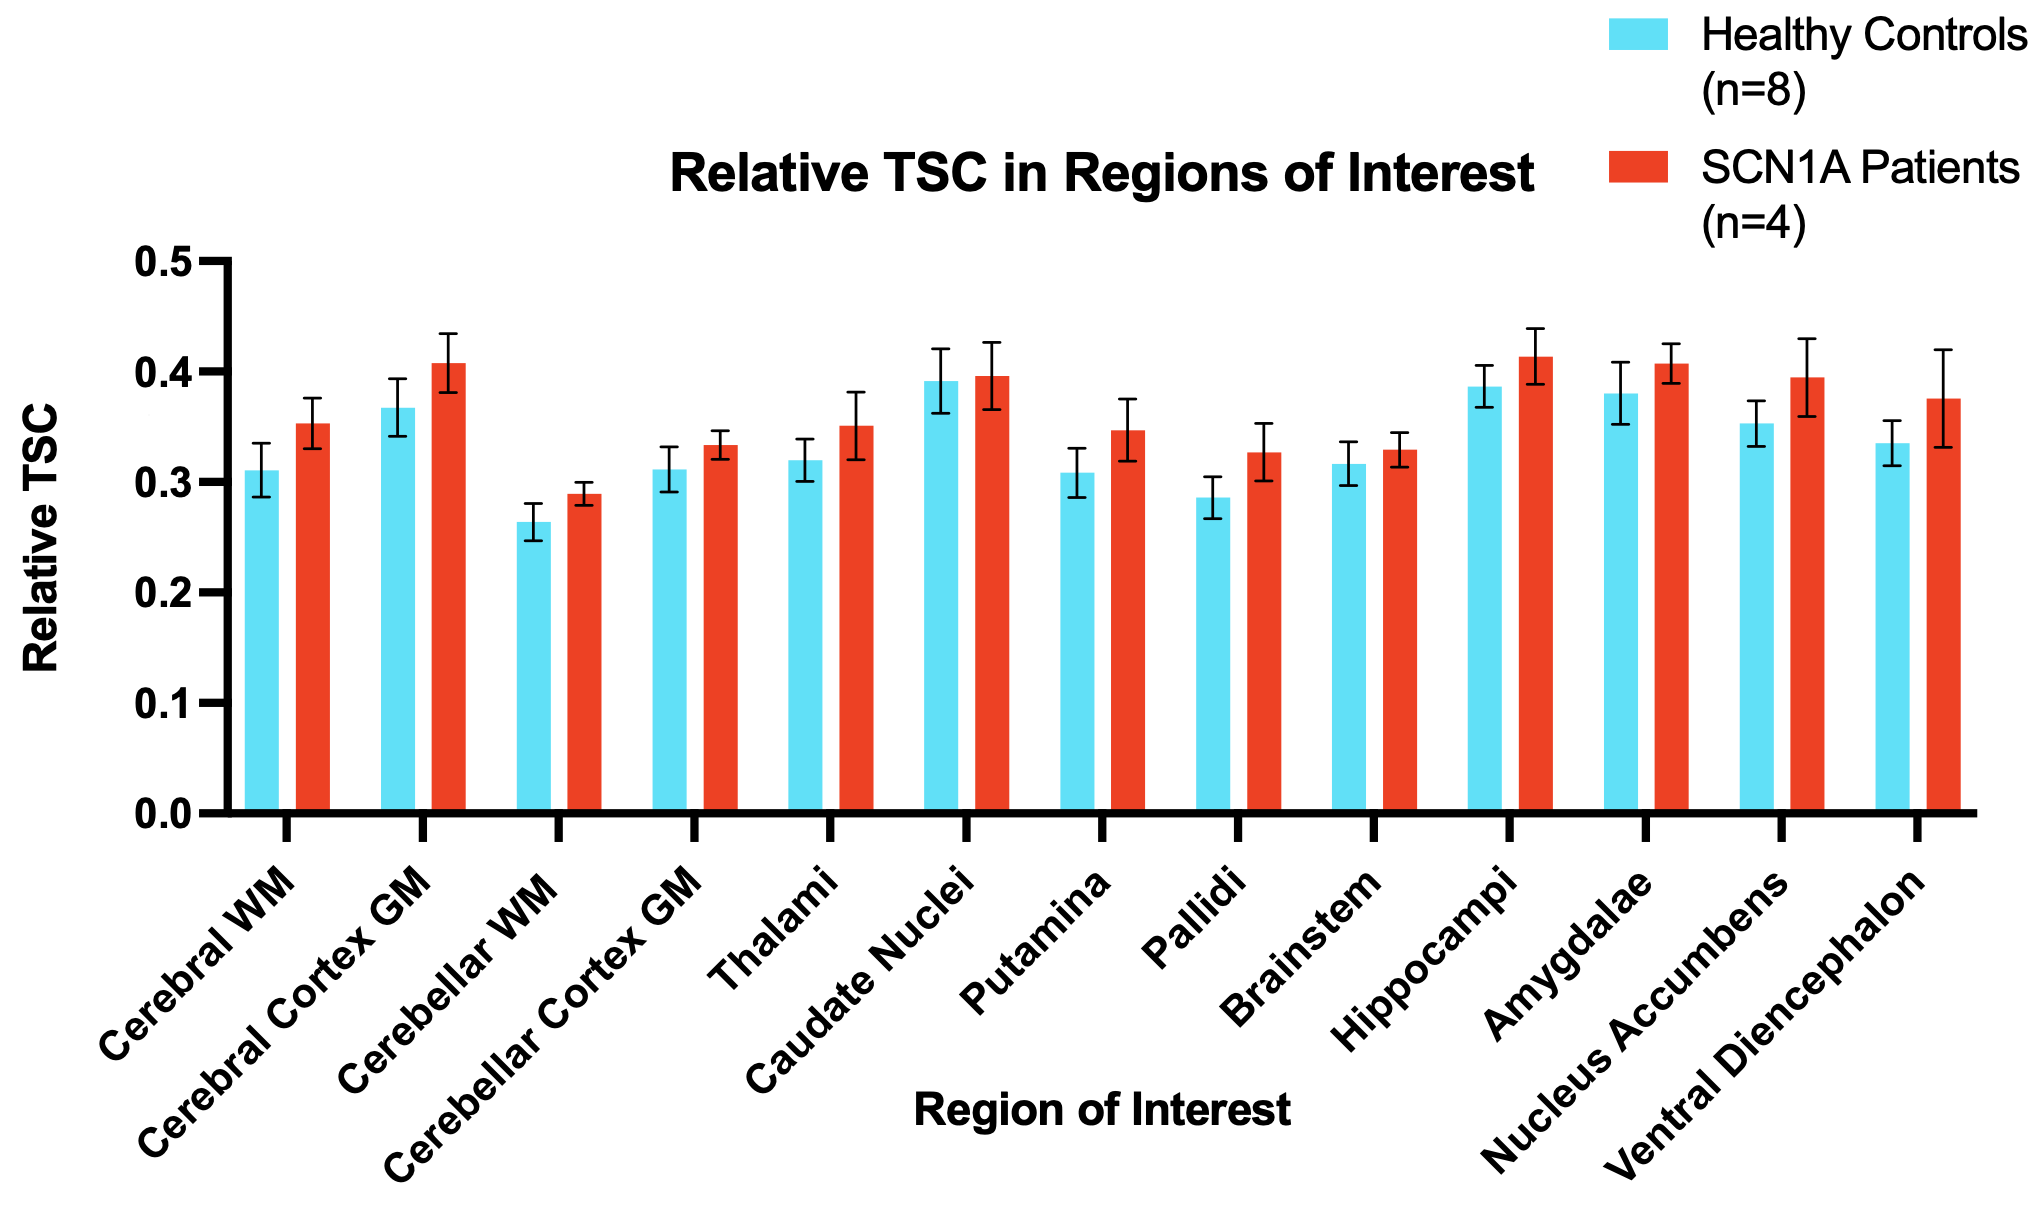
Overall, relative sodium concentration across the majority of brain regions was significantly increased in SCN1A patients (Figure 2) compared to controls (ANOVA: F=5.73, p=0.034).
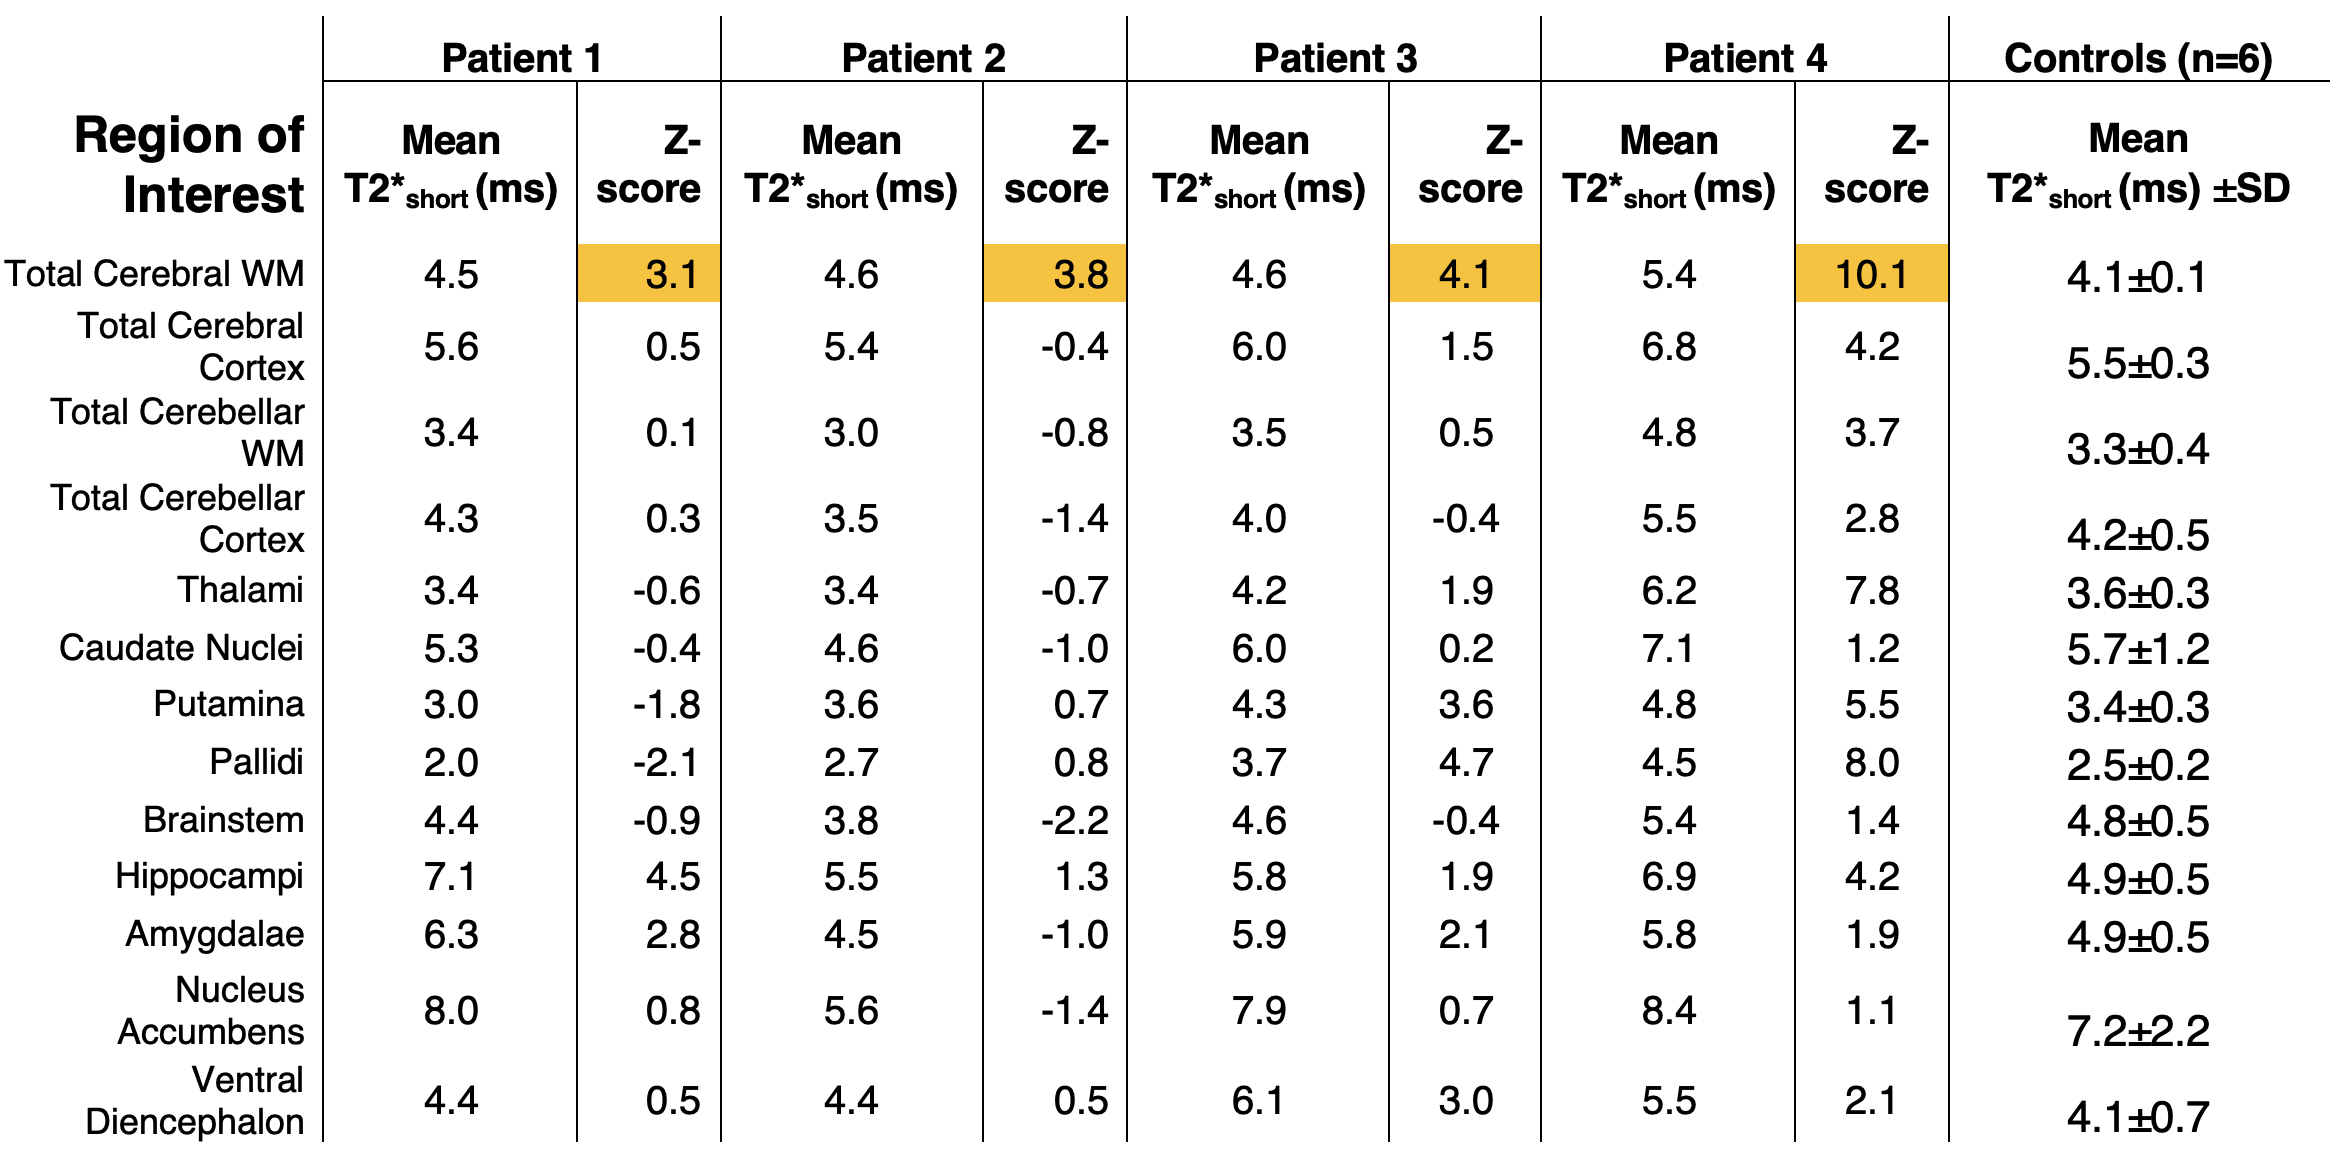
T2*long and T2*short values were consistent across regions between groups, with no significant difference on ANOVA. However, when comparing patients to the controls through an individualised regional Z-score, there was a trend of consistently high Z values across all patients in the cerebral white matter region of interest (Table 2).
Discussion and Conclusion
We have assessed rTSC and T2* values in patients with non-structural genetic epilepsy, identifying an increase in relative sodium concentration in patients with SCN1A mutations, in a wide number of brain regions. These findings are supported by previous work in focal epilepsy patients[8], reporting increases in TSC in the epileptogenic zone. The biophysical basis for this is complex and may be explained by several factors, including accumulation of sodium within tissues or increased extracellular volume fraction, possibly due to cell loss.Although a difference was not seen in group comparison of sodium T2* maps, a possible trend of higher T2*short values was observed with high Z-scores in white matter regions across patients, which could reflect an alteration of the sodium environment. Increased subject numbers are required to assess this further. Future work would also explore the use of advanced data models[17] which could reveal differences in the distribution of T2* and mean values.
Acknowledgements
Drs. David W. Carmichael and Shan-Shan Tang contributed equally to this work
Core funding and a pilot grant award was provided by the Wellcome/EPSRC Centre for Medical Engineering [WT203148/Z/16/Z] as well as by the National Institute for Health Research (NIHR) Biomedical Research Centre based at Guy’s and St Thomas’ NHS Foundation Trust and King’s College London and/or the NIHR Clinical Research Facility. The views expressed are those of the author(s) and not necessarily those of the NHS, the NIHR or the Department of Health and Social Care. (DWC, PB, SJM, ASD)
GOSHCC Sparks Grant V4419, King's Health Partners supported this work (DWC, ASD).
SR: EPSRC-funded UCL Centre for Doctoral Training in Intelligent, Integrated Imaging in Healthcare (i4health) (EP/S021930/1) and the Department of Health’s NIHR-funded Biomedical Research Centre at University College London Hospitals.
CAMGWK: Horizon2020 (Human Brain Project SGA3, Specific Grant Agreement No. 945539), BRC (#BRC704/CAP/CGW), MRC (#MR/S026088/1), Ataxia UK, MS Society (#77), Wings for Life (#169111). CGWK is a shareholder in Queen Square Analytics Ltd.
ME is supported by Action Medical Research [GN2835] and the British Paediatric Neurology Association. We are also thankful to the families who contributed their time to this research, and to our colleagues from the Evelina London Children Hospital, St Thomas’ Hospital and Centre for the Developing Brain.
This work was supported by a project grant awarded by Action Medical Research [GN2728], a Wellcome Trust Collaboration in science award [WT201526/Z/16/Z].
BSS: Wings for Life (#169111).
We are grateful to Prof. Leigh Johnston, Melbourne Brain Centre Imaging Unit, University of Melbourne, for helpful discussions.
References
1. Aaberg, K. M. et al. Incidence and Prevalence of Childhood Epilepsy: A Nationwide Cohort Study. Pediatrics 139, e20163908 (2017).
2. Escayg, A. & Goldin, A. L. Sodium channel SCN1A and epilepsy: Mutations and mechanisms. Epilepsia 51, 1650–1658 (2010).
3. Thulborn, K. R. Quantitative sodium MR imaging: A review of its evolving role in medicine. NeuroImage (2016) doi:10.1016/j.neuroimage.2016.11.056.
4. Tsang, A. et al. Relationship between sodium intensity and perfusion deficits in acute ischemic stroke. Journal of Magnetic Resonance Imaging 33, 41–47 (2011).
5. Inglese, M. et al. Brain tissue sodium concentration in multiple sclerosis: a sodium imaging study at 3 tesla. Brain 133, 847–857 (2010).
6. Paling, D. et al. Sodium accumulation is associated with disability and a progressive course in multiple sclerosis. Brain 136, 2305–2317 (2013).
7. Zaaraoui, W. et al. Distribution of brain sodium accumulation correlates with disability in multiple sclerosis: a cross-sectional 23Na MR imaging study. Radiology 264, 859–67 (2012).
8. Ridley, B. et al. Brain sodium MRI in human epilepsy: Disturbances of ionic homeostasis reflect the organization of pathological regions. NeuroImage 157, 173–183 (2017).
9. Azilinon, M. et al. Combining sodium MRI, proton MR spectroscopic imaging, and intracerebral EEG in epilepsy. Hum. Brain Mapp. (2022) doi:10.1002/hbm.26102.
10. Bhatia, A. et al. Quantitative Sodium (23Na) MRI in Pediatric Gliomas: Initial Experience. Diagnostics 12, 1223 (2022).
11. Blunck, Y. et al. 3D-multi-echo radial imaging of 23Na (3D-MERINA) for time-efficient multi-parameter tissue compartment mapping. Magnet Reson Med 79, 1950–1961 (2018).
12. Dokumaci AS, et al. Simultaneous Optimization of MP2RAGE T1-Weighted (UNI) and FLuid And White Matter Suppression (FLAWS) brain images at 7T using Extended Phase Graph (EPG) Simulations. Magn. Reson. Med. 2022;1-14. doi:10.1002/mrm.29479. [in press]
13. Rot S., et al. "Whole-brain bi-exponential 23Na-MRI T2* mapping at 7T with a 32-channel phased array receiver coil" in Submission to 2023 ISMRM & ISMRT Annual Meeting & Exhibition, 2022.
14. O’Brien K.R., et al. Robust T1-Weighted Structural Brain Imaging and Morphometry at 7T using MP2RAGE. PLoS ONE. 2014;9(6):e99676.
15. Billot B., et al. Robust Segmentation of Brain MRI in the Wild with Hierarchical CNNs and no Retraining. MICCAI 2022
16. Modat M., et al. Global image registration using a symmetric block- matching approach. Journal of Medical Imaging, 1(2), 024003–024003. (2014). doi:10.1117/1.JMI.1.2.024003
17. Syeda, W., et al. A continuum of T2* components: Flexible fast fraction mapping in sodium MRI. Magnet Reson Med 81, 3854–3864 (2019).
Figures