0997
7T metabolic MRI in mesial temporal lobe epilepsy1Department of Radiology and Nuclear Medicine, University Medical Center Utrecht, Utrecht, Netherlands, 2Department of Medical Imaging, Radboud University Medical Center, Nijmegen, Netherlands, 3Spinoza Centre for Neuroimaging Amsterdam, Amsterdam, Netherlands, 4UMC Utrecht Brain Center, Department of Neurology and Neurosurgery, University Medical Center Utrecht, Utrecht, Netherlands, 5Department of Pathology, University Medical Center Utrecht, Utrecht, Netherlands, 6Department of Pathology, Amsterdam University Medical Center, location AMC, Amsterdam, Netherlands, 7Stichting Epilepsie Instellingen Nederland (SEIN), Heemstede, Netherlands
Synopsis
Keywords: Epilepsy, Metabolism
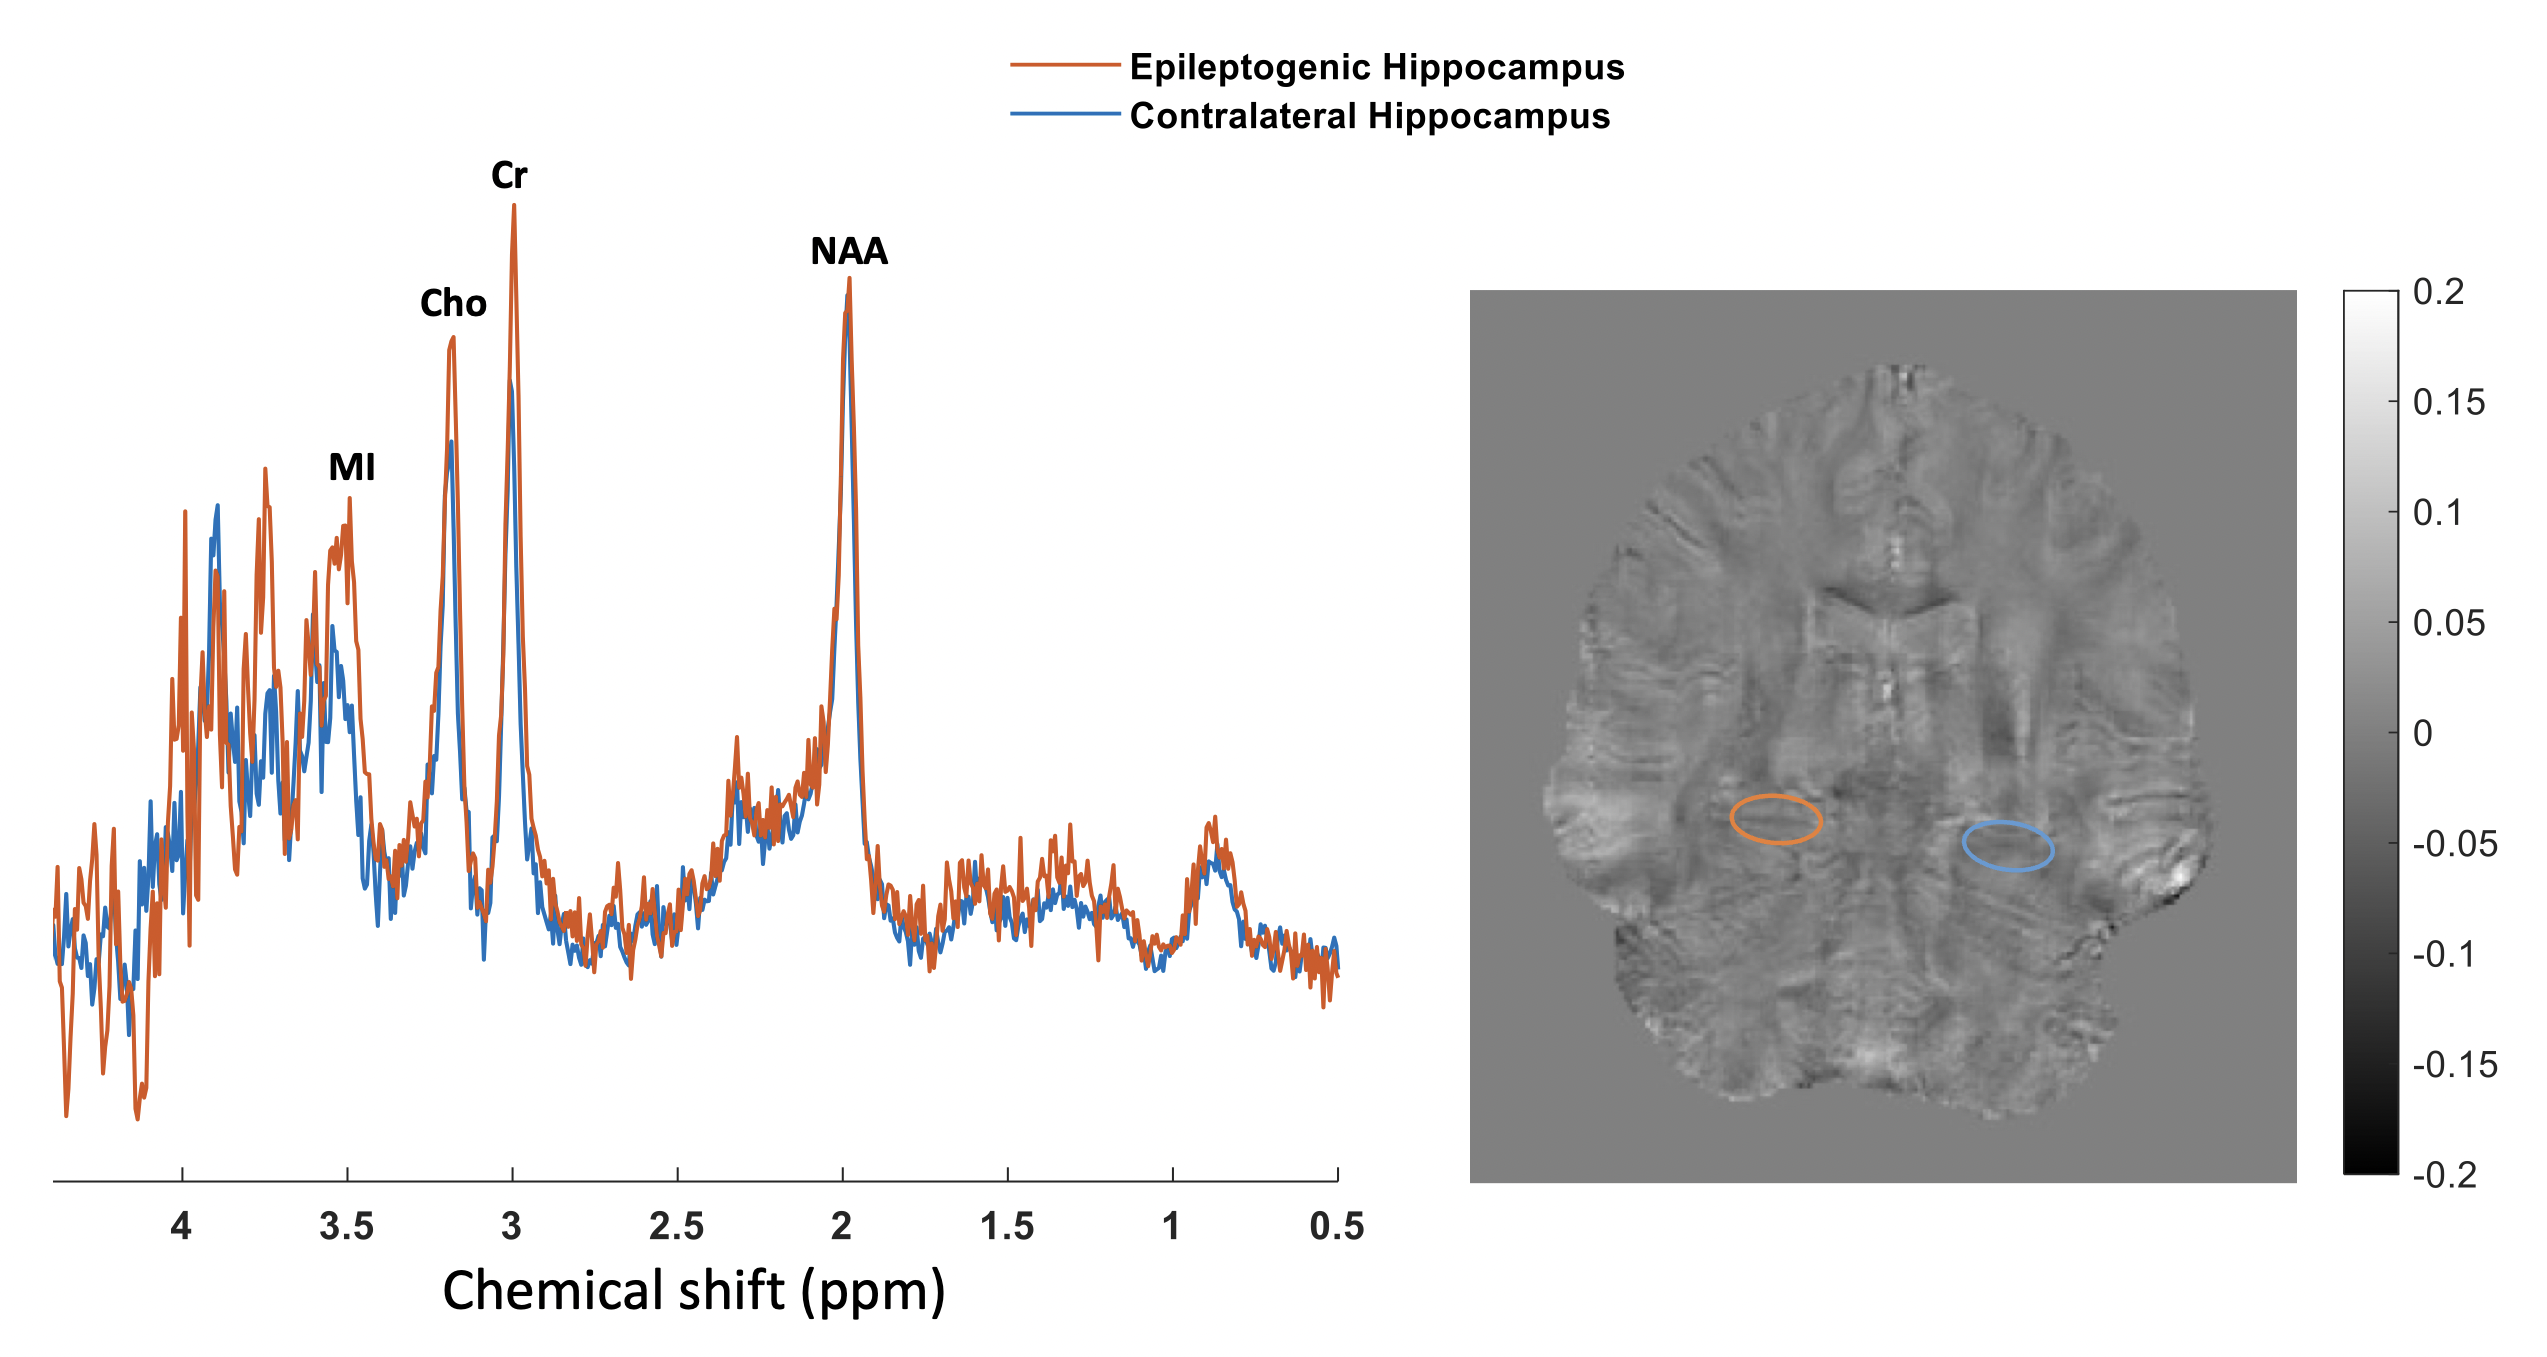
We combined quantitative susceptibility mapping (QSM) and single voxel (SV) 1H magnetic resonance spectroscopy (MRS) at 7 tesla (7T) with the aim to characterize mesial temporal lobe epilepsy (mTLE). We discovered in 9 patients that the distribution of quantified susceptibly is negatively skewed in epileptogenic hippocampi compared to contralateral hippocampi, meaning more positive susceptibility values: an indicator for iron deposition. No differences in metabolite ratios could be seen in 7 patients between hippocampi, however our small sample size precludes any final conclusions.Temporal lobe epilepsy (TLE), often drug-resistant, is the most common type of focal epilepsy with hippocampal sclerosis (HS) as the most common depicted pathology on conventional magnetic resonance imaging (MRI). However, 30% of electroclinical TLE patients do not show pathology on conventional MRI, deeming them MRI-negative. To enable surgical treatment, an epileptogenic lesion must be found otherwise.
Metabolic alterations in epileptogenic lesions have been reported in recent years. As such, metabolic MRI could be of added diagnostic value. For example, locally increased concentrations of glutamate have been found in epileptogenic lesions, using MR spectroscopy (MRS). Elevated glutamate levels are associated with mitochondrial and metabolic injury in epilepsy, and could therefore serve as a metabolic biomarker.
Furthermore, iron deposition has been found in HS using histopathological staining and is a potential marker of oxidative stress. Quantitative susceptibility mapping (QSM) could be used to pick up iron deposition in epileptogenic hippocampi.
QSM and MRS may be utilized as metabolic MRI, an umbrella term for MRI techniques visualizing metabolic pathways, especially performing well at ultra-high field with increased SNR as well as spectral dispersion. In this ongoing clinical trial, we aim to find (combinations of) metabolic markers, or metabolic profiles, of epileptogenic lesions that can be detected with 7T metabolic MRI.Here we present the preliminary results of QSM and single voxel (SV) 1H MRS in ten patients with mTLE.
Methods
Ten patients (aged 27-50 years; seven females) with mTLE with a hippocampal lesion on structural 3T MRI and/or positron emission tomography (PET) and scheduled for surgical treatment were included. This clinical trial was approved by our IRB; all participants gave written informed consent.
MRI examination
All patients underwent a 7T (Philips, Best, the Netherlands) MRI examination with a 32-channel receive and 8-channel transmit head coil (Nova Medical) the day prior to their surgery. Next to QSM and SV 1H MRS (sLASER; TE 36 ms, TR 5000 ms, NSA 64, VAPOR (300 Hz) water suppression), we acquired a high-resolution (0.5mm3) T1-weighted magnetization-prepared 2 rapid acquisition gradient echo (MP2RAGE) sequence for FOV planning of the QSM and MRS voxel as well as hippocampus segmentation.
Post-processing & data analysis
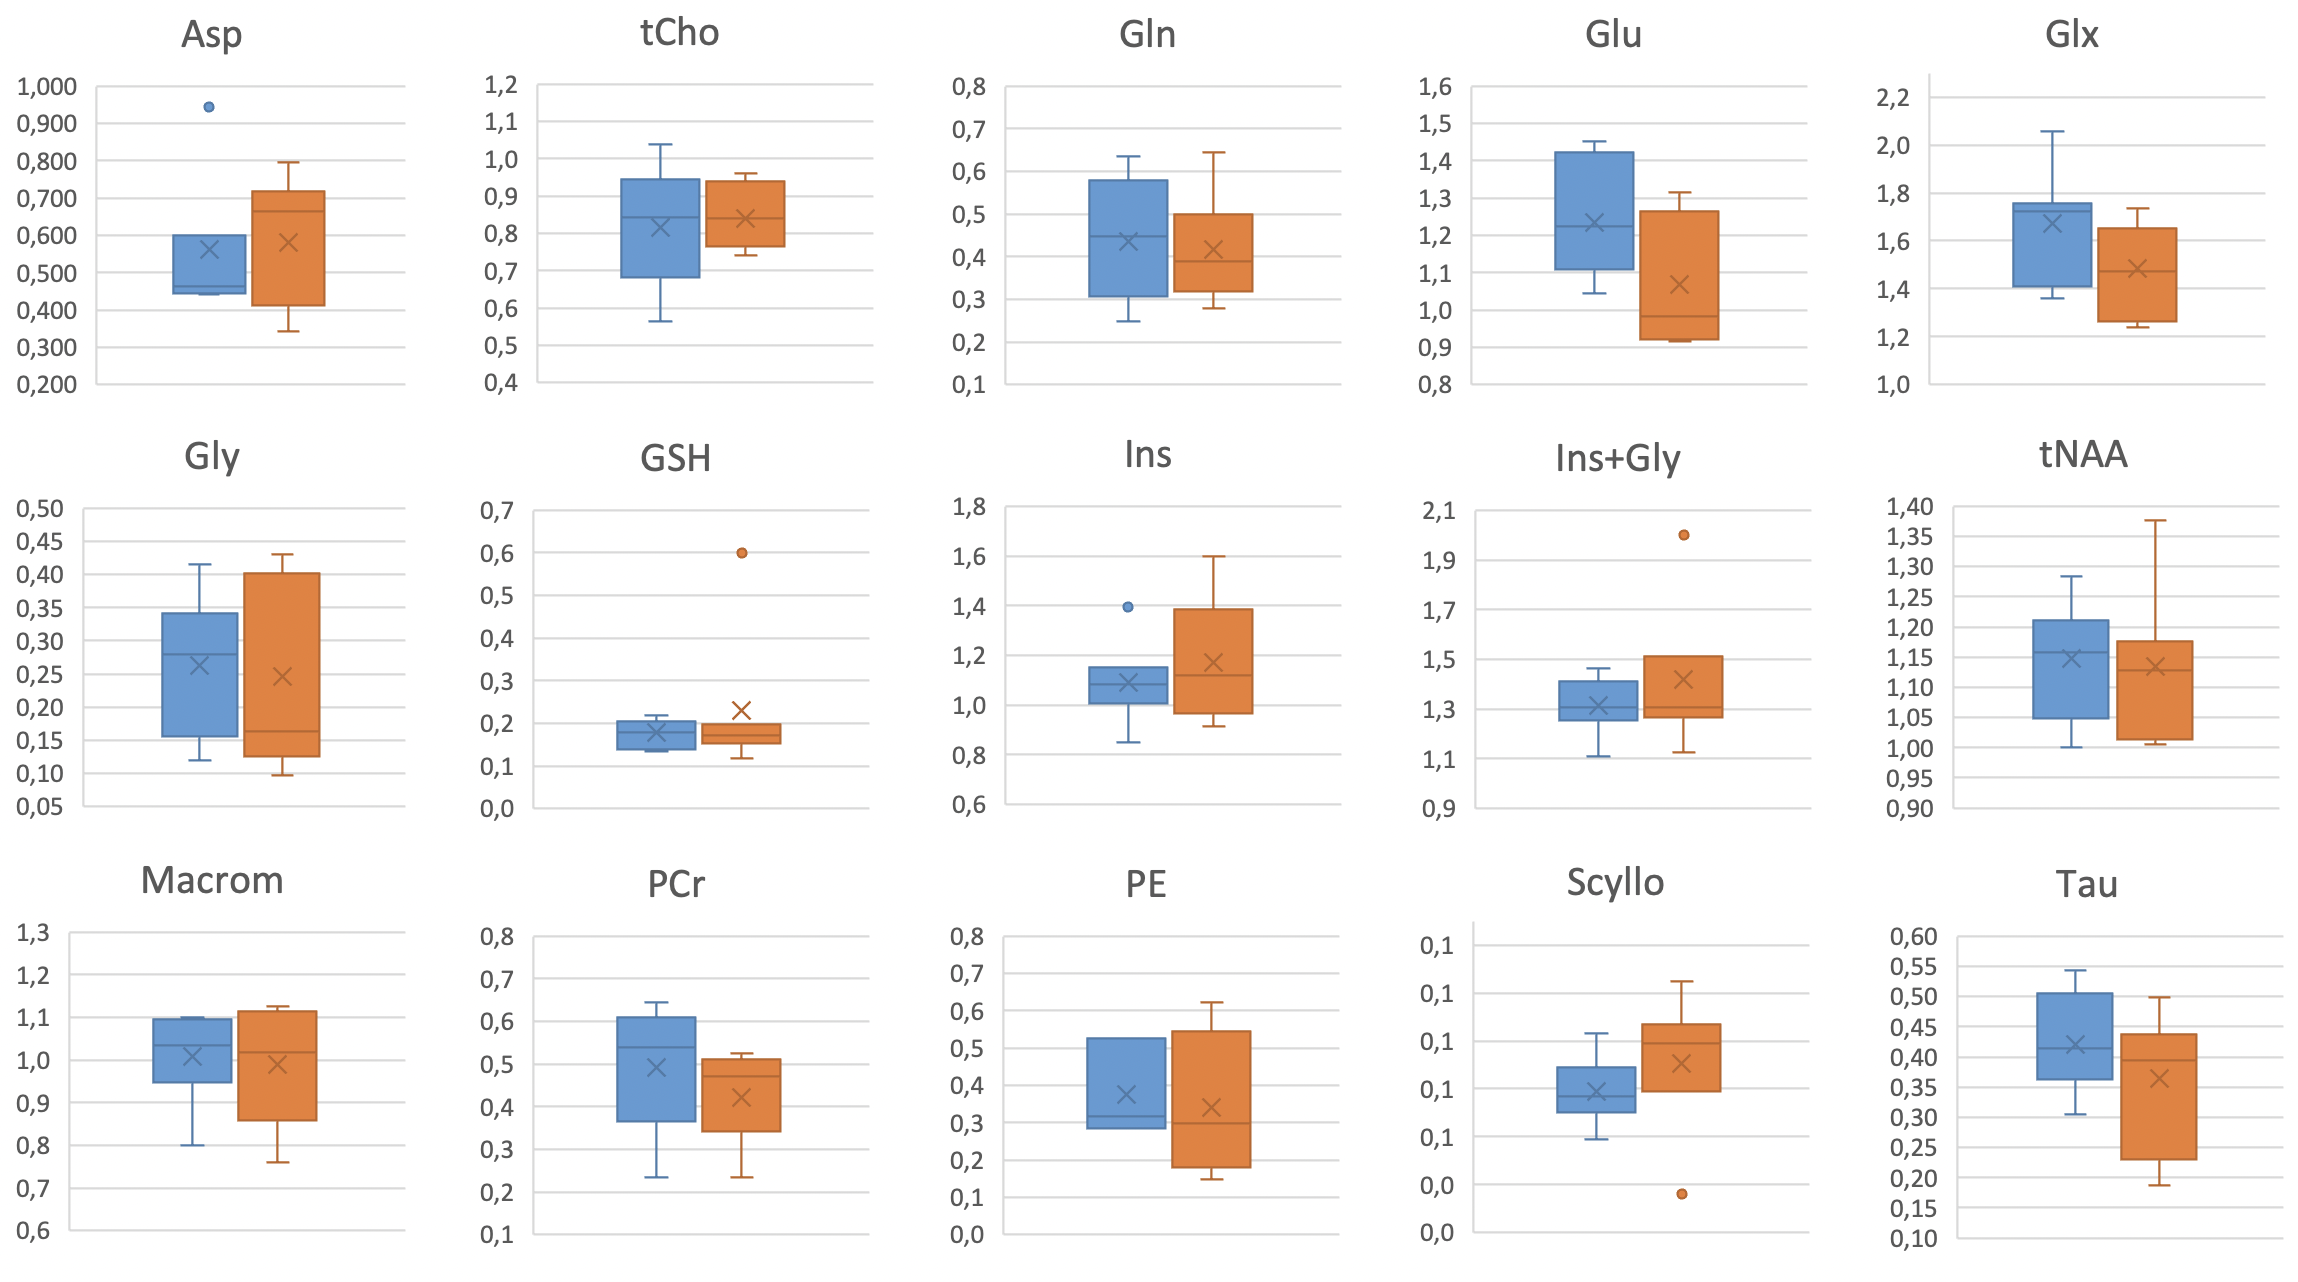
QSM data were post-processed with the SEPIA tool, using Laplacian-based phase unwrapping, projection on to dipole fields (PDF) background field removal and the streaking artifact reduction for QSM (STAR-QSM) method, for computing the susceptibility maps. Both hippocampi were segmented on the T1-weighted MP2RAGE images and subsequently registered to QSM maps using FSL FIRST and FLIRT, respectively (REF). The MRS data was analyzed using LCModel with a simulated basis set. Correction was performed for water T2 relaxation time, assuming a T2 of water of 41.2 ms in the deep gray matter. Metabolites were quantified as ratios with respect to total creatine. Only metabolites quantified with a Cramér Rao Lower Bound of ≤50% were reported.
Statistical analysis
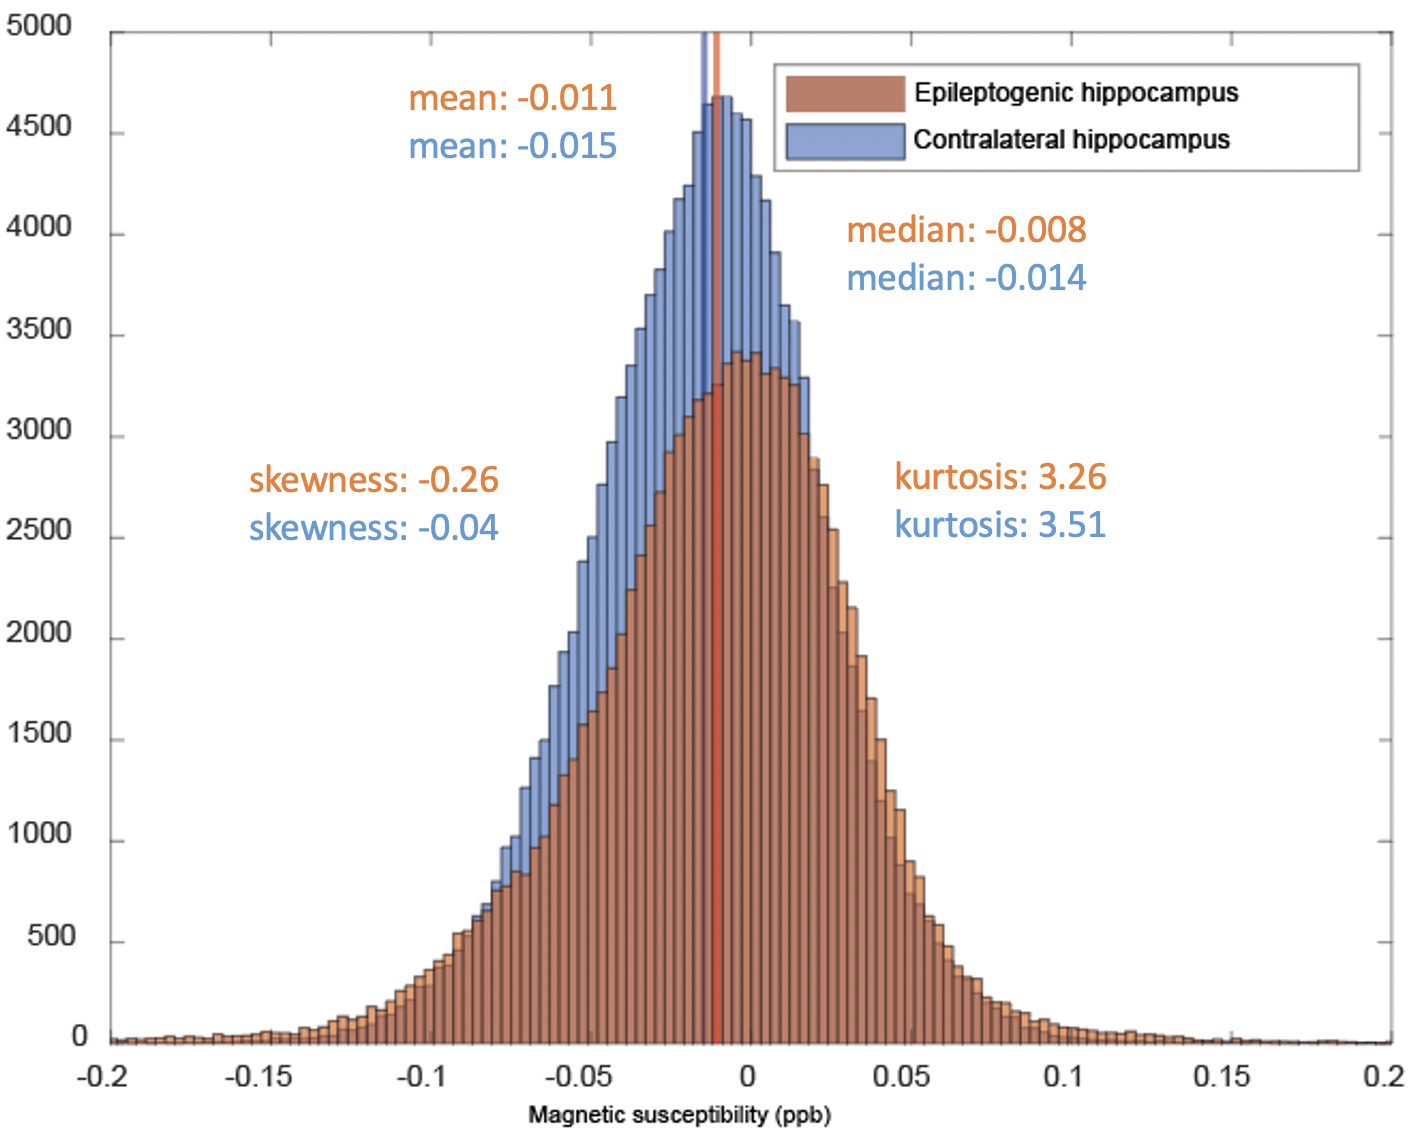
Descriptive statistics (mean, median, skewness, kurtosis) of the quantified susceptivity values and the mean metabolite ratios between epileptogenic and contralateral hippocampi were analyzed using Wilcoxon signed rank tests. A p value of <0.05 was considered statistically significant.
Results
QSM
One patient was excluded due to severe artifacts in the QSM maps, probably arising from head motion. The remaining nine patients showed different distributions of quantified susceptibility between epileptogenic and contralateral hippocampi with an evident difference in skewness (-0.04 vs -0.25; p=0.05) (Figure 1,2). More specifically, the epileptogenic hippocampi showed a more negative skewness, meaning more positive susceptibility values compared to the contralateral hippocampi.
SV 1H-MRS
Spectra from three patients suffered from insufficient water suppression and were therefore excluded. In the remaining seven patients, no differences in metabolite ratios were seen between epileptogenic and contralateral hippocampi (Figure 1,3).
Discussion
In this ongoing clinical trial we used the metabolic MRI sequences QSM and SV 1H MRS at 7T to characterize mTLE lesions, in an attempt to uncover potential characteristic metabolic markers that may eventually help identify the epileptogenic lesion in MRI-negative epilepsy patients. Our results show that while SV 1H MRS failed to identify metabolites that were characteristic of the epileptogenic hippocampus, QSM showed a skewed distribution towards positive susceptibility values in the epileptogenic hippocampi compared to the contralateral ones. This points towards an increased amount of iron in the epileptogenic hippocampus, which could be caused by an increased presence of macrophages. Macrophages have been associated with epilepsy, but are difficult to visualize in vivo in a non-invasive manner. Our results show that QSM might be used as an indirect technique to visualize these inflammatory cells. As a next step we will validate this with histology on the tissue samples obtained during surgery.
Acknowledgements
No acknowledgement found.References
Lamberink HJ, Otte WM, Blümcke I, et al. European Epilepsy Brain Bank writing group; study group; European Reference Network EpiCARE. Seizure outcome and use of antiepileptic drugs after epilepsy surgery according to histopathological diagnosis: a retrospective multicentre cohort study. Lancet Neurol. 2020 Sep;19(9):748-7572. Dwivedi R, Ramanujam B, Chandra PS, et al. Surgery for Drug-Resistant Epilepsy in Children. N Engl J Med. 2017 Oct 26;377(17):1639-16473. Nguyen DK, Mbacfou MT, Nguyen DB, et al. Prevalence of nonlesional focal epilepsy in an adult epilepsy clinic. Can J Neurol Sci 2013; 40: 198–2024. Zimmer TS, Ciriminna G, Arena A, et al. Chronic activation of anti-oxidant pathways and iron accumulation in epileptogenic malformations [published online ahead of print, 2019 Dec 23]. Neuropathol Appl Neurobiol. 2019;10.1111/nan.125965. Shams Z, van der Kemp WJM, Emir U, et al. Comparison of 2-Hydroxyglutarate Detection With sLASER and MEGA-sLASER at 7T. Front Neurol. 2021 Sep 7;12:7184236. Streaking artifact reduction for quantitative susceptibility mapping of sources with large dynamic range NMR Biomed., 28 (2015), pp. 1294-1303 T. Liu, I. Khalidov, L.D. Rochefort, P. Spincemaille, J. Liu, A.J. Tsiouris, Y. Wang7.A novel background field removal method for MRI using projection onto dipole fields (PDF)NMR Biomed., 24 (2011), pp. 1129-1136 Chan KS, Marques JP. SEPIA-Susceptibility mapping pipeline tool for phase images. Neuroimage. 2021 Feb 15;227:117611. doi: 10.1016/j.neuroimage.2020.117611. Epub 2020 Dec 10. PMID: 33309901.1. Marjańska M, Auerbach EJ, Valabrègue R, Van de Moortele PF, Adriany G, Garwood M. Localized 1H NMR spectroscopy in different regions of human brain in vivo at 7 T: T2 relaxation times and concentrations of cerebral metabolites. NMR Biomed. 2012;25(2):332-339. doi:10.1002/nbm.1754
Figures